


DEVELOPING AN EARLY WARNING SYSTEM FOR FINANCIAL CRISES IN VIETNAM

1Fresenius University, Munich/Germany
2Berlin School of Economics and Law, Berlin/Germany
ABSTRACT
In this paper, we develop an applicable early warning model that can predict financial crises for Vietnam. To achieve this goal, we analyze and extend the existing early warning models which have been developed by Kaminsky et al. (1998);Goldstein et al. (2000) and Edison (2003) by using the signal approach. The model observes several indicators (signals) that tend to have an unusual behavior in the periods preceding a financial crisis. When an indicator exceeds or falls below a given threshold, then it sends a “signal” that a financial crisis might occur within a certain period (12 or 24 months). We use 14 most relevant indicators to predict potential crises in Vietnam’s economy. In terms of practice, policy makers should have better insights about the vulnerability of the economy in order to recognize financial crises at an earlier stage. Therefore, the authors offer some recommendations for policy makers how to achieve the highest efficiency in warning and preventing future financial crises in Vietnam.
© 2017 AESS Publications. All Rights Reserved.
Keywords:Early warning system, Financial crisis, Emerging markets, Vietnam’s economy, Signal approach model, Crisis prediction.
JEL Classification: E17, G01, G28.
Received: 30 November 2016/ Revised: 30 December 2016/ / Accepted: 9 January 2017/ Published: 21 January 2017
Contribution/ Originality:
The paper contributes the first logical analysis to develop an early warning model for predicting financial crises in Vietnam. The study will help Vietnamese policy makers to understand more about the vulnerability of Vietnamese economy in order to prevent future financial crises in Vietnam.
1. INTRODUCTION
Financial crises in recent decades such as banking and debt crises have been the subject of extensive research after their recurrence, see Berg and Pattillo (1999); Reinhart and Rogoff (2008); Reinhart and Rogoff (2009); Adrian and Shin (2009); Obstfeld et al. (2009); Frankel and Saravelos (2010) and Babecký et al. (2012). The framework of models which are designed to foresee financial crises is often referred to ‘early warning systems’. These models try to predict financial crises by tracking their major determinants. The seminal work of Kaminsky et al. (1998) was one of the first studies on “early warning systems” for financial crises. Other studies on financial crises have tried to apply the “early warning systems” by using different datasets and estimation techniques. Martinez-Peria (2002); Fratzscher (2003); Abiad (2003) used the so called Markov-switching approach to build up their models of “early warning”. Berg and Pattillo (1999); Demirguc-Kunt and Detragiache (2000); Bussiere and Fratzscher (2006); Frost and Saiki (2014) have applied logit/probit models. Other authors such as Edison (2003); Cesmeci and Onder (2008); El-Shagi et al. (2013) as well as Megersa and Cassimon (2015) have used the so called signals approach to predict financial crises.
In this paper, we develop an applicable early warning model that can predict financial crises for Vietnam. Especially, we want to analyze the vulnerability of Vietnam’s economy to different shocks. In order to achieve this goal, we analyze and extend the existing early warning models which have been developed by Kaminsky et al. (1998); Goldstein et al. (2000) and Edison (2003) by using the signal approach. In our analysis, we choose the signal approach model to construct a crisis warning model for Vietnam, because Kaminsky and Reinhart (1999) have tested it with a large sample size, including 5 developed industrialized countries and 15 developing countries during the period from 1970 to 1995. Furthermore, the signal approach model is more flexible than the neuro fuzzy method, as it can produce a forecast at any time without requiring too many past sample data and its process is less complicated. Moreover, the signal approach model has better capacity to accommodate a larger set of indicators that we use to develop an early warning system for Vietnam.
2. SIGNAL APPROACH MODEL
The signal approach model is based on the volatility of economic variables, which can have a negative impact on the economy and therefore can cause financial crises. The probability index of a financial crisis is calculated by the following formula:
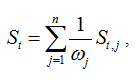
where St,j is emission signal variable number j at time t;
ωj is the noise of the forecast variable number j;
n is the number of monitored variables.
The goal here is to collect signals from the indicators. Each indicator is analyzed separately to forecast the crisis. Then each index is tracked to determine when its status leaves the normal direction and crosses the threshold. If an indicator crosses the limitation, it emits a signal, and it is calculated based on the 12-month growth of this index and the big change over the allowed threshold.
Let S denote the vector of n indices. For example, St,j denotes the value of index j at time t. Thus, the signal of index j at time t is converted as follows:
St,j = 1 (there is a crisis) if Xt,j crosses the feasible limitation.
St, j = 0 (no crisis) in the remaining cases.
Note that, for some indices, the further they are over the threshold, the more probable it is that a crisis will occur, while other indicators work in the opposite way; the more they decline, the greater the probability of a crisis.
The window signal is the period during which each index is expected to express the ability to predict a crisis. Kaminsky et al. (1998) set the window signal for a crisis at about 24 months before the crisis. The concept of window signals seems to be abstract, but it is completely consistent with other studies and plays a significant role in the research by Kaminsky et al. (1998); Kaminsky and Reinhart (1999) and Goldstein et al. (2000). The sensitivity analysis by Goldstein et al. (2000) shows similar results for an 18-month window signal and proves that a 12-month window signal would be too short. In fact, a shorter window signal is often seen in a few specific areas (Berg et al., 2005). However, a longer window signal is more useful for planners, because it helps them to adjust policies and take correcting steps to avoid the initially predicted crisis.
Table-1. Related threshold of forecast indicators
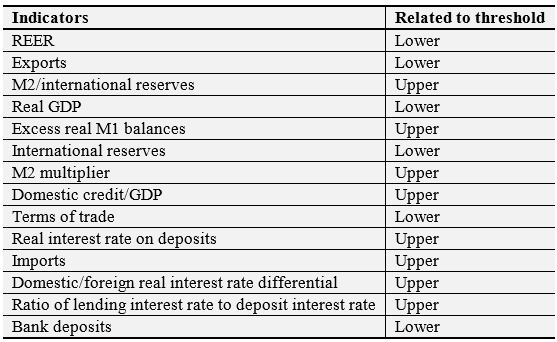
Source: Kaminsky et al. (1998)
With the signal window defined as above, we can estimate the performance of the indices. If an index emits a signal during the window, then we could say that it has emits a “positive signal.” If no crisis occurs after 24 months, it is a “wrong signal” or “noise.” The proportion of “wrong signals” over “positive signals” is called “noise” and has a very important role. We have the following matrix:
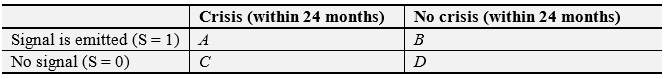
A = Number of months for which the index generates a positive signal – higher or lower than the threshold (forecasting crises and crises occur in practice)
B = Number of months for which the index generates false signals or noise (forecasting crises and no crises happen in practice)
C = Number of months for which an index cannot generate a positive signal (forecasting no crises and crises occur in practice)
D = Number of months for which the index does not emit bad signals (forecasting no crisis and no crisis occurs in practice)
An ideal indicator only generates A and D. Therefore, with this matrix we can calculate the performance of each index. The main idea developed by Goldstein et al. (2000) is the occurrence probability of an unconditional crisis: P(crisis) = (A + C) / (A + B + C + D). The probability of a conditional crisis is specified by the signal P(crisis / S) = A / (A + B).
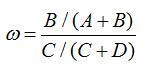
The level of noise is:
3. APPLICATION OF THE SIGNAL MODEL TO FINANCIAL CRISIS WARNING FOR VIETNAM
The previous studies have many disadvantages, because the data are aggregated from a variety of sources and many different organizations, leading to errors in the input data that affect the results of the EWS model. In this study we use databases from Thomson Reuters.
3.1.Data SelectionTable-2. . Input variables and data sources
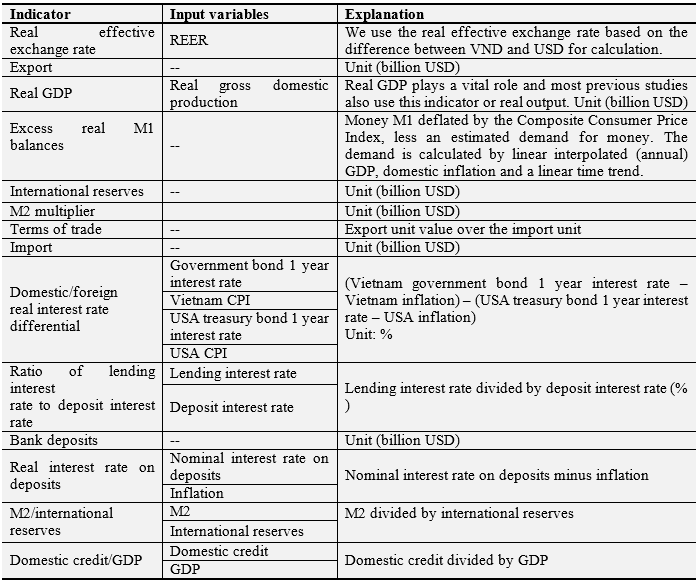
Source: Thomson Reuters
Vietnam has not yet experienced any financial crises. Thus, the implementation of the steps to calculate noise and a possible threshold (similar to countries that have experienced a crisis) to forecast a crisis for Vietnam is not possible. Therefore, in this paper we propose to use the forecasting feasibility threshold and noise, which are tested in the studies by Kaminsky and Reinhart (1999); Edison (2003) and Goldstein et al. (2000). These studies analyze many industrialized countries and developing countries from 1979 to 1995, excluded the countries in which a crisis did not occur from the sample.
Table-3. Noise of forecasting variables
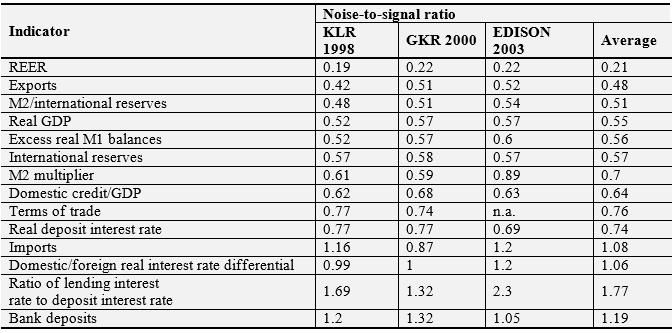
Source: Kaminsky and Reinhart (1999); Edison (2003) and Goldstein et al. (2000)
For our analysis, we use the average level of the empirical results in the studies by Kaminsky and Reinhart (1999); Edison (2003) and Goldstein et al. (2000) to develop a standard framework for forecasting a feasibility threshold. We select the 14 most relevant variables for Vietnam, as shown in Table 4.
Table-4. Feasibility threshold of forecasting variables
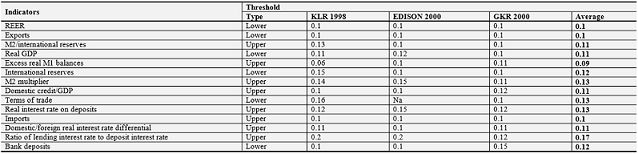
Source: Kaminsky and Reinhart (1999); Edison (2003) and Goldstein et al. (2000)
3.2. Empirical Crisis IndicatorsThe early warning indicators of a Vietnamese financial crisis are calculated based on 14 indicators with the calculated thresholds. As noted above, Vietnam has not experienced a crisis in the past; therefore, the direct calculation of each indicator in the table matrix is not feasible. Thus, the noise and weighted number of each indicator also cannot be calculated, so we will use the intermediate level of the feasibility threshold to define the noise logically. Based on the calculated crisis indicators, we derive an appropriate probability of a financial crisis occurring. To transmit the information obtained in the process of calculation, the most convenient method is to sum up the crisis indicators to determine the possibility of a crisis.

After calculating the index St, we compare it with the values in Table 5 to determine the likelihood of a crisis. This table was developed by Kaminsky and Reinhart (1999) as well as Goldstein et al. (2000) based on a relatively large sample size.
Table-5. Value of St and the conditional probability of a crisis occurring
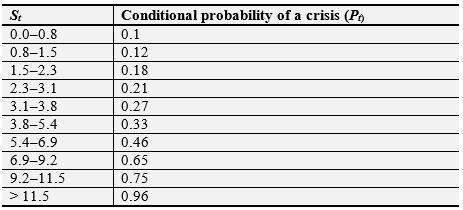
Source: Kaminsky and Reinhart (1999) and Goldstein et al. (2000)
To increase the effectiveness of the warning model, we propose the crisis alert level corresponding to the probability of a crisis. Here we propose four levels of warning:
- When the probability of a crisis is in the range of 0–0.33, the Vietnamese financial system is at the green safety warning level.
- When the probability of a crisis is in the range of 0.33–0.66, the alert level moves from green to yellow. This is a signal of growing instability in the financial system. The macroeconomic policymakers should be warned and take immediate corrective actions.
- When the probability of a crisis increases to the range of 0.66–0.8, the financial system is in danger and the probability of collapse is very high. The yellow alert now turns to orange. At this point, policymakers need strong actions and proper policies to rescue the financial system from the danger of collapse. Along with this market rescue, there are usually large deficits in the national budget and reserves.
- When the probability of a crisis is beyond 0.8, the occurrence of a crisis is almost certain. At this time, a red alert is shown. Investors’ confidence collapses and massive flows of capital withdrawal occur. In this situation, the government must use the national reserves and borrow money to save the whole system and the economy. Past crises show that most countries have huge public debts after falling into this situation.
4. EVALUATION OF THE CRISIS WARNING RESULTS AND THE “HEALTH” OF VIETNAM’S ECONOMY
The results of our calculations are shown in Table 6(see the calculations in Appendix 1 to 4). The financial crisis warning levels in Vietnam during the 17-year period from 1998 to 2014 were green 8 times, yellow 6 times and orange 3 times. The orange alert appeared in 2000, 2009 and 2010.
Table-6. Crisis alert levels for Vietnam from 1998 to 2014
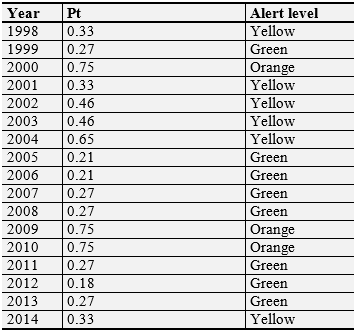
Source: Own calculations in Appendix
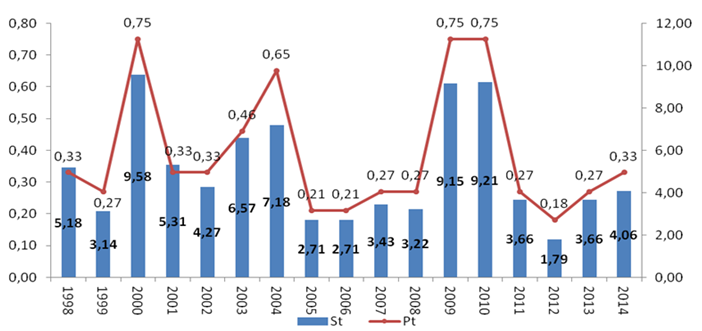
Figure-1. Indicators and Vietnam’s financial crisis warning probability from 1998 to 2014
Source: Own calculations in Appendix
4.1 Period from 1998 to 2000The result of the empirical crisis indicators during the period 1998–2000 shows that the warning level is unusually high in 2000, corresponding to a crisis occurrence probability of 0.75. This reflects the financial crisis in East Asia starting in 1997. At this time, Vietnam’s economy was not really open; therefore, the interaction was delayed and the highest crisis probability occurred in 2000. According to the actual data, in 2000 and 2001 Vietnam suffered deflation; the CPI in 2000 was -1.7% and that in 2001 was -0.3% (see Figure 2). Consequently, in 2000 the Vietnamese central bank undertook an expansive monetary policy. M1 and M2 rose sharply compared with the previous years, while the international reserves did not change much. The probability of a crisis reached the orange alert level.
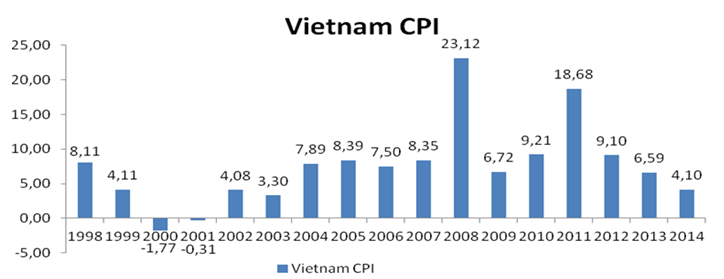
Figure-2.Vietnam’s CPI from 1998 to 2014
Source: International Monetary Fund
4.2: Period from 2001 to 2004In this period the warning indicators and crisis probability tended to increase gradually but the alert level remained stable with yellow. It can be said that the period between 2001 and 2004 was an important transitional period of the Vietnamese economy after the crisis; the average real GDP growth was over 7%, and exports, FDI and other targets consistently gained impressive achievements. This can be derived from the expansive monetary policy, the increase in the money supply, domestic credit expansion, strong growth in the FDI inflows into Vietnam and an increase in imports for production. All these factors are reasons why the probability of a crisis 24 months later was not high. After Vietnam joined the WTO, the level of interaction among macroeconomic variables became clearer. In addition, the real interest rate and real interest rate difference (VND compared with USD) decreased significantly compared with the previous period.
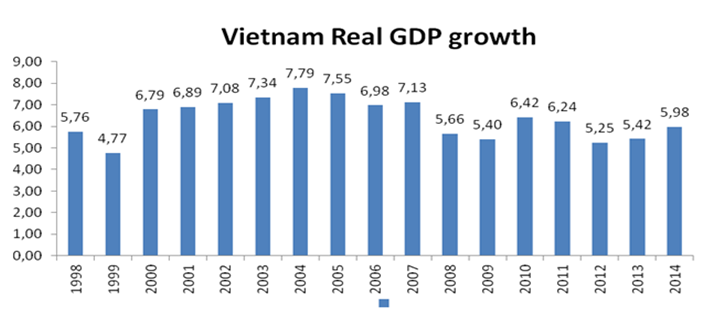
Figure-3.Vietnam real GDP growth 1998–2014
Source: International Monetary Fund
4.3: Period from 2005 to 2008In the first period from 2005 to 2007, although the growth rate of Vietnam showed signs of reduction, the important indicators remained very good. This helped the crisis warning indicators and probability to remain at a safe level. Remarkable in this period is the first month of 2008, when the price of raw materials, energy and food together with overheating investment caused soaring imports and pushed the trade deficit to a record level of 17 billion dollars.
This large deficit put pressure on the VND and caused significant VND devaluation. In this context the Government of Vietnam implemented a series of urgent measures, such as monetary tightening (the base rate at times pushed up to 14%) and constraining public investment and government spending by delaying or cancelling projects that were not pressing. These policies proved to be effective in cooling inflation in the last months of 2008. The trade deficit was reduced and the USD/VND currency exchange rate became more balanced and stable. Vietnam’s economy escaped the risk of collapse. This is why only a warning occurred and the probability of recession remained low.
During the first months of 2009, Vietnam’s economy began to confront the latent impacts of the global financial crisis stemming from the financial crisis in the USA in the last months of 2008. This crisis had strong impacts on Vietnam’s economy when the demand for global commodities declined seriously. This led to an imbalance of trade and other indicators of the Vietnamese economy, which created the risk of recession once more. Facing the impacts of the financial crisis and global recession on domestic economic growth, the Vietnamese Government implemented economic stimulus packages with a total value of VND 145,600 billion (equivalent to USD 8 billion or 8.7% of the GDP).
At the same time, Vietnam’s Government also introduced various measures such as easing monetary credit and supporting the interest rate for businesses and households. The most notable solution was the reduction in interest rates and an interest rate subsidy of 4% for loans. This measure contributed to the high credit growth of 37.7% in 2009, which was much higher than the target (30%). These decisions quickly made the warning indicators and crisis probability extraordinarily high in two consecutive years – 2009 and 2010. It can be said that this period was very different from the “open” period – the year 2000. Serious challenges arose for Vietnam’s financial system and macroeconomy. In fact, Vietnam managed to avoid a mild currency crisis. Looking at the exchange rate data, the State Bank Vietnam (SBV) decided to devalue the local currency to 10.21%, 8.07% and 10.26% in 2009, 2010 and 2011 (see Figure 4).
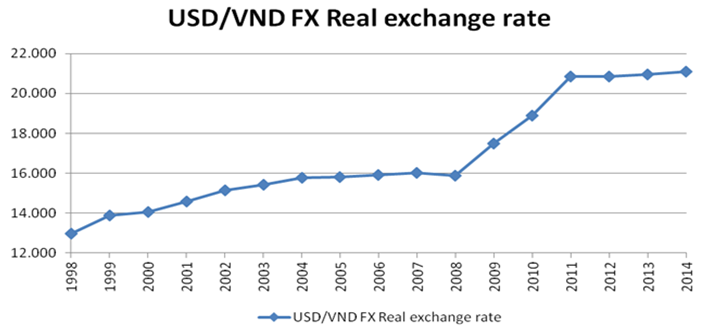
Figure-4.USD/VND real exchange rate from 1998 to 2014
Source: International Monetary Fund
One notable point is that the economic stimulus measures in the period 2009–2010 were not accompanied by significant macroeconomic improvement. Although a huge amount of money was pumped into the economy, the production sector received only a meager part of this increase, and the money flowed into the stock market and real estate instead. The explosive rise of the stock market and real estate led Vietnam to confront an asset bubble. When the asset bubble burst, foreign capital was sharply withdrawn from Vietnam. In this period the banking system was in danger of collapse due to the increase in the bad debt ratio and the significant decline in the national foreign exchange reserve (see Figure 5). Businesses ceased production in the context of inflation, and the high costs of loans led to a record number of more than 77,000 bankrupt businesses in 2011. Consequently, Vietnam’s real GDP growth rate decreased to 5.2% in 2012, which was its lowest level since 1999.
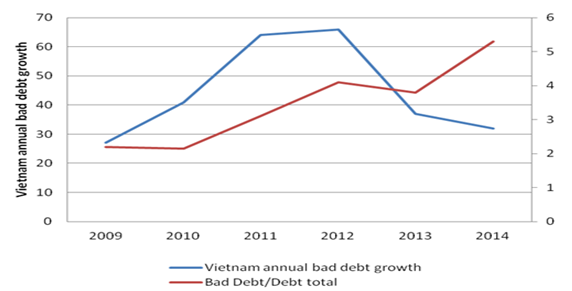
Figure-5. Bad debt and Vietnam’s annual bad debt growth 2009–2014 (%)
Source: State Bank of Vietnam
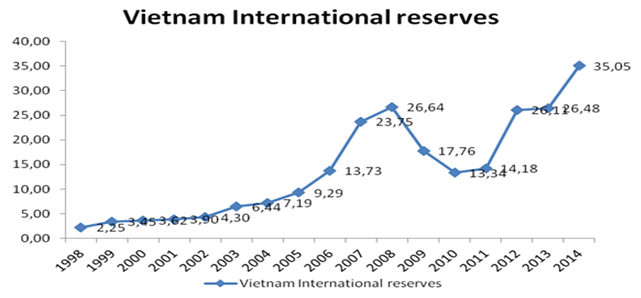
Figure-6. Vietnam’s international reserves
Source: Data Stream – Thomson Reuters
4.5: Period from 2012 to 2015This period was a stable stage and Vietnam regained its economic growth momentum. The crisis indicators point out that, after 2012, the economy started showing more stable signs, except for the lagged impacts on Vietnam’s banking system. At that time, thanks to the persistent pursuit of the priority objective of controlling inflation and the application of synchronous measures, the annual average consumer price index declined from 18.13% in 2011 to 9.21% in 2012 and to 6.04% in 2013. The interest rate reduced from 17%–18% per year to 7%–10% per year, and the lending interest rate reduced to 9%–12% per year and is currently about 9%–11.5% (even 7%–9% for some priority areas).
The budget deficit, government debt, public debt and foreign debt of the country were still under the control of Vietnam’s Government. Foreign direct investment (FDI) showed an increasing trend; in 2011 the registered capital was USD 15.6 billion and the implemented capital was USD 11 billion; the corresponding figures were USD 16.3 billion and USD 10.1 billion for 2012; USD 21.6 billion and USD 11.5 billion for 2013; and USD 22 billion and USD 12.5 billion for 2014.
Table-3.1. Vietnam was stable and regained growth momentum
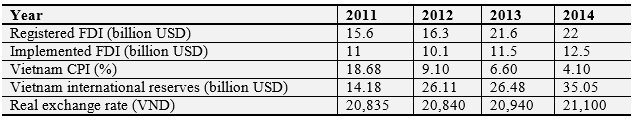
Source: IMF and Vietnam Ministry of Planning and Investment
5. RECOMMENDATION FOR THE CRISIS PREVENTION POLICY
Based on the academic studies on the financial crisis and our results of applying the financial crisis warning model, Vietnam needs to develop appropriate policy measures in order to avoid financial crisis in the future.
5.1: Recommendation for Monetary Policy – Prevention of a Currency CrisisIn the period from 2015 to 2020, the objective of the monetary policy is to ensure macroeconomic stability, control inflation, promote economic growth and stimulate investment and development. Therefore, the requirement is that the policymakers have to use regulatory tools flexibly and effectively.
5.1.1: Flexible Exchange Rate Policy and Leading the MarketFormerly, the exchange rates fluctuated constantly, and the trend of shifting from keeping the VND to keeping the USD created pressure to increase the foreign currency demand. Thus, the central bank had to sell foreign currency to intervene in the market, and this action led to low levels of international reserves. Since late 2011 the central bank has made practical policies to control the exchange rate and create confidence in the VND, to reduce the dollarization situation in the economy and to improve the international reserves. This is one of the key points in avoiding the occurrence of a financial crisis. To achieve a high level of efficiency of the exchange rate policies, the central bank should:
- Maintain the central exchange rate flexibility or align the interbank average exchange rate with the daily market movements. The USD buying rate of the SBV (State Bank of Vietnam) should be managed in such a way as to encourage credit institutions to sell foreign currency for the SBV to increase the international reserves. The selling rate should also be adjusted flexibly to stabilize and create confidence in the market.
- Follow up the market movements closely and implement the necessary measures when there is movement in the market, strengthen management and inspection activities and take action with any violations in buying/selling foreign currency businesses.
- The SBV should understand the current barriers to the development of the derivative market in Vietnam, strive to develop this market to serve the risk management operations in particular and to contribute to completing the Vietnamese financial market in general.
- Maintain the improvement of the statistics and forecast activities of the monthly cash flow and use market intervention in the case of a temporary imbalance in the supply and demand of foreign currency. In terms of foreign direct and indirect investors’ transactions, more open foreign exchange control is required to improve the investment environment in Vietnam.
In the market economy, the interest rate plays an important role, being a lever to stimulate economic growth, contributing to the objectives of the national monetary policy, being a tool to promote competition among commercial banks, being a tool to adjust the investment activities in the economy and being a tool to curb inflation very effectively through the SBV’s monetary policy. From 2012 until now, the SBV has operated based on price combined with volume, but price operating is preferred. At the same time, the SBV needs to take care of monetary indicators, such as M1, M2 and credit growth, because they are still important in evaluating the impacts of monetary policy management and economic growth. In addition, this is the factor that has huge impacts on the crisis early warning system of Vietnam.
5.1.2: Continue to Manage the Interest Rate According to Price and VolumeThe objectives of monetary policy should be clarified in each period. There should be an agreement on the policy objectives, policy measures and priority of goals in each period, because trade-offs among these objectives are necessary. For example, regarding inflation and economic growth, to control inflation, the interest rate should increase; however, this action will affect the economic growth negatively. To support the exchange rate stability, the SBV has to raise the interbank interest rates to restrict foreign currency speculation, but if this action takes too long, it can increase the lending interest rates, affecting the performance of the credit growth target. Thus, in each period the SBV should clearly identify the top target, the ultimate goal, the intermediate targets and the operational objectives of the monetary policy. The SBV also needs to quantify clearly the objectives to maintain consistent operation.
5.2: Manage the Banking System – Limit Risk and Create a Healthy SystemThe stability and soundness of the banking system play an increasingly important role. In Vietnam in recent years, the instability of the macroeconomic indicators has caused risk and damaged the banking system in many aspects. The banking system is the “victim” of the economic uncertainty, and in turn it is the “culprit” exerting an impact on this volatility.
From now until 2020, the global financial sector is likely to be governed better by the new legal framework. The reform and operation trend of the world’s banking system in 2015 and the next five years is: (i) acquisitions and mergers will happen strongly; (ii) strong development will take place in retail banking services and modern banking services; and (iii) supervision and risk management in banking activities will be strengthened. In this context, accelerating the process of restructuring commercial banks in Vietnam, completing the legal framework, solving bad debts and cross-ownership to stabilize the system, enhancing competitive capabilities and so on are currently important measures. Specifically:
- Firstly, continue to improve policy mechanisms and laws according to international standards of loan classification and risk provision; undertake loan limitations, investment and payment and the valuation of non-credit assets; review the actual capital of commercial banks to monitor the minimum ratio of capital safety; and implement risk management according to Basel III. The new regulation rules 36/2014/TT-NHNN, effective from February 1, 2015, which brought out new, stricter standards, gradually limiting the domination, manipulation and group interests through cross-ownership and helping banks to operate more safely, should be implemented properly and thoroughly. This is a very important platform to ensure that Vietnam’s economy and banking system develop stably and integrate effectively.
- Secondly, accelerate the process of restructuring the banking system along with solving cross-ownership. The central bank should monitor weak commercial banks with specific roadmaps to achieve the following criteria after restructuring: capital, management level, information technology, level of capital safety and transparency. With the state joint stock commercial banks, the proportion of the state capital should gradually be reduced to a reasonable level based on a proper roadmap. The state should only hold between 51% and 65% depending on the size of each bank.
- To create healthy banking operations, the problem of bad debt should be solved. The activities of the VAMC (Vietnam Asset Management Company of credit institutions) are the right solutions to the situation; the important point is to remove the mechanism of the sale of bad debt quickly, which is now assigned to the VAMC to have real power in its role as the creditor while buying bad debt from commercial banks. The SBV should strengthen the supervision of commercial banks in loan classification, deduction and use of risk provision for bad debts, profit distribution and so on.
- Thirdly, sustainable development in a competitive and risky environment requires banks to be particularly customer-oriented, considering customers as their center. Attracting and retaining customers are among the most important tasks of any bank. After determining their “customer-centrism”, banks need to sort out their business models and set up and operate their analytical tools on modern customers.
- In the short and medium term, credit is still the principal activity of commercial banks. The economy is in the early stages of development, and a large amount of capital is needed; while the capital market is not yet developed, the credit activities should direct the credit flows to production, agricultural development, exports, supporting industries, manufacturing–processing, small and medium enterprises and dynamic economic regions and limit the risky business fields. This action would contribute to the improvement of economic growth quality.
- The banking system needs to focus on improving the quality of traditional services and develop modern banking services rapidly on the basis of promoting technological modernization associated with risk management activities. Besides, it is necessary to develop a data collection system to ensure that the information provided is reliable.
- In banking operations not all information can be published, but more transparent, updated and accurate information will reinforce the confidence of customers. Only a good and transparent information system with highly qualified personnel will help to improve banks’ reputation and develop trust between businesses.
A prudent and consolidated debt management and payment capability is an important factor to contribute to the reduction of risks related to capital flows across borders. The decision on government expenditure can affect the expenditure decisions of the private sector and the systemic risks that the whole economy has to confront. Prudent risk management of the public sector and payment capability are not limited to foreign exchange and foreign debt. A monetary crisis in the country may also occur. To have prudent strategic asset and debt management and risk control of payment capability, the SBV and Ministry of Finance should:
- Develop information systems to analyze, forecast and evaluate the safety of government loans.
- Extend concessional credit channels, including non-refundable aid.
- Complete the loans and foreign loans mechanism policy on the basis of participating to improve the quality of planning, financial evaluation and the assessment of investment projects using foreign capital.
- Control and monitor closely the investment funds of state corporations borrowing foreign debt to avoid default risk and the loss of state funds.
The financial risks of big state corporations stem from funding risks when they are funded with loans that are too large, which always make their debt-to-equity ratio high. The lessons from the bankruptcy of the Vietnamese firms Vinashin and Vinaline has showed the substantial consequences that the Vietnamese economy had to suffer. Along with that, there is a need for clear loan provision for state–corporation debt. We need to create clear rules for corporate debt and state–company debt to undertake appropriate action.
| Funding: This study received no specific financial support. |
| Competing Interests: The authors declare that they have no competing interests. |
| Contributors/Acknowledgement: All authors contributed equally to the conception and design of the study. |
REFERENCES
Abiad, A., 2003. Early warning systems: A survey and a regime-switching approach. IMF Working Paper No. 03/ 32.
Adrian, T. and H. Shin, 2009. Liquidity and leverage. Journal of Financial Intermediation, 19(3): 418-437.
Babecký, J., T. Havranek, J. Mateju, M. Rusnák, K. Šmídková and B. Vašícek, 2012. Banking, debt and currency crises: Early warning indicators for developed countries. ECB Working Paper No. 1485.
Berg, A., E. Borenzsztein and C. Pattillo, 2005. Assessing early warning systems: How have they worked in practice? IMF Staff Papers No. 04/52.
Berg, A. and C. Pattillo, 1999. Predicting currency crises: The indicators approach and an al-ternative. Journal of International Money and Finance, 18(4): 561-586. View at Google Scholar | View at Publisher
Bussiere, M. and M. Fratzscher, 2006. Towards a new early warning system of financial crises. Journal of International Money and Finance, 25(6): 953-973. View at Google Scholar | View at Publisher
Cesmeci, O. and A. Onder, 2008. Determinants of currency crises in emerging markets: The case of Turkey. Emerging Markets Finance and Trade, 44(5): 54-67. View at Google Scholar | View at Publisher
Demirguc-Kunt, A. and E. Detragiache, 2000. Monitoring banking sector fragility: A multivar-iate logit approach. World Bank Economic Review, 14(2): 287-307. View at Google Scholar | View at Publisher
Edison, H.J., 2003. Do indicators of financial crises work? An evaluation of an early warning system. International Journal of Finance and Economics, 8(1): 11-53. View at Publisher
El-Shagi, M., T. Knedlik and S.G. Von, 2013. Predicting financial crises: The (Statistical) significance of the signals approach. Journal of International Money and Finance, 35: 76-103. View at Google Scholar | View at Publisher
Frankel, J. and G. Saravelos, 2010. Are leading indicators of financial crises useful for as-sessing country vulnerability? Evidence from the 2008-09 global crisis. NBER Working Paper No. 17318.
Fratzscher, M., 2003. On currency crises and contagion. International Journal of Finance and Economics, 8(2): 109-129. View at Google Scholar | View at Publisher
Frost, J. and A. Saiki, 2014. Early warning for currency crises: What is the role of financial openness? Review of International Economics, 22(4): 722-743. View at Google Scholar | View at Publisher
Goldstein, M., G.L. Kaminsky and C.M. Reinhart, 2000. Assessing financial vulnerability: An early warning system for emerging markets. MPRA Paper No. 13629.
Kaminsky, G.L., S. Lizondo and C.M. Reinhart, 1998. Leading indicators of currency crises. IMF Staff Papers No. 01/45.
Kaminsky, G.L. and C.M. Reinhart, 1999. The twin crises: The causes of banking and balance-of-payments problems. American Economic Review, 89(3): 473-500.View at Google Scholar | View at Publisher
Martinez-Peria, M., 2002. A regime-switching approach to the study of speculative attacks: A focus on EMS crises. Empirical Economics, 27(2): 299-334. View at Publisher
Megersa, K. and D. Cassimon, 2015. Assessing indicators of currency crisis in Ethiopia: Signals approach. African Development Review, 27(3): 315–330. View at Google Scholar | View at Publisher
Obstfeld, M., J. Shambaugh and A. Taylor, 2009. Financial instability, reserves, and central bank swap lines in the panic of 2008. American Economic Review, 99(2): 480-486. View at Publisher
Reinhart, C. and K. Rogoff, 2008. This time is different: A panoramic view of eight centuries of financial crises. NBER Working Paper No. 13882.
Reinhart, C. and K. Rogoff, 2009. The aftermath of financial crises. American Economic Review, 99(2): 466-472. View at Publisher