


TICK SIZE AND COMMONALITY IN LIQUIDITY

1,2Ling Tung University of Science and Technology, Taiwan
3Chihlee University of Technology, Taiwan
ABSTRACT
This study suggests that the change of tick size, particularly in a step-function tick system, accounts for cross-sectional variation in market liquidity. We explored the relative significance of commonality in liquidity in a limit order book during the period of tick-size conversion, and empirically examined the interactions of inventory risk and asymmetric information on liquidity co-movements. We observed that market-wide and within-industry commonality in liquidity is ubiquitous before and after tick-size conversion. Moreover, the small spreads and thin limit order book introduced by the narrowed minimum price variation further strengthened liquidity co-movements. We also observed that trade size and trading frequency exhibited significantly negative influences on spread measures before and after tick-size conversion, whereas significantly positive effects persisted for depth constructs. Finally, we documented affluent industry-wide liquidity co-movements before and after tick-size conversion, after accounting for marginal influences of potent idiosyncratic liquidity determinants including volatility, market price, and trade volume. Our empirical evidence reveals that a narrow tick size might generate considerable market-wide liquidity risk and produce adverse effects on market quality.
© 2017 AESS Publications. All Rights Reserved.
Keywords: Tick size, Liquidity commonality, Limit order book dynamics, Inventory risk, Asymmetric information, Co-movement.
JEL Classification: G14, G23.
Received: 5 December 2016/ Revised: 4 January 2017/ / Accepted: 13 January 2017/ Published: 21 January 2017
Contribution/ Originality:
This study is one of very few studies which have investigated commonality in liquidity by examining the institutional influences of the common tick-size system as a systemic determinant of co-movements.
1. INTRODUCTION
The liquidity of financial assets changes over time, and the involved time variations are governed by significant common components among assets. However, previous studies have directly targeted sourcing common determinants of liquidity co-variation rather than largely idiosyncratic firm-specific events only visible in recent periods. Among them, Hubberman and Halka (1999) first discovered liquidity co-movements by recognizing that estimated model residuals are correlated among portfolios. Chordia et al. (2000) documented that ubiquitous liquidity commonality prevails in markets, and liquidity correlations remained strong after accommodating for the effect of primary idiosyncratic liquidity determinants. They demonstrated plausible channels of broad market-wide commonality through the interaction of inventory risk and asymmetric information. Using data from 30 Dow stocks, Hasbrouck and Seppi (2001) observed that common factors characterized both returns and order flows. Specifically, commonality in the order flows explains two-thirds of the commonality in returns and liquidity proxies, and bid-ask quote sizes help explain time variations in trade effects. Whether and to what extent liquidity exerts any crucial bearing on asset pricing have drawn considerable attention. Pastor and Stambaugh (2003) investigated whether market-wide liquidity is an essential state variable for asset pricing and observed that expected stock returns are cross-sectional related to return sensitivities to fluctuations in aggregate liquidity. Acharya and Pedersen (2005) derived that a liquidity-adjusted capital asset pricing model (CAPM) provides a unified framework for clarifying the various channels through which liquidity risk affects asset prices.
In a long-term investigation, Kamara et al. (2008;2010) have documented the time-variation of liquidity in U.S. markets and observed that the divergence of liquidity commonality in the cross-section of stocks increased during the 1963–2008 period. The authors have further indicated that the ability to diversify systematic risk and aggregate liquidity shocks by holding large-cap stocks has declined. This observation helps to explain the increased fragility of the U.S. equity market to unanticipated events over the past few decades. Moreover, Brockman et al. (2009) presented comprehensive international evidence of liquidity commonality.
We extended the line of research on commonality in liquidity by examining the institutional influences of the common tick-size system as a systemic determinant of co-movements. The market microstructure literature indicates that tick size exerts tremendous effects on the entire trading environment, which is readily observed in the dynamics of limit order books. Among the most conspicuous changes, relaxing the binding constraints on efficient pricing intensifies competition among liquidity provisions; the narrow minimum price variation imposes a considerable risk of order exposure from both front running and order matching and can discourage information gartering. Diminishing both spreads and depth generates distinct consequences for institutional and retail trading, and amplifying market flickers provides a comparative trading edge for fast traders over slow ones.
We further postulated that changes in the tick-size system alter the relative importance of inventory risk and asymmetric information confronted by market players of entire trading platforms, and constitute the key commonality underplaying broad market trading activity. Bacidore (1997) reported that the shift of the Toronto Stock Exchange to decimal pricing adversely affected most liquidity providers because the trading volume did not increase sufficiently to compensate the decrease of per-share quoted and effective spreads. Harris (1999) argued that diminished tick size lowers front-running costs and creates an execution obstacle for institutional investors in mandatory large transactions. Goldstein and Kavajecz (2000) and Jones and Lipson (2001) have demonstrated that decimalization causes net losses for large order transactions and increases realized execution costs for institutional traders. We recognized that trading activity initiated from institutional investing and indexation is the primary cause of commonality in liquidity, and that market-wide inventory risk amplifies the co-movements of inventory fluctuation after diminishing the minimum price variation. By contrast, Gibson et al. (2003) suggested that the influence of a decimal pricing regime on asymmetric information remains an empirical problem. Higher market spreads automatically impose higher fixed costs on informed traders and increase the probability of the spread straddling efficient prices. However, high market spreads can deter front-running and order-jumping behaviors and protect information trading value. Certain studies (Gibson et al., 2003; Kuo et al., 2013) have documented no significant distinction in the adverse selection component before and after tick-size narrowing. In summary, the market microstructure literature indicates that a lower minimum price variation likely causes greater commonality in liquidity. Therefore, this study empirically investigated this relationship, which has previously lacked empirical inquiry.
2. DATA AND SAMPLE SELECTION
The minimum price variation in the Taiwan Stock Exchange (TWSE) is characterized by a series of price categories, as shown in Table 1, which also includes changes to the tick-size rules on March 1, 2005. Prior to the tick-size changes, the minimum relative tick size among the nine price categories varied from the lowest 0.1% to the highest 0.5%, a five-fold difference.
Table-1.Absolute and relative tick size on the TWSE following the tick size reduction
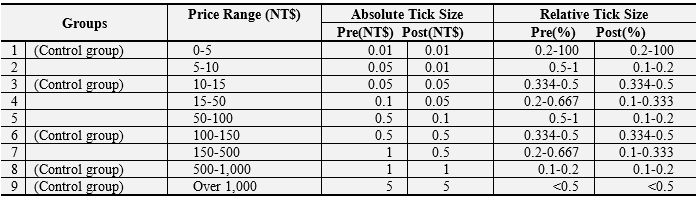
Note: The table lists absolute tick sizes and relative tick size for the nine price categories before and after the reduction of the minimum tick size on the TWSE on 1 March 2005, the date on which the new tick size rule became effective.
The TWSE applied new tick sizes to four of the nine price categories, reducing the tick sizes of Group 2 (NT$5–10) by 80% (from NT$0.05 to NT$0.01); Group 4 (NT$15–50) by 50% (from NT$0.1 to NT$0.05); Group 5 (NT$50–100) by 80% (from NT$0.5 to NT$0.1), and Group 7 (NT$150–500) by 50% (from NT$1 to NT$0.5). Thus, the minimum relative tick size among the nine price categories on the TWSE was smoothed from the lowest 0.1% to the highest 0.334%. Taiwan is one of the most successful developing economies among emerging markets. The TWSE possesses several distinct market features that generate divergent tick-size changes from those reported in developed markets, such as the NYSE and the Tokyo Stock Exchange: (i) The TWSE is a pure, order-driven call market without designated market makers, and all limit orders are submitted from public traders, whereas market orders are suspended from price determination. Uniform pricing in each call section determines the transaction price, which attains the greatest trading volume for the market. The TWSE trading mechanism involves using only the call auction for intraday trading and for market openings and closings, which is unique among Asia-Pacific stock exchanges, as Comerton-Forde and Rydge (2006) suggested. (ii) The TWSE is vulnerable to political risk arising from sovereignty disputes across the Taiwan Strait. Regulators have adopted strict measures for market stability, including daily 7% price limits, short-selling restrictions, and margining systems for stock transactions. (iii) The security transaction cost of the TWSE is the lowest among its counterpart exchanges in the Asia-Pacific region, which may partially explain the persistent high level of turnover rates observed in the TWSE, as indicated in Rhee and Chang (1992). (iv) Retail transactions constitute major parts of market volume. Prior to 1998, the proportion of retail investors persistently exceeded the 90% level and, even after regulators strove to draw more institutional investors to the market by opening it to foreign investors, domestic retail investors accounted for 70% of the trading activity in 2011. Crouhy and Galai (1992) suggested that the market microstructure can have crucial effects on stock return behavior, thus exhibiting different implications regarding the effect of tick-size changes. This justifies the call for more international evidence on the effects of tick-size changes on liquidity co-movements.
2.1. Sample SelectionWe analyzed the tick-by-tick transactions and quote data from the TWSE to examine the effects of tick-size changes on liquidity commonality, and obtained detailed intraday data from the Taiwan Economic Journal (TEJ). On March 1, 2005, the TWSE reduced the minimum tick size for all listed stocks within certain price ranges. Our empirical examination of the resultant changes covered the 6-month periods before and after the effective date; however, we excluded the five trading days immediately before and after the event date to avoid any potential bias resulting from the influence of the tick-size change on either market expectations or trading behavior.
Our sample period included 697 listed companies on the TWSE, and our study sample comprised 115 trading days in the preevent period (September 1, 2004 to February 18, 2005) and 123 trading days in the postevent period (March 8, 2005 to August 31, 2005). We also adopted a half-year sample period, spanning the 3-month periods before and after the effective date to provide supporting evidence for the results drawn from the main empirical sample.
To minimize contaminating the effectiveness of the changes in minimum tick size, we used specific sample selection criteria, by excluding firms if (i) their IPO date was less than 3 months prior to the examined period; (ii) they had an average daily trading volume of less than 5% of the average of the total sample; or (iii) their highest or lowest prices were within two or more price ranges during the sample period. Furthermore, the normal trading session on the TWSE runs from 9:00 a.m. to 1:30 p.m.; thus, to filter out “noise” attributable to errant trading during market opening and closing, we excluded transaction data from the 5-min periods after market opening and prior to market closing.
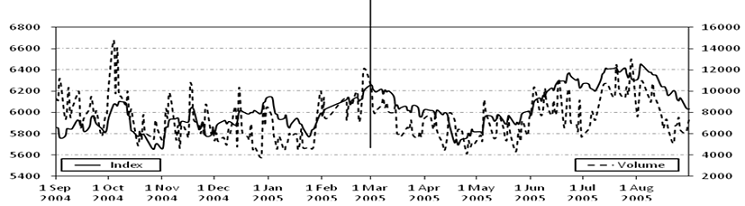
Figure-1. Daily TAIEX index and total trading volume on the TWSE
Note: The figure plots the daily TAIEX index and total volume on the TWSE (in NT$10 million) over the one year period from 1 September 2004 to 31 August 2005. The vertical line, centered on 1 March 2005, indicates the date on which the TWSE implemented the new tick-size rule
Figure 1 illustrates that the TAIEX and daily trading volume were relatively stable during the study period, and no material changes occurred immediately before or after the event date. This evidence suggests that the minimum tick-size changes constituted the major market effect on the TWSE during the examined period. Table 2 reports the basic statistics for two empirical samples. First, the changes in the minimum tick size are not uniformly applied to all price ranges; among the nine price categories, the mandatory reduced tick size on March 1, 2005 affected only Groups 2, 4, 5, and 7. Furthermore, there are relatively few companies in the price categories with price ranges exceeding NT$100. We therefore focused on the evidence drawn from our test groups (Groups 2, 4, and 5) of 179 firms, representing the listed stocks with changes in tick size, and from the contrasting groups (Groups 1 and 3) of 22 firms, representing those stocks with no changes in tick size. Table 2 strongly indicates that among test groups, execution costs, quoted depth, order-processing costs, share volume, and trade size significantly decreased after reducing tick size. By contrast, the control group exhibited little change on all variables in magnitude and significance, before and after the tick-size conversion. In summary, our sample statistics reveal crucial changes of liquidity attributes caused by reduced tick size.
Table-2.Basic statistics: Pre- and post- tick size reduction periodsa
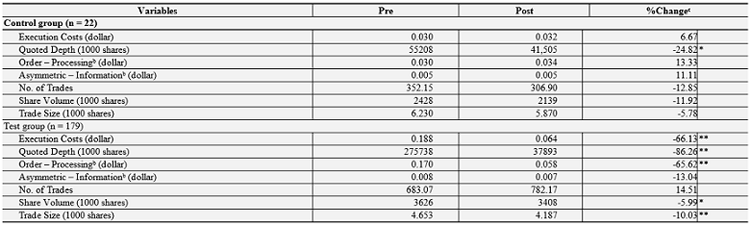
Notes: a Each of the variables is calculated for the six-month periods before and after 1 March 2005, the date on which the new tick size rule became effective on the TWSE, along with %Change between the pre- and post- periods. b The order–processing and asymmetric-information components (measured in NT$) are estimated using the Huang and Stoll (1997) model. c * and ** respectively indicate 5% and 1% significance level based on the t-test.
2.2. Market Liquidity MeasuresWe employed four liquidity measures in the current study, comprising quoted spread, execution costs, best-quoted depth, and accumulated market depth, for investigating the effects of tick-size conversion on liquidity commonality. The quoted spread was defined according to the differences between the lowest ask and the highest bid among the prevailing quotes within the market. Specifically,
Quoted Spread = Ai,t – Bi,t , (1)
where Ai,t and Bi,t respectively refer to the lowest ask and highest bid of the ith stock at tick time t.
This quoted spread measure has traditionally been used to ascertain the transaction cost loading on impatient traders; however, it demonstrates the potential for introducing bias in the actual transaction costs when either large market orders or block trades have greater market effects, or when asset value uncertainty generates uncommon quotes. The effective spread refines the actual execution costs and is used to measure the difference between the transaction price and the quoted midpoint; thus, we defined execution costs as follows:
Execution Costs = 2Di,t (Pi,t– Mi,t ), (2)
where Pi,t is the transaction price of the ith stock at time t; Mi,t is the quoted midpoint of the ith stock at time t; and Di,t is the trade indicator at time t, which is equal to 1 if the trade is buyer initiated, and equal to – 1 if the trade is seller initiated. The initiation of trading is computed based on Lee and Ready (1991).
3.RESEARCH DESIGN
We examined the effect of tick-size change on commonality in liquidity by first inspecting cross-sectional co-movements of liquidity with market-wide and industry-wide liquidity before and after tick-size conversion. We subsequently probed the common causes of liquidity via the channels of inventory risk and asymmetric information, and finally determined the robustness of common influence on cross-sectional variation in liquidity after controlling for well-known individual liquidity factors including volatility, trading volume, and price level.
3.1. Market and Industry Commonality in Liquidity Before and after Tick-Size Reduction3.1.1. Market-Wide Commonality in Liquidity
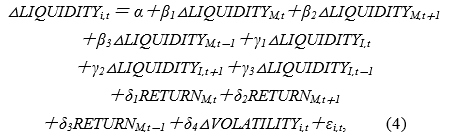
We employed the factor model by Chordia et al. (2000) and Lo and Wang (2000) to gauge commonality in liquidity empirically before and after tick-size change in the TWSE. Our empirical model is expressed as follows:
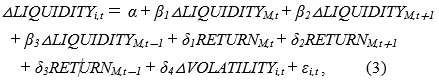
where △LIQUIDITYi,t denotes a proportional change in the liquidity of firm i at time t, where liquidity was measured according to quoted spread, execution costs, best depth, and market depth; △LIQUIDITYM,t denotes a proportional change in equally weighted market liquidity at time t, likewise for times at t + 1, and t – 1, and the calculation of market liquidity, including all but firm i to avoid the unnecessary cross-sectional restriction on the time-series estimated coefficients. Two control variables, RETURNM,t denotes market return at time t, likewise for times at t + 1, and t – 1; △VOLATILITYi,t denotes a proportional change of volatility of firm i at time t, in which the volatility is calculated as the average of intraday squared returns on day t.
3.1.2. Market-Wide and Industry-Wide Commonality in LiquidityIn addition to market commonality, we examined the common influences in liquidity within the industry scope by considering that trading activity can be a more within- than cross-industry commonality, and certain asymmetric information shocks are more likely industry-innovation related than market-wide driven. Our empirical model is expressed as follows:
where △LIQUIDITYI,t denotes a proportional change of liquidity of industry I at time t, likewise for times at t + 1 and t – 1. Each firm i is classified into one of three industry categories: electronics, finance and insurance, and other. Currently, 32 industry groups are listed in the TWSE, and electronics firms and finance and insurance firms are the most influential and distinctive types; otherwise, firms are assigned as other. Our simplified classification was necessary for sufficient empirical observations in our test and control groups. We calculated industry liquidity in the same manner as market liquidity, and defined other variables as we did previously.
3.2. Common Determinants of Liquidity, Inventory Risk, and Asymmetric InformationAfter obtaining sufficient evidence of market-wide liquidity commonality, the natural inquiry step involved determining how inventory risk and asymmetric information account for cross-sectional variations in market liquidity. Generally, market trading activity responds inter-temporally to market price fluctuation, and the accompanying trading volume concerns dealers who manage optimal inventory levels. Program trading and institutional funds can synchronically exhibit similar investing patterns and generate correlated inventory fluctuations with liquidity co-movements. An industry-oriented technology revolution acts as asymmetric information, which can potentially trigger systemic liquidity movements. Broad market activity presumably exerts greater influence on inventory risk, whereas individual trading activity is more likely associated with asymmetric information. Industry-wide influences might represent an intermediate position, being possibly influenced by both effects. Following the line of research by Jones et al. (1994) and Chordia et al. (2000) among others, our empirical justification adopted the number of trades as the proxy of asymmetric information, and market-wide and industry-wide trading volume as inventory risk. We subsequently examined the relationship among commonality, inventory risk, and asymmetric information as follows:
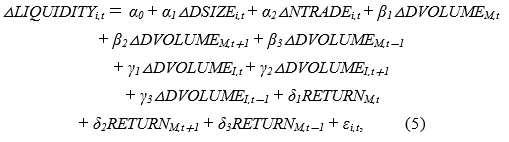
where △DSIZEi,t denotes the proportional change of the dollar trading size of firm i on day t; △NTRADEi,t denotes the proportional change of number of trades of firm i on day t; △DVOLUMEM,t and △DVOLUMEI,t respectively denote the proportional change of dollar trading volume of market and industry I on day t, likewise for times on days t + 1, t – 1; the calculation of △DVOLUMEM,t and △DVOLUMEI,t excludes the subject firm i. We defined other variables as we did previously
3.3. Commonality versus Individual Determinants of LiquidityWe finally conducted a cross-sectional regression analysis on liquidity commonality after controlling for idiosyncratic firm-specific determinants of liquidity including trading volume, volatility, and price level. We employed the Fama and MacBeth (1973) two-stage scheme for the following empirical specification:
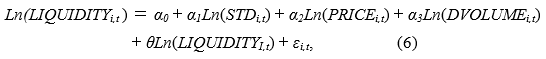
where STDi,t denotes the standard deviation of individual daily returns from the preceding calendar month; PRICEi,t denotes the concurrent day’s mean price level; and DVOLUMEi,t denotes the dollar trading volume on day t. We defined other variables as we did previously.
4. EMPIRICAL RESULTS AND DISCUSSION
We empirically investigated how tick size changes influence the general market quality in limit order books in the TWSE by specifically examining whether systematic liquidity risk can be altered by the changes of limit order dynamics caused by converting the minimum price variation. The microstructure literature indicates a general consensus that a shift in the tick-size pricing regime alters the relative importance of inventory risk and asymmetric information on the entire trading platform. We further investigated how the altered trading environment affects market-wide commonality in liquidity. Initially, the empirical examination involved comparing the existence and extent of liquidity commonality before and after diminishing the minimum price increment. We subsequently determined the sources of liquidity co-movements according to the relatively changed influences of inventory risk and asymmetric information caused by decreased tick size. We concluded by conducting a detailed cross-sectional examination on the robustness of industry-wide commonality after accounting for the relative effect of individual liquidity determinants.
4.1.Comparing Commonality in Liquidity Before and after Tick Size ChangeWe first investigated the broad market-wide and industry-wide commonality in liquidity both prior to and after the tick size conversion of the TWSE. Consistent with the findings of Chordia et al. (2000); Brockman et al. (2009); and Kamara et al. (2008) Table 3 demonstrates general market-wide commonality in liquidity in two spread measures and two depth measures, for both the test and control groups, before and after the tick size conversion. The cross-sectional liquidity β of the quoted spread exhibits positive liquidity co-movements both before and after the tick size conversion among the test control groups, thus confirming our primary assumption that the liquidity co-movement in the test groups significantly increased by 0.512, from 0.534 to 1.047, before and after the systematic reduction of the trading tick size. By contrast, the control group displayed a decline of liquidity β by – 0.142, from 0.909 to 0.767. The cross-sectional t-statistic for the average β was calculated by assuming that the estimation error of β is mutually uncorrelated among firms. The decreasing minimum price increment of the test group imposed a stringent obstacle to maintaining an optimal market-wide inventory, particularly for large institutional traders, and, in turn, frames inventory fluctuation and liquidity co-movements that are more correlated. This empirical phenomenon is further strengthened by the detailed statistics: the proportion of firms with positive β, the proportion of firms with 5% significant β, and the sum of concurrent, lag, and lead β. Specifically, the test group showed increases of 10.67% and 15.73%, respectively, on positive and significantly positive proportions during the decreasing tick-size regime. The cross-sectional mean contemporaneous, lag, and lead liquidity β also increased by 0.322, from 0.551 to 0.873, before and after tick-size conversion. By contrast, the sum of the control group decreased by – 0.11, from 0.948 to 0.837. In addition, the median sum statistics supports that positive co-movements are ubiquitous in test groups, and having again ascended from 0.33 to 0.782 by 0.452. Finally, our test group displayed higher explanatory power according to the cross-sectional mean adjusted R2 after the tick-size conversion. Interpreting the conclusion drawn from the control group may be worthy of cautioning because of the relatively small size, only 22 firms. Our empirical results on execution costs largely resemble those of the quoted spread. The test group exhibited relatively high cross-sectional mean liquidity β during the post period by 0.441, as did the proportions of positive liquidity β and significant liquidity β, by 8.39% and 21.01%. The cross-sectional mean and medium of the sum of contemporaneous, lag, and lead liquidity β also increased respectively by 0.319 and 0.406 after the tick-size reduction. The control group result is less regular, although it exhibits reverse directions in general. Although the evidence of positive liquidity co-movement remains robust in the measures of best quoted depth and market depth, the effect of diminished tick size has been alleviated in relative magnitude, particularly for market depth. Under the narrowing minimum price incremental regime, a small spread can cause liquidity providers to decrease the liquidity supply schedule, whereas encouraging front running and quote matching creates a thinner limit order book. Because most mandatory institutional transactions consist of utilitarian content and are likely to issue marketable orders, the inventory risk should amplify more liquidity co-movements on best quoted depth than on market depth after the tick-size conversion. Our empirical evidence confirms that the best quoted depth of the test group realized greater positive liquidity β under the smaller tick-size regime, whereas market depth, which is primarily contributed from small liquidity traders, had a less definitive effect before and after the change. The irregular results from market depth can be partially attributed to liquidity noise introduced by limit orders of which the prices vary too much from that of the market. Our empirical results on the influences of tick-size changes on commonality in the four liquidity measures corroborate the evidence in microstructure literature that penny trading has a less definitive effect on depth than on spread.
Table-3. Market-wide commonality in liquidity before and after the tick size conversiona
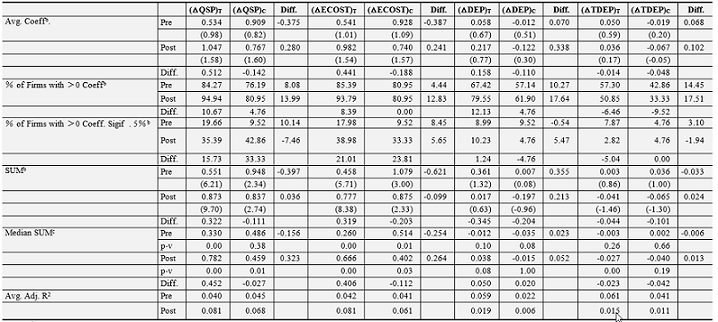
Note: a ΔQSP, ΔECOST, ΔDEP, and ΔTEDP, respectively denote the proportional changes of quoted spread, execution cost, the best quoted depth, and the market depth. ( )T and ( )C respectively denotes TEST and CONTROL groups. Each variable is calculated for the six-month periods before and after 1 March 2005, the date on which the new tick size rule became effective on the TWSE. b Avg. Coeff. denotes the cross-sectional mean liquidity β; SUM is the sum of cross-sectional coefficients across contemporaneous (t), lag (t-1), and lead (t+1) liquidity β; "% of Firms with >0 Coeff" denotes the proportion of positive liquidity β; "% of Firms with >0 Coeff. Sigif . 5%" denotes the proportion of positive liquidity β with 5% significance level. Numbers in () represent t-statistics. c The p-v is the p-value of the Wilcoxon rank-sum test.
A logical step for further probing commonality sources involves investigating industry-level liquidity co-movements. Industry trading activity can sometimes become increasingly concentrated and cause major inventory fluctuation because of industry life cycles and business seasonality. Moreover, industry-oriented innovations are far more common and understood as a source of asymmetric information than in the market-wide scope. Table 4 lists our empirical results on market and industry commonality in liquidity before and after the tick-size conversion. Our evidence strongly suggests that industry-wide liquidity commonality prevailed in our four liquidity measures in the test groups during both periods. The effect of diminished tick size on liquidity β is even more significant in industry commonality. First, the cross-sectional mean of liquidity β of the quoted spread showed positive during both periods. Furthermore, our evidence demonstrates that the co-movement in test group significantly increased by 0.512, from 0.534 to 1.047 before and after the systematic reduction of the trading tick size, whereas the control group displayed a decline of liquidity β by – 0.142, from 0.909 to 0.767. Compared to market commonality, the within-industry magnitude has been amplified, and the effect of tick-size changes is even more noticeable. The resulting phenomenon of industry commonality was manifest by stringent inventory risk and severe adverse selection. The test group showed increases of 6.257% and 1.70%, respectively, on positive and significant proportions of liquidity β during the decreasing tick-size regime. The cross-sectional mean contemporaneous, lag, and lead liquidity β also increased by 0.113, from 0.467 to 0.580, before and after the tick-size conversion. The median sum statistics supports the existence of positive co-movements in the test group, ascending from 0.151 to 0.309 by 0.309. Finally, the explanatory power of the cross-sectional mean adjusted R2 shows overall improvement after the tick-size conversion.
Second, our empirical results on industry commonality regarding execution costs largely resemble those of the quoted spread. The test group exhibited relatively large cross-sectional positive β during the post period by 0.166, as did the proportions of positive liquidity β and significant liquidity β, by 5.68% and 3.41%. The cross-sectional mean and medium of the sum of contemporaneous, lag, and lead liquidity β also increased by 0.018 and 0.225 after the tick-size conversion. Our control group results are less regular and generally exhibit reverse directions. As shown in Table 4, market commonality shows a higher increment in cross-sectional mean liquidity β and the proportion of significantly estimated coefficients after the diminished tick size. The evidence may imply that a finer price grid can intensify price competition among liquidity providers and trigger more inventory risks that are closely related to market-wide commonality.
Table-4. Market and industry commonality in liquidity before and after the tick size conversiona
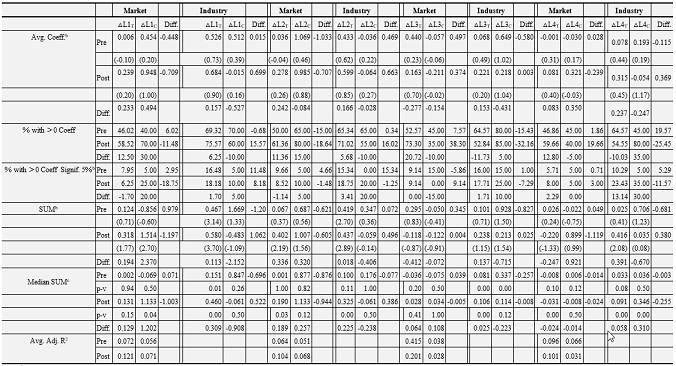
Note: a L1, L2, L3, and L4 respectively denote the proportional changes of quoted spread, execution cost, the best quoted depth, and the market depth. ( )T and ( )C respectively denotes TEST and CONTROL groups. Each variable is calculated for the six-month periods before and after 1 March 2005, the date on which the new tick size rule became effective on the TWSE. b Avg. Coeff. denotes the cross-sectional mean concurrent liquidity β; SUM is the sum of cross-sectional coefficients across contemporaneous (t), lag (t-1), and lead (t+1) liquidity β; "% of Firms with >0 Coeff" denotes the proportion of positive liquidity β; "% of Firms with >0 Coeff. Sigif . 5%" denotes the proportion of positive liquidity β with 5% significance level. Numbers in () represent t-statistics. c The p-v is the p-value of the Wilcoxon rank-sum test.
Finally, the evidence of industry positive liquidity co-movement is significantly robust to the measures of best quoted depth and market depth with the effect of diminished tick size. Our empirical evidence demonstrates that the best quoted depth of the test group realized increasing positive liquidity β under the smaller tick-size regime, whereas market depth, which is primarily contributed from small industry insiders, realized even stronger industry systemic co-movements during the post period. This result is relatively distinct compared with the irregular results from market depth reported in Table 3. More within-industry inventory co-movements and intensified industry core innovations can generate a systematic effect on overall market depth rather than exclusively on the best quoted depth. Our empirical results clearly indicate that industry-wide co-movements are incrementally significant on the cross-sectional mean of estimated liquidity β, and the proportions of positive β and significant β during the post period. Our evidence indicates that the relative competitiveness among the entire trading environment, which is affected by the smaller trading tick size, causes industry-wide liquidity risk in the entire limit order book, instead of concentrating exclusively on the most marketable depth.
4.2. Commonality, Inventory Risk, and Asymmetric Information Before and After Tick-Size ConversionAfter collecting strong evidence of the tick-size effect on commonality in liquidity, we identified the potential determinants interacting within the new tick-size regime that influence liquidity co-movements. The market microstructure literature suggests that inventory risk and asymmetric information are two fundamental mechanisms underlying general influences on broad trading activity. Jones et al. (1994) observed that both trading frequency and dollar volume of trading exert significant influences on return volatility. Their empirical evidence suggests that the appropriate indicator of asymmetric information should be the number of trades and the proxy of dollar volume can be misleading because informed market traders tend to split their large trades into smaller pieces by conducting stealthy trading. Chordia et al. (2000) emphasized that systematic inventory risks are naturally broad market trading activities and likely affect market-wide and industry-wide liquidity co-movements. In this empirical inquiry, we simultaneously employed individual trading frequency and individual dollar trading size, market-wide dollar volume, and industry-wide dollar volume to examine the relative influences of inventory risk and asymmetric information on liquidity commonality in the context of changes on minimum price variation. Table 5 reports our empirical results on the proportional changes of four liquidity constructs affected by trade size, trading frequency, and market and industry trading volumes before and after the tick-size conversion. Our findings are seemingly puzzling and occasionally contradict the literature results. Both individual trade size and trading frequency exhibited significantly negative influences on both spread measures before and after tick-size conversion. Consistent with the results listed in Tables 3 and 4, the diminished tick size exerts substantial effects on liquidity changes in absolute terms of magnitude. Our results indicate that, all else being equal, a large individual trade size and high number of trades cause a small quoted spread and low execution cost, and vice versa. Because of the peculiar features of the Taiwanese stock market, retail transactions and uninformed utilitarian traders dominate most market trading activity. The contributions of individual retail and liquidity transactions significantly reduce inventory handling costs for market liquidity consumers and alleviate the adverse selection opportunities. A thin limit order book, followed by diminished tick size, enhances the effect of active retailing. The empirical evidence on two depth measures further supports the results on trade size and trading frequency regarding quoted spread and execution costs. The proportional changes of trade size and trading frequency exhibit a significantly positive association with the changes of both best quoted depth and market depth. The booming trading activity initiated by largely proportional individual uninformed traders tends to attract more liquidity provision in the entire limit order books, particular for total market depth. Consequently, a large trade size and frequent trade provide considerable market liquidity, thereby reducing market-wide inventory management costs. Changes of market dollar volume show strong positive influences on both proportional changes of quoted spreads and execution costs. High turn-over, retail-dominated, and majority herding behavior of the Taiwan stock market elucidate these puzzling results. Surging broad market activity by the majority exhibiting extreme market psychology swings creates massive liquidity demand and raises immediacy costs.
Table-5. Commonalities in trade size, transaction frequency, and trading volume before and after the tick size conversiona
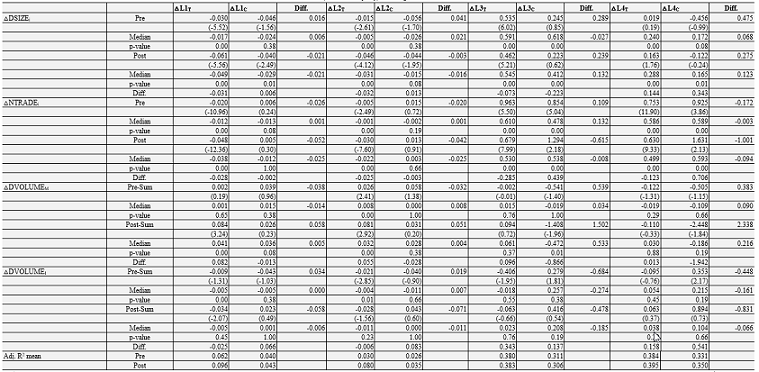
Note: a L1, L2, L3, and L4 respectively denote the proportional changes of quoted spread, execution cost, the best quoted depth, and the market depth.. ( )T and ( )C respectively denotes TEST and CONTROL groups. Each variable is calculated for the six-month periods before and after 1 March 2005, the date on which the new tick size rule became effective on the TWSE. b Pre-and post- denote respectively the cross-sectional mean concurrent liquidity β before and after tick size conversion; Pre-SUM and Post-Sum respectively denote the sum of cross-sectional mean contemporaneous (t), lag (t-1), and lead (t+1) liquidity β. Numbers in () represent t-statistics. The p-value is calculated from the Wilcoxon rank-sum test.
A high market volume involves relatively chaotic sentiments and market momentum and creates obstacles for optimal inventory management. A massive market volume occasionally carries certain trading innovations unknown to the public and therefore widens the spreads. The effects of market volume on quoted spreads and execution costs are amplified by introducing the narrowing tick-size pricing regime. The results on diminished spread and contracting depth in a small pricing grid are manifested by comparing the estimated coefficients before and after the tick-size conversion. This line of reasoning gains further support from the results on both depth constructs. A greater market volume is typically associated with smaller best depth and market depth, although not statistical significance. Third, our results on industry-wide trading volume indicate a significantly negative association with both quoted spreads and execution costs. The results closely resemble individual attributes of trade size and trading frequency. Consistent with the conjectures of Chordia et al. (2000) within-industry influence is more plausibly between market-wide and individual idiosyncratic influence. The effects of industry dollar volume on both best depth and market depth are typically negative and more related to market-wide dollar volume. In summary, Table 5 documents rich market interactions among the distinct channels of inventory risk and adverse selection, and proxies of individual trade size and trading frequency, market-wide dollar volume, and with-industry dollar volume, affect liquidity commonality prior to and after tick-size conversion in the Taiwan stock market.
4.3. Commonality versus Individual Determinants of Liquidity before and After Tick-Size ConversionFinally, we investigated the relative marginal influences of individual determinants related to broad within-industry commonality of liquidity. The market microstructure literature indicates that individual volatility, price level, and trading volume decisively influence individual liquidity. Trading volume can reduce inventory risk and thereby negatively affects liquidity, whereas volatility as a proxy of asymmetric information should exert a positive influence on spreads. Market price level typically causes an increase in quoted spreads and execution costs. Our chosen broad liquidity constructs target within-industry liquidity because of its role in intermediate market-wide and individual idiosyncratic settings. We conducted a cross-sectional regression analysis on this subject by using a two-stage approach by Fama and MacBeth (1973). Table 6 reports the influences of individual liquidity determinants and within-industry commonality on our liquidity constructs before and after the tick-size conversion. Our empirical results mostly conform to the theoretical predictions on stock volatility, market price level, individual trading volume, and industry liquidity. A greater return volatility and price level causes a greater quoted spread and execution cost, and a smaller best depth and total depth. Diminished tick size strengthens the influences of volatility and market price on the four liquidity constructs. Individual dollar volume significantly negatively influences both quoted spreads and execution costs, and positively influences best depth and total depth. The narrow tick size triggers substantial individual trade volume effects on the four liquidity measures. After we accounted for the three firm-specific liquidity determinants, our empirical results indicate that significant industry commonality prevails among our four liquidity measures before and after the tick-size conversion. We observed a nuisance regarding the relative strength of industry commonality among the changing tick-size regimes. In a finer pricing grid, the cross-sectional influences of industry liquidity on the four liquidity constructs are relatively weak compared with previous results. The plausible reasons are that the liquidity measurement has shifted from the proportional changes of liquidity to the liquidity level, which may not be perfectly suitable for gauging liquidity co-movements. Moreover, cross-sectional regression might introduce more noise, making the comparison irrelevant. In summary, our empirical evidence exhibits ubiquitous industry liquidity co-movements after we accounted for individual liquidity determinants, and confirms the effects of tick size on systematic liquidity.
Table-6. Individual liquidity determinants and tick size commonality before and after the tick size conversion
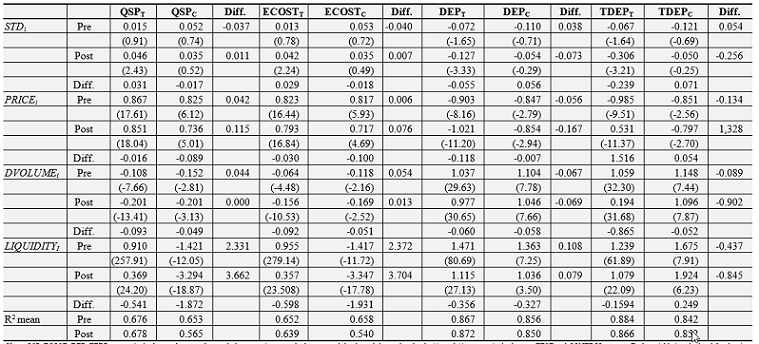
Note: QSP, ECOST, DEP, TEDP, respectively denote the quoted spread, the execution cost, the best quoted depth, and the market depth. ( )T and ( )C respectively denotes TEST and CONTROL groups. Each variable is calculated for the six-month periods before and after 1 March 2005, the date on which the new tick size rule became effective on the TWSE. The adopted estimation method is the two-stage procedure of Fama and MacBeth (1973) the parentheses ( ) denotes the t-statistics of estimated coefficients.
5. CONCLUSION AND DISCUSSION
This study suggests that the change of tick size, particularly a step-function tick system, accounts for the cross-sectional variation in market liquidity. We explored the relative significance of commonality in liquidity in a limit order book during tick-size conversion, and empirically examined the interactions of inventory risk and asymmetric information in liquidity co-movements. We discovered that market-wide and within-industry commonality in liquidity is ubiquitous before and after tick-size conversion. Moreover, small spreads and a thin limit order book introduced by the narrow minimum price variation can further strengthen liquidity co-movements. We also observed that trade size and trading frequency exhibit substantially negative influences on both spread measures before and after tick-size conversion, whereas they exert substantially positive effects for depth constructs. Active retailing and utilitarian transactions reduce inventory handling costs for market liquidity providers and alleviate adverse selection opportunities. By contrast, changes in market dollar volume show strongly positive influences on both proportional changes of quoted spread and execution cost. Surging broad market activity by the majority exhibiting extreme market psychology swings creates massive liquidity demand and raises immediacy costs. Furthermore, a massive market volume occasionally carries certain trading innovations unknown to the public and therefore widens the spreads. As anticipated, within-industry liquidity commonality exhibits an intermediate effect of market-wide and individual idiosyncratic influences, and tick size substantially affects the relative importance of inventory risk and adverse selection in the entire limit order book. Finally, we documented affluent industry-wide liquidity co-movements before and after tick-size conversion, after accounting for the marginal influences of potent idiosyncratic liquidity determinants, including volatility, market price, and trade volume. Our empirical evidence reveals that a narrow tick size might generate considerable market-wide liquidity risk and create noticeable adverse effects on market quality.
| Funding: This study received no specific financial support. |
| Competing Interests: The authors declare that they have no competing interests. |
| Contributors/Acknowledgement: All authors contributed equally to the conception and design of the study. |
REFERENCES
Acharya, V.V. and L.H. Pedersen, 2005. Asset pricing with liquidity risk. Journal of Financial Economics, 77(2): 375-410. View at Google Scholar
Bacidore, J., 1997. The impact of decimalization on market quality: An empirical investigation of the Toronto stock exchange. Journal of Financial Intermediation, 6(2): 92-120. View at Google Scholar | View at Publisher
Brockman, P., D.Y. Chung and C. Pérignon, 2009. Commonality in liquidity: A global perspective. Journal of Financial Quantitative Analysis, 44(4): 851-882. View at Google Scholar | View at Publisher
Chordia, T., R. Roll and A. Subrahmanyam, 2000. Commonality in liquidity. Journal of Financial Economics, 56(1): 3-28. View at Google Scholar
Comerton-Forde, C. and J. Rydge, 2006. The current state of Asia-pacific stock exchanges: A critical review of market design. Pacific-Basin Finance Journal, 14(1): 1-32. View at Google Scholar | View at Publisher
Crouhy, M. and D. Galai, 1992. The settlement day effect in the French Bourse. Journal of Financial Services Research, 6(4): 417–435. View at Publisher
Fama, E. and J. MacBeth, 1973. Risk, return, and equilibrium: Empirical test. Journal of Political Economy, 81(3): 607-636. View at Google Scholar | View at Publisher
Gibson, S., R. Singh and V. Yerramilli, 2003. The effect of decimalization on the components of the bid-ask spread. Journal of Financial Intermediation, 12(2): 121–148. View at Google Scholar | View at Publisher
Goldstein, M.A. and K.A. Kavajecz, 2000. Eighths, sixteenths and market depth: Changes in tick size and liquidity provision on the NYSE. Journal of Financial Economic, 56(1): 125-149. View at Google Scholar | View at Publisher
Harris, L.E., 1999. Trading in pennies: A survey of the issues. Working Paper, University of Southern California.
Hasbrouck, J. and D.J. Seppi, 2001. Common factors in prices, order flows, and liquidity. Journal of Financial Economics, 59(3): 383-411. View at Google Scholar
Huang, R.D. and H.R. Stoll, 1997. The components of the bid-ask spread: A general approach. Review of Financial Studies, 10(4): 995-1034. View at Google Scholar | View at Publisher
Hubberman, G. and D. Halka, 1999. Systematic liquidity. Working Paper, Columbia Business School.
Jones, C., G. Kaul and M. Lipson, 1994. Transactions, volume, and volatility. Review of Financial Studies, 7(4): 631-651. View at Google Scholar | View at Publisher
Jones, C.M. and M.L. Lipson, 2001. Sixteenths: Direct evidence on institutional execution costs. Journal of Financial Economics, 59(2): 253-278. View at Google Scholar | View at Publisher
Kamara, A., X. Lou and R. Sadka, 2008. The divergence of liquidity commonality in the cross-section of stocks. Journal of Financial Economics, 89(3): 444-466. View at Google Scholar | View at Publisher
Kamara, A., X. Lou and R. Sadka, 2010. Has the US stock market become more vulnerable over time? Financial Analysts Journal, 66(1): 41-52. View at Google Scholar | View at Publisher
Kuo, S., C. Huang and C. Chen, 2013. Tick size reduction and the components of the bid-ask spread on the Taiwan stock exchange. Working Paper, National Yunlin University of Science and Technology.
Lee, C.M.C. and M.J. Ready, 1991. Inferring trade direction from intraday data. Journal of Finance, 46(2): 733-746. View at Google Scholar | View at Publisher
Lo, A.W. and J. Wang, 2000. Trading volume: Definitions, data analysis, and implications of Portfolio theory. Review of Financial Studies, 13(2): 257-300. View at Google Scholar | View at Publisher
Pastor, L. and R.F. Stambaugh, 2003. Liquidity risk and expected stock returns. Journal of Political Economy, 111(3): 642–685.
Rhee, S.G. and R.P. Chang, 1992. The microstructure of Asian equity market. Journal of Financial Services Research, 6(4): 437–454. View at Publisher