


HOW DO INVERSE EXCHANGE-TRADED FUNDS TARGETING TAIWAN SHARES TRACK THEIR UNDERLYING INDICES?
Ph.D., Associate Professor, Department of Banking and Finance, Takming University of Science and Technology Taipei, Taiwan, R.O.C.
ABSTRACT
Amid the tremendous interest of Taiwanese investors in short selling, seven inverse exchange-traded funds (IETFs) targeting the inverse of Taiwan equity benchmark indices were rolled out one after another on the Taiwan market in less than four years. This paper evaluated the tracking performance of these IETFs against their stated return objectives and investigated what factor, fund management issue or market inefficiency, correlated more to performance. The empirical results showed that fund management issues accounted for the majority of the IETFs’ variation in tracking performance, whereas the impact of market inefficiency was relatively small and stable. The study further examined the fundamental determinants of IETFs’ return deviation and discovered that target return volatility, management fee rates, the availability of corresponding futures, share turnover, and turnover rate were influential factors. Among those factors, target return volatility and management fee rates were the two most decisive factors affecting the tracking performance.
Keywords:Inverse exchange-traded fund, Taiwan, Tracking performance, Total return deviation, Pricing deviation, Net asset value deviation, Fund management, Market inefficiency.
JEL Classification:G11; G12; G14.
ARTICLE HISTORY: Received: 23 March 2020, Revised: 5 May 2020, Accepted: 7 June 2020, Published: 22 June 2020
Contribution/ Originality: This study contributes to the existing literature on the tracking performance of inverse exchange-traded funds on the Taiwan market, and discovered that fund management issues accounted for the majority of the inverse exchange-traded funds’ variation in tracking performance.
1. INTRODUCTION
An inverse exchange-traded fund (IETF) is a listed security that promises to deliver the inverse (before fees and expenses) of a reference index. These funds achieve their goals by using short selling, trading derivatives such as futures contracts, and other leveraged investment techniques. In 2006, leveraged and inverse exchange-traded funds (ETFs) were introduced to the market, allowing investors and portfolio managers to take leveraged and/or inverse exposure to indices.
Taiwan launched its first IETF, Yuanta Daily Taiwan 50 Bear -1X ETF (00632R, hereafter referred to as Yuanta IETF), on October 31, 2014. This IETF became the world's largest IETF in June 2017 and still is. Another six IETFs were introduced one after another to the market in the next four years after the first launch, although only four of them are still trading on the market. Table 1 lists the seven inverse ETFs that once traded or are still trading on the Taiwan market. Among them, TSIT MSCI Taiwan Daily Inverse -1X ETF (TSIT IETF) and FSITC Taiwan Industry Elite 30 Inverse -1X ETF (FSITC IETF) terminated their listing on November 27, 2018 and June 25, 2019, respectively. Table 1 also shows that Yuanta IETF and FSITC IETF charge the highest management fee rate, 1%. Cathay TAIEX Daily Inversed ETF (Cathay IETF) and TSIT IETF charge a rate of 0.75%. Next, Fubon TAIEX Daily Inverse -1X ETF (Fubon IETF) and Mega Taiwan Blue Chip 30 Inversed -1X ETF (Mega IETF) charge a rate of 0.65%. Capital TAIEX Daily Inversed -1X ETF (Capital IETF) charges the lowest rate of 0.3%.
Figure 1 plots the monthly data for the net asset values (NAVs) of each IETF for Taiwan shares since its launch. We can see that Yuanta IETF, Taiwan’s first IETF, has always been the largest IETF of this market and reached its largest scale in September 2016 with a NAV of over NT$90 billion. Figure 2 plots the monthly data for aggregate NAVs of all the IETFs for Taiwanese shares from October 2014 to the end of 2018. We can see that the aggregate NAV of these Taiwan shares IETFs also reached its maximum in September 2016 and is in many cases positively correlated with the market index, the Taiwan Stock Exchange Capitalization Weighted Stock Index (TAIEX). The positive relationship between TAIEX and the aggregate NAV of the Taiwan shares IETFs may be attributable to the hedging needs or short-selling demand when the stock market rises.
This study was interested in understanding the tracking performance of these Taiwan shares IETFs and if the tracking performance mainly depended on fund management issues or market efficiency. The paper also tried to identify factors that may correlate with the tracking performance measured by return deviations. The results of this study provide useful information for investors and portfolio managers when making hedging or investment decisions.
The rest of the paper is organized as follows. Section 2 briefly reviews related literature. Section 3 describes the methodology of this study. Section 4 describes data and displays their descriptive statistics. Section 5 presents the empirical results and section 6 concludes.
Table-1. IETFs targeting the inverse of Taiwan shares indices of Taiwan Stock Exchange Corporation (TWSE).
ETF Name |
Yuanta Daily Taiwan 50 Bear -1X ETF |
Cathay TAIEX Daily Inversed ETF |
Fubon TAIEX Daily Inverse -1X ETF |
Capital TAIEX Daily Inversed -1X ETF |
Mega Taiwan Blue Chip 30 Inversed -1X ETF |
TSIT MSCI Taiwan Daily Inverse -1X ETF |
FSITC Taiwan Industry Elite 30 Inverse -1X ETF |
Code |
00632R |
00664R |
00676R |
00686R |
00691R |
00705R |
00729R |
Listing date |
2014.10.31 |
2016.07.14 |
2016.10.05 |
2017.03.30 |
2017.03.31 |
2017.08.10 |
2018.04.18 |
Tracking index |
The Inverse of Taiwan 50 Index |
TAIEX Daily Return Inverse -1X Index |
TAIEX Daily Return Inverse -1X Index |
TAIEX Daily Return Inverse -1X Index |
TIP TAIEX+ Blue Chip 30 Inversed -1X Index |
MSCI Taiwan Short Daily Index |
TIP TAIEX+ Industry Elite 30 Daily Return Inverse -1X Index |
Tracking strategy |
Synthetic Replication |
Synthetic Replication |
Representative Sampling |
Synthetic Replication |
Synthetic Replication |
Representative Sampling |
Synthetic Replication |
Management fee rate |
1.00% |
0.75% |
0.65% |
0.30% |
0.65% |
0.75% |
1.00% |
Custodian fees rate |
0.04% |
0.04% |
0.04% |
0.04% |
0.04% |
0.04% |
0.04% |
Portfolio composition |
TAIEX Futures, Taiwan 50 ETF Futures |
TAIEX Futures |
TAIEX Futures |
TAIEX Futures |
TAIEX Futures |
TAIEX Futures, MSCI Taiwan Index Futures |
TAIEX Futures |
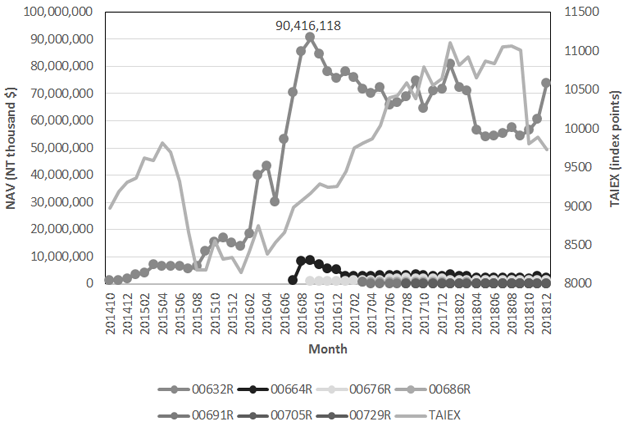
Figure-1. Net asset values of the seven IETFs for Taiwan shares and the TAIEX.
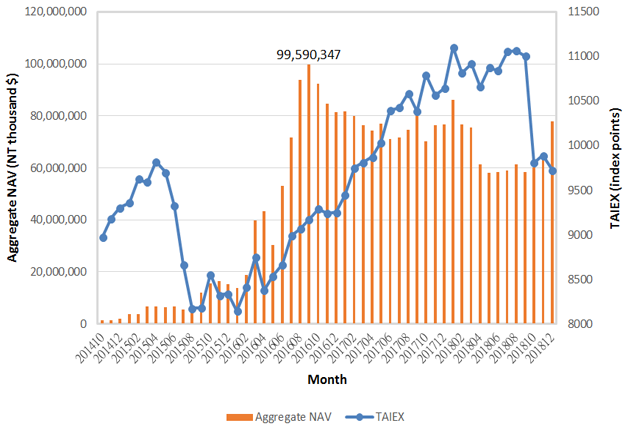
Figure-2. Aggregate net asset values of the IETFs for Taiwan shares and the TAIEX
2. LITERATURE REVIEW
The need to hedge exposure to volatile spot prices and the cost of holding directly the spot assets have resulted in the rapid development of futures (Tang & Xu, 2016![]() ). However, hedging or investing through futures requires “rolling over” the futures contracts before expiration and “marking to market” daily to maintain the margin, making it too complicated and undesirable for most individual investors and some institutional investors (Erb & Harvey, 2006
). However, hedging or investing through futures requires “rolling over” the futures contracts before expiration and “marking to market” daily to maintain the margin, making it too complicated and undesirable for most individual investors and some institutional investors (Erb & Harvey, 2006![]() ; Hirshleifer, 1989
; Hirshleifer, 1989![]() ). With the introduction of ETFs, investors have another exchange-traded-instrument choice for hedging or investing that possesses liquidity and flexibility. Leveraged/inverse ETFs enable investors to take leveraged and/or inverse exposure to an underlying benchmark without resorting to the futures market (Tang & Xu, 2016
). With the introduction of ETFs, investors have another exchange-traded-instrument choice for hedging or investing that possesses liquidity and flexibility. Leveraged/inverse ETFs enable investors to take leveraged and/or inverse exposure to an underlying benchmark without resorting to the futures market (Tang & Xu, 2016![]() ).
).
In 2006, leveraged and inverse ETFs were first released into the market. Trainor and Baryla (2008![]() ) studied the long term holding period returns of leveraged ETFs and found that those returns vary in different market conditions. They demonstrated that returns on leveraged ETFs are lognormally distributed, which is caused by compounding random returns and causes the distribution of returns to be positively skewed (skewed to the right). That is, the median return is below the mean return and investors are statistically more likely to get a return less than the average return. However, the returns that are larger than the average can be a lot larger.
) studied the long term holding period returns of leveraged ETFs and found that those returns vary in different market conditions. They demonstrated that returns on leveraged ETFs are lognormally distributed, which is caused by compounding random returns and causes the distribution of returns to be positively skewed (skewed to the right). That is, the median return is below the mean return and investors are statistically more likely to get a return less than the average return. However, the returns that are larger than the average can be a lot larger.
Cheng and Madhavan (2009![]() ) showed that under certain circumstances the long term returns can be significantly below that of the appropriately levered underlying index. This is particularly true for volatile indices and for IETFs. Therefore, they believed leveraged and inverse ETFs are not suitable for buy-and-hold investors, and the unsuitability of these products for longer-term investors is reinforced by tax inefficiency and the cumulative drag on returns from transaction costs related to daily re-balancing activity.
) showed that under certain circumstances the long term returns can be significantly below that of the appropriately levered underlying index. This is particularly true for volatile indices and for IETFs. Therefore, they believed leveraged and inverse ETFs are not suitable for buy-and-hold investors, and the unsuitability of these products for longer-term investors is reinforced by tax inefficiency and the cumulative drag on returns from transaction costs related to daily re-balancing activity.
Militaru and Dzekounoff (2010![]() ) found that the amount of volatility determines the distribution of possible returns for a leveraged fund. The lower the volatility, the more symmetric the alternative outcomes will be. High volatility pushes the majority of possible returns downward. Charupat and Miu (2011
) found that the amount of volatility determines the distribution of possible returns for a leveraged fund. The lower the volatility, the more symmetric the alternative outcomes will be. High volatility pushes the majority of possible returns downward. Charupat and Miu (2011![]() ) found that, while price deviation is generally small, leverage and inverse ETFs are inclined to have larger deviation than traditional ETFs. While bull leveraged ETFs trade at a discount or slight premium, on average, bear leveraged ETFs tend to trade at relatively larger premiums.
) found that, while price deviation is generally small, leverage and inverse ETFs are inclined to have larger deviation than traditional ETFs. While bull leveraged ETFs trade at a discount or slight premium, on average, bear leveraged ETFs tend to trade at relatively larger premiums.
In their study on the ability of leveraged energy exchange-traded funds (LEETFs) to track the underlying index, Tang and Xu (2016![]() ) measured the track performance as the difference between the LEETF’s actual market price return and the expected return based on the underlying index. This tracking performance measure is also referred to as total return deviation. On a daily basis, this total return deviation could be due to fund management issues in tracking the underlying index (NAV deviation) or to market inefficiency in trading LEETFs (inefficiency deviation). Their empirical results showed that market inefficiency accounts for the majority of the LEETFs’ daily total return deviation, whereas the impact of fund management issues is relatively small and stable.
) measured the track performance as the difference between the LEETF’s actual market price return and the expected return based on the underlying index. This tracking performance measure is also referred to as total return deviation. On a daily basis, this total return deviation could be due to fund management issues in tracking the underlying index (NAV deviation) or to market inefficiency in trading LEETFs (inefficiency deviation). Their empirical results showed that market inefficiency accounts for the majority of the LEETFs’ daily total return deviation, whereas the impact of fund management issues is relatively small and stable.
3. METHOD
3.1. Beta Estimation
Henderson and Buetow (2014![]() ) used a baseline performance regression model to evaluate the performance of leveraged and inverse leveraged ETFs against their stated return objectives. Similarly, Tang and Xu (2016
) used a baseline performance regression model to evaluate the performance of leveraged and inverse leveraged ETFs against their stated return objectives. Similarly, Tang and Xu (2016![]() ) used the exposure of LEETFs to their underlying indices as a measure of tracking performance.
) used the exposure of LEETFs to their underlying indices as a measure of tracking performance.
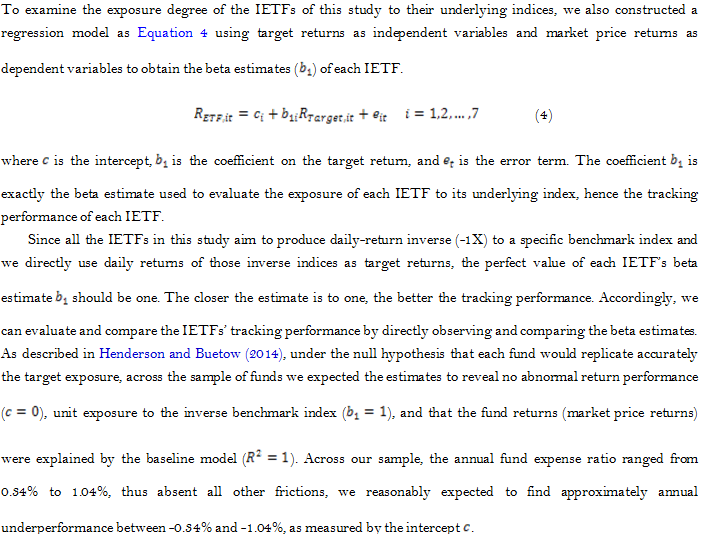
Cheng and Madhavan (2009![]() ) discussed that leveraged and inverse ETFs require daily rebalancing to maintain the target leverage multiples or the target inverse, and demonstrate that the daily rebalancing need of both bull funds and bear funds are of identical direction as that of the daily return to the benchmark index. That is, positive returns to the benchmark index require both “bull” and “bear” funds to buy exposure: the former increases its long exposure while the latter reduces its short exposure.
) discussed that leveraged and inverse ETFs require daily rebalancing to maintain the target leverage multiples or the target inverse, and demonstrate that the daily rebalancing need of both bull funds and bear funds are of identical direction as that of the daily return to the benchmark index. That is, positive returns to the benchmark index require both “bull” and “bear” funds to buy exposure: the former increases its long exposure while the latter reduces its short exposure.
Dobi and Avellaneda (2012![]() ) argued that traders may have incentive to front-run the rebalance trade, exacerbating the cost of daily rebalancing near the market close that are born by investors in these funds. Cheng and Madhavan (2009
) argued that traders may have incentive to front-run the rebalance trade, exacerbating the cost of daily rebalancing near the market close that are born by investors in these funds. Cheng and Madhavan (2009![]() ) considered rebalance costs and transaction costs associated with frequent rebalancing activities to be particularly large during periods of heightened volatility, and Henderson and Buetow (2014
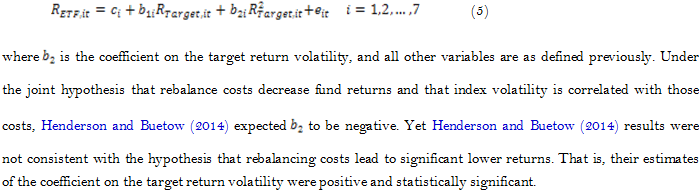
) considered rebalance costs and transaction costs associated with frequent rebalancing activities to be particularly large during periods of heightened volatility, and Henderson and Buetow (2014![]() ) therefore proposed a model relating transaction costs to the realized volatility of the benchmark index. Under the assumption that transaction costs are proportional to the size of rebalance trades, and a fund’s rebalance needs are correlated with the magnitude of the daily index movement, we also constructed Equation 5 to test the following model relating the contemporaneous volatility to the daily return like Henderson and Buetow (2014
) therefore proposed a model relating transaction costs to the realized volatility of the benchmark index. Under the assumption that transaction costs are proportional to the size of rebalance trades, and a fund’s rebalance needs are correlated with the magnitude of the daily index movement, we also constructed Equation 5 to test the following model relating the contemporaneous volatility to the daily return like Henderson and Buetow (2014![]() ):
):
3.2. Daily Return Deviation
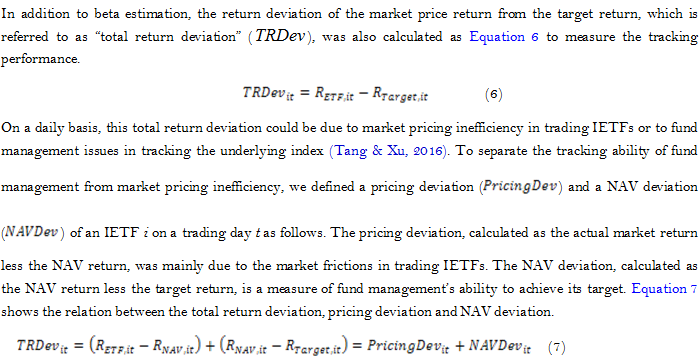
To examine whether the return deviation was due to market frictions or due to fund management issues, we regressed total return deviation on pricing deviation and on NAV deviation separately to observe which deviation component was more closely related to total return deviation.
To further identify those factors that were related to the three deviations, we then regressed total return deviation, pricing deviation and NAV deviation on six potential factors. The factors were IETFs’ daily share turnover, turnover rate, market value, target return volatility, management fee rate, and a dummy variable that reflected whether the IETFs have corresponding index futures trading on the market. The dummy equals one over the whole sample period for an IETF if it has corresponding index futures trading on the market and equals 0 otherwise.
4. DATA AND DESCRIPTIVE STATISTICS
Our sample consisted of seven IETFs that aimed to produce the inverse daily returns of indices on Taiwanese shares. The data for these seven IETFs covered the period from October 31, 2014, corresponding to the listing of the first Taiwanese IETF, to December 28, 2018 on daily basis, and were provided by the Taiwan Economic Journal (TEJ).
Table 2 first lists the summary statistics for the fund characteristics of the seven IETFs. Each IETF’s daily data of market prices, NAVs, target indices were then gathered to calculate their corresponding returns. The descriptive statistics for each IETF’s market price returns, NAV returns, and target returns are listed in Table 3.
In terms of the median, Table 2 shows that while Yuanta IETF was the largest IETF, it also had the highest share turnover among the seven IETFs. While FSITC IETF was the youngest and smallest IETF, it had the highest turnover rate among the seven IETFs. While Mega IETF had the lowest share turnover and turnover rate, it seemed to have the worst liquidity among the seven IETFs.
Table 3 shows that all the distributions of market price returns of the seven IETFs were positively skewed. In most cases (five out of seven) of market price returns, the median return was below the mean return. In terms of the statistics of Range and Std. Dev. of target returns, we found that the TIP TAIEX+ Industry Elite 30 Daily Return Inverse -1X Index (for FSITC IETF) had the highest magnitude of daily index movement, followed by the Inverse of Taiwan 50 Index (for Yuanta IETF), the MSCI Taiwan Short Daily Index (for TSIT IETF), the TIP TAIEX+ Blue Chip 30 Inversed -1X Index (for Mega IETF), and the TAIEX Daily Return Inverse -1X Index (for Cathay, Fubon and Capital IETFs) the last.
Table-2. Summary statistics for IETF characteristics. This table presents descriptive statistics for the IETFs’ three characteristics: share turnover, turnover rate and market value.
| IETF code | 00632R |
00664R |
00676R |
00686R |
00691R |
00705R |
00729R |
|
Yuanta |
Cathay |
Fubon |
Capital |
Mega |
TSIT |
FSITC |
||
| Observations | 1025 |
610 |
554 |
437 |
436 |
321 |
180 |
|
| Share turnover (thousand shares) | ||||||||
| Mean | 47128 |
3987 |
5471 |
1232 |
47 |
110 |
584 |
|
| Median | 37605 |
2736 |
3545 |
1007 |
3 |
14 |
607 |
|
| Maximum | 404325 |
37388 |
25176 |
7557 |
1449 |
1717 |
1121 |
|
| Minimum | 1694 |
189 |
346 |
2 |
0 |
0 |
8 |
|
| Range | 402631 |
37199 |
24830 |
7555 |
1449 |
1717 |
1113 |
|
| Std. Dev. | 40950 |
3767 |
4675 |
1221 |
135 |
233 |
143 |
|
| Skewness | 2.6296 |
2.8068 |
1.2623 |
1.2907 |
5.2654 |
3.6328 |
0.1874 |
|
| Kurtosis | 16.7706 |
16.5455 |
4.0040 |
5.2051 |
41.0828 |
19.4571 |
5.3898 |
|
| Turnover rate (share turnover / outstanding shares × 100%) | ||||||||
| Mean | 2.6124 |
2.1236 |
4.6960 |
3.5328 |
0.6062 |
1.2698 |
10.9701 |
|
| Median | 1.5055 |
1.4655 |
1.9813 |
2.0330 |
0.0606 |
0.2375 |
10.8253 |
|
| Maximum | 26.2467 |
29.3235 |
32.2724 |
23.0622 |
16.8371 |
15.1817 |
24.3289 |
|
| Minimum | 0.2105 |
0.1032 |
0.2116 |
0.0073 |
0.0000 |
0.0000 |
0.1429 |
|
| Range | 26.0362 |
29.2203 |
32.0608 |
23.0549 |
16.8371 |
15.1817 |
24.1860 |
|
| Std. Dev. | 2.9591 |
2.5482 |
5.9394 |
3.7709 |
1.5786 |
2.4166 |
4.1252 |
|
| Skewness | 3.0030 |
5.3045 |
1.9487 |
1.6350 |
4.9256 |
3.2555 |
0.3181 |
|
| Kurtosis | 16.2943 |
43.0036 |
6.2963 |
6.3439 |
36.9114 |
15.4724 |
2.7844 |
|
| Market value (NT million $) | ||||||||
| Mean | 47089 |
3313 |
1351 |
315 |
111 |
133 |
112 |
|
| Median | 56512 |
2686 |
1294 |
242 |
108 |
116 |
105 |
|
| Maximum | 90235 |
8501 |
2822 |
742 |
240 |
230 |
218 |
|
| Minimum | 1248 |
633 |
687 |
190 |
77 |
34 |
81 |
|
| Range | 88987 |
7868 |
2135 |
552 |
163 |
196 |
137 |
|
| Std. Dev. | 28989 |
1704 |
380 |
152 |
31 |
55 |
26 |
|
| Skewness | -0.4013 |
1.7086 |
1.1983 |
1.6538 |
1.7892 |
0.3517 |
1.1377 |
|
| Kurtosis | 1.5910 |
5.0876 |
6.4470 |
4.3941 |
6.7442 |
2.0997 |
4.6095 |
|
Table-3. Descriptive statistics for daily returns. This table presents descriptive statistics for the IETFs’ market price return, NAV return and target return.
| IETF code | 00632R |
00664R |
00676R |
00686R |
00691R |
00705R |
00729R |
|
Yuanta |
Cathay |
Fubon |
Capital |
Mega |
TSIT |
FSITC |
||
| Observations | 1025 |
610 |
554 |
437 |
436 |
319 |
180 |
|
| Market price returns | ||||||||
| Mean | -0.0393 |
-0.0459 |
-0.0367 |
-0.0262 |
-0.0269 |
-0.0141 |
0.0188 |
|
| Median | -0.0722 |
-0.1100 |
-0.1034 |
-0.1011 |
0.0000 |
0.0000 |
0.0000 |
|
| Maximum | 7.3880 |
7.3452 |
7.4108 |
7.2321 |
6.6788 |
7.5128 |
7.4437 |
|
| Minimum | -4.9877 |
-3.4015 |
-3.1983 |
-3.4933 |
-2.7646 |
-3.5260 |
-3.1366 |
|
| Range | 12.3757 |
10.7467 |
10.6091 |
10.7254 |
9.4434 |
11.0388 |
10.5803 |
|
| Std. Dev. | 0.8819 |
0.8035 |
0.8100 |
0.8399 |
0.7662 |
1.0092 |
1.0410 |
|
| Skewness | 0.8354 |
1.5147 |
1.7952 |
1.8308 |
1.8349 |
1.8695 |
1.9133 |
|
| Kurtosis | 12.0809 |
17.1544 |
18.5450 |
18.2635 |
19.0201 |
17.6554 |
16.7327 |
|
| NAV returns | ||||||||
| Mean | -0.0386 |
-0.0459 |
-0.0367 |
-0.0271 |
-0.0287 |
-0.0146 |
0.0239 |
|
| Median | -0.0658 |
-0.0695 |
-0.1163 |
-0.1107 |
-0.0615 |
-0.0520 |
-0.0518 |
|
| Maximum | 7.4449 |
7.4510 |
7.3645 |
7.3175 |
6.6288 |
7.5746 |
7.4907 |
|
| Minimum | -4.6678 |
-3.1833 |
-3.1788 |
-3.2496 |
-2.7709 |
-3.5035 |
-2.7588 |
|
| Range | 12.1128 |
10.6343 |
10.5433 |
10.5671 |
9.3996 |
11.0781 |
10.2495 |
|
| Std. Dev. | 0.9164 |
0.8378 |
0.8339 |
0.8692 |
0.7790 |
0.9800 |
1.0408 |
|
| Skewness | 0.7389 |
1.3959 |
1.6089 |
1.6765 |
1.7277 |
1.7334 |
1.9511 |
|
| Kurtosis | 9.8534 |
15.5821 |
16.3127 |
16.5120 |
16.8206 |
15.4704 |
16.6239 |
|
| Target returns | ||||||||
| Mean | -0.01099 |
-0.02134 |
-0.01486 |
-0.00391 |
-0.00556 |
0.025514 |
0.06496 |
|
| Median | -0.0354 |
-0.05975 |
-0.05975 |
-0.0574 |
-0.02135 |
-0.0645 |
0.0948 |
|
| Maximum | 6.6368 |
6.1212 |
6.1212 |
6.1212 |
6.2285 |
6.7376 |
7.5317 |
|
| Minimum | -4.4445 |
-2.9403 |
-2.9403 |
-2.9403 |
-3.4444 |
-3.3034 |
-4.0776 |
|
| Range | 11.0813 |
9.0615 |
9.0615 |
9.0615 |
9.6729 |
10.0410 |
11.6093 |
|
| Std. Dev. | 0.966356 |
0.780514 |
0.784473 |
0.816799 |
0.868704 |
0.977725 |
1.258998 |
|
| Skewness | 0.45233 |
1.166863 |
1.318299 |
1.374333 |
0.937875 |
1.391723 |
0.85995 |
|
| Kurtosis | 7.062691 |
12.24946 |
12.77378 |
12.93665 |
10.8478 |
11.66233 |
10.12642 |
|
5. EMPIRICAL RESULTS
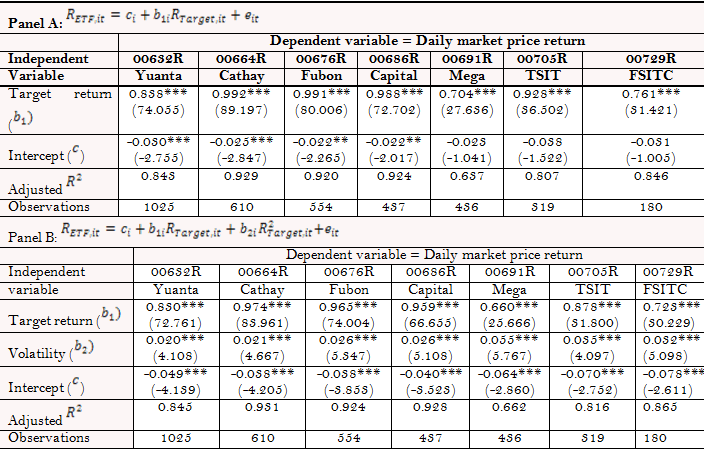
5.1. Beta Estimation
Table-4. Daily exposure of IETFs to their corresponding underlying index. This table presents estimation results of Equations 4 and 5. b1 is the beta estimate used to evaluate the exposure of each IETF to its underlying index. Target return volatility here is used to represent rebalance and transaction costs. Numbers in parentheses are t-statistics. One, two, and three asterisks denote significance at the 10%, 5%, and 1% level, respectively.
5.2. Daily Return Deviation
Table 5 lists the descriptive statistics for daily total return deviation, pricing deviation, and NAV deviation. Whether it is a positive deviation or a negative deviation, deviation is an undesired bias. Therefore, we looked at the absolute value, i.e. the range, when comparing deviations. Observing the medians of the total return deviation, we saw that the Mega IETF had the smallest deviation (-0.01), whereas the IETF launched the latest, i.e. the FSITC IETF, had the biggest deviation (-0.059). Although Yuanta IETF was the first IETF on the Taiwan market and has always been the largest IETF of this market, its total return deviation was not small (-0.0286). Such results appear to be partially contradictory to the results of the beta estimates.
So we tried to look at the Std. Dev. of the total return deviation, to get a more consistent result. At this time, the three IETFs (Cathay, Fubon and Capital IETFs) had smaller deviation volatility, indicating that they may have better tracking performance. The Mega and FSITC IETFs had greater deviation volatility indicating that their tracking performance may be poor.
Observing the medians of the pricing deviation and the NAV deviation, we saw that IETFs’ deviation mainly comes from the NAV deviation, which was related to fund management issues. The Mega and FSITC IETFs had greater pricing deviation compared to other IETFs, while the Mega IETF had the smallest NAV deviation (-0.0165), followed by Capital, Cathay and Fubon IETFs (-0.0223, -0.0230 and -0.0260), and Yuanta IETF the largest (-0.0370).
Table-5. Descriptive statistics for daily total return deviation, pricing deviation, and NAV deviation. The total return deviation is calculated as the actual market return less the target return, a measure of tracking performance. The pricing deviation is calculated as the actual market return less the NAV return, mainly due to the market frictions in trading IETFs. The NAV deviation is calculated as the NAV return less the target return, measuring fund management’s ability to achieve its target.
| IETF code | 00632R |
00664R |
00676R |
00686R |
00691R |
00705R |
00729R |
|
Yuanta |
Cathay |
Fubon |
Capital |
Mega |
TSIT |
FSITC |
||
| Observations | 1025 |
610 |
554 |
437 |
436 |
319 |
180 |
|
| Total return deviation | ||||||||
| Mean | -0.0283 |
-0.0245 |
-0.0218 |
-0.0223 |
-0.0214 |
-0.0394 |
-0.0461 |
|
| Median | -0.0286 |
-0.0256 |
-0.0268 |
-0.0262 |
-0.0100 |
-0.0196 |
-0.0590 |
|
| Maximum | 2.2677 |
1.2240 |
1.2896 |
1.1109 |
2.0725 |
1.4518 |
2.0011 |
|
| Minimum | -2.8375 |
-0.9267 |
-0.7235 |
-1.0185 |
-2.0935 |
-1.8970 |
-1.5922 |
|
| Range | 5.1052 |
2.1507 |
2.0131 |
2.1294 |
4.1660 |
3.3488 |
3.5933 |
|
| Std. Dev. | 0.3832 |
0.2142 |
0.2283 |
0.2318 |
0.5279 |
0.4466 |
0.5060 |
|
| Skewness | -0.4036 |
0.3801 |
0.3791 |
0.2170 |
-0.1179 |
-0.1796 |
0.1808 |
|
| Kurtosis | 9.0919 |
5.8264 |
4.8870 |
5.5257 |
4.2510 |
4.6330 |
4.0380 |
|
| Pricing deviation | ||||||||
| Mean | -0.0007 |
0.0000 |
0.0000 |
0.0009 |
0.0017 |
0.0005 |
-0.0051 |
|
| Median | 0.0000 |
0.0000 |
0.0000 |
0.0000 |
0.0001 |
0.0000 |
-0.0035 |
|
| Maximum | 1.0879 |
0.7239 |
0.5457 |
0.8493 |
1.4289 |
1.7368 |
1.0175 |
|
| Minimum | -1.7425 |
-0.6731 |
-0.4917 |
-0.6057 |
-1.5355 |
-1.6680 |
-1.3145 |
|
| Range | 2.8304 |
1.3971 |
1.0374 |
1.4550 |
2.9644 |
3.4048 |
2.3320 |
|
| Std. Dev. | 0.2033 |
0.1502 |
0.1736 |
0.2030 |
0.4549 |
0.4099 |
0.2928 |
|
| Skewness | -0.3816 |
0.1114 |
-0.0047 |
0.1762 |
-0.1517 |
-0.0685 |
-0.1533 |
|
| Kurtosis | 10.2313 |
4.3447 |
3.0073 |
3.5885 |
3.8590 |
5.1531 |
4.9777 |
|
| NAV deviation | ||||||||
| Mean | -0.0276 |
-0.0246 |
-0.0218 |
-0.0232 |
-0.0231 |
-0.0398 |
-0.0410 |
|
| Median | -0.0370 |
-0.0230 |
-0.0260 |
-0.0223 |
-0.0165 |
-0.0341 |
-0.0334 |
|
| Maximum | 1.3373 |
1.3298 |
1.2433 |
1.1963 |
1.5481 |
1.1211 |
1.8144 |
|
| Minimum | -2.0992 |
-0.8410 |
-0.7343 |
-0.8938 |
-1.2004 |
-0.9084 |
-1.3647 |
|
| Range | 3.4365 |
2.1708 |
1.9776 |
2.0901 |
2.7485 |
2.0295 |
3.1791 |
|
| Std. Dev. | 0.3388 |
0.2038 |
0.1970 |
0.2035 |
0.3033 |
0.2925 |
0.4675 |
|
| Skewness | -0.3025 |
0.2195 |
0.2992 |
0.1857 |
0.3901 |
0.1390 |
0.3481 |
|
| Kurtosis | 6.1221 |
7.6875 |
7.4497 |
8.1147 |
5.5020 |
4.1451 |
4.5286 |
|
Table 6 lists the correlations of daily total return deviation with its components, i.e. pricing deviation and NAV deviation. We saw that except those of Mega and TSIT IETFs, the total return deviations of the IETFs correlated more closely with NAV deviations, indicating that the deviation may be mainly due to fund management issues, consistent with the results. Since our data contained information on seven cross-sectional IETFs over a sample period (pooled data), we regressed the total return deviation on pricing deviation and on NAV deviation separately using pooled estimation with cross-section specific coefficients to observe, for each IETF, which deviation component was more closely related to total return deviation. The results are presented in Table 7 and confirmed the results of Table 6 that except those of Mega and TSIT IETFs, the total return deviations of the IETFs was more closely related to NAV deviations.
To further investigate the determinants of total return deviations, pricing deviations and NAV deviations, we used the absolute values of the three deviations respectively as dependent variables and six potential factors as explanatory variables to see which factor could explain the deviations. The six factors were IETFs’ daily share turnover, turnover rate, market value, target return volatility, management fee rate, and a dummy variable that reflected whether the IETFs have corresponding index futures trading on the market. The dummy equals one over the whole sample period for an IETF if it has corresponding index futures trading on the market and equals 0 otherwise.
This estimation was done by pooled estimation with a feasible generalized least squares (GLS) specification on the pooled data that possessed information on seven cross-sectional IETFs over a sample period.
Table-6. Correlations of daily total return deviation with its components.
Total return deviation |
|||||||
00632R |
00664R |
00676R |
00686R |
00691R |
00705R |
00729R |
|
| Component | Yuanta |
Cathay |
Fubon |
Capital |
Mega |
TSIT |
FSITC |
| Pricing deviation | 0.471 |
0.418 |
0.548 |
0.569 |
0.820 |
0.770 |
0.416 |
| NAV deviation | 0.848 |
0.743 |
0.676 |
0.572 |
0.511 |
0.448 |
0.822 |
Table-7. Regress total return deviation on pricing deviation and on NAV deviation separately using pooled estimation with cross-section specific coefficients. Numbers in parentheses are t-statistics. One, two, and three asterisks denote significance at the 10%, 5%, and 1% level, respectively.
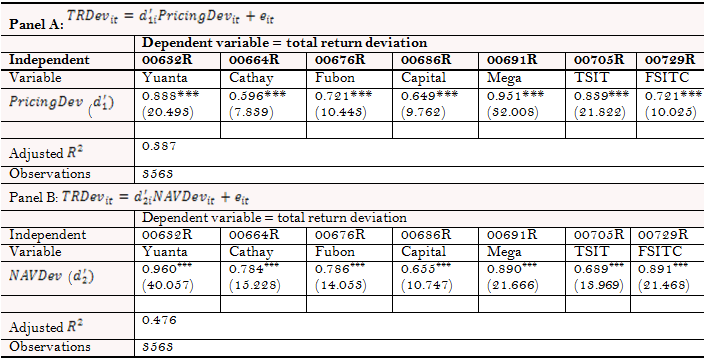
Table-8. Determinants of the total return deviation, pricing deviation and NAV deviation for the seven IETFs. Regress the absolute values of three deviations separately on six potential factors, which are IETFs’ daily share turnover, turnover rate, market value, target return volatility, management fee rate, and a dummy variable that reflects whether the IETFs have corresponding index futures trading on the market. The dummy for an IETF equals one over the whole sample period if it has corresponding index futures trading on the market and equals 0 otherwise. The specifications are estimated by pooled estimation that allows for the presence of cross-section heteroscedasticity. Numbers in parentheses are t-statistics. One, two, and three asterisks denote significance at the 10%, 5%, and 1% level, respectively.
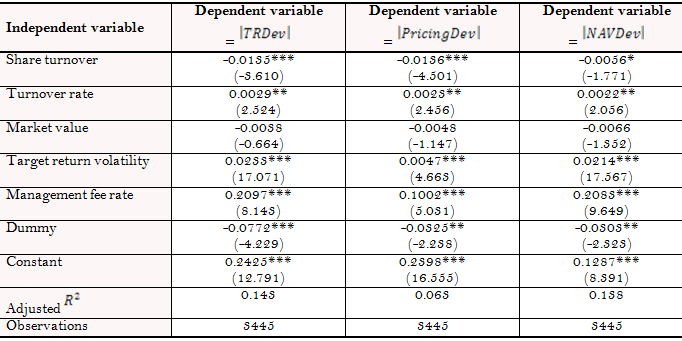
The results are presented in Table 8, and show that the pricing deviation correlated most to management fee rates, followed by target return volatility, share turnover, turnover rate, and the availability of corresponding futures the last, while NAV deviations correlated most to target return volatility, followed by management fee rates, the availability of corresponding futures, turnover rate, and share turnover the last. The total return deviations correlated most to target return volatility, followed by management fee rates, the availability of corresponding futures, share turnover, and turnover rate the last. Larger share turnover and having corresponding futures trading were conducive to the narrowing of deviations, whereas higher target return volatility and management fee rates, as well as higher turnover rates, widened the deviations. It is worth mentioning that higher management fee rates should lead to better tracking performance, but the results of this study were reversed. As for IETFs’ market value, there was no significant correlation between the IETF market value and the deviations.
6. CONCLUSIONS
With the rising volatility of Taiwanese shares, there is increasing hedging and speculating demand in this market. IETFs that aim to produce the inverse daily returns of indices on Taiwan shares provide investors and portfolio managers with flexible tools to gain inverse exposure to the market. On October 31, 2014, Taiwan had its very first IETF, Yuanta IETF, to trade on the market. Until April 2018, a total of seven IETFs traded on the market, which was a heyday. However, there is a lack of fundamental understanding of the underlying mechanism for the IETFs on Taiwan shares in the industry and in the academic literature. This paper comprehensively evaluated the tracking performance of these IETFs on Taiwan shares on the Taiwan market and tried to identify factors that may affect the tracking performance.
In terms of fund characteristics, Yuanda IETF, as the first IETF in Taiwan, had the largest market value and share turnover. FSITC IETF, though the youngest and smallest one, had the highest turnover rate among the seven IETFs. The Mega IETF appeared to have liquidity problems due to its minimum share turnover and turnover rate among the seven IETFs. Yuanta and FSITC IETFs charged the highest management fee rate, 1%, whereas Capital IETF charged the lowest rate of 0.3%. All the IETFs had corresponding futures trading in the market except Mega IETFs.
The exposure of IETFs to their benchmark, i.e. the beta estimates, and a return deviation, i.e. total return deviation, measured by the deviation of the IETF market price return from the target return were used to evaluate IETFs’ tracking performance. The total return deviation was divided into two parts: pricing deviation and NAV deviation, to determine whether it was mainly determined by market inefficiency factor or fund management issue. The beta estimation results showed that the three IETFs that target the inverse of TAIEX provided better exposure to their target index, whereas Mega and FSITC IETFs provided worse exposure to their target indices. As for the results of the daily return deviation, all the IETFs, except Mega and TSIT IETFs, seemed to have a total return deviation that correlated more closely with NAV deviation, indicating that the majority of the variation in their tracking performance may be due to the fund management issues and that that the market inefficiency factor was less influential.
As for the determinants of the deviations, the results showed that the two most powerful factors were target return volatility and management fee rates. The other three factors, the availability of corresponding futures, share turnover and turnover rate, were also significantly related to return deviations. In general, higher target return volatility and management fee rates, as well as higher turnover rates, would make the deviations larger. Share turnover and having corresponding futures trading, on the contrary, were negatively correlated with the magnitude of the deviations. The results of this study provide useful information for investors and portfolio managers when making hedging or investment decisions.
Funding: This study received no specific financial support. |
Competing Interests: The author declares that there are no conflicts of interests regarding the publication of this paper. |
REFERENCES
Charupat, N., & Miu, P. (2011). The pricing and performance of leveraged exchange-traded funds. Journal of Banking & Finance, 35(4), 966-977.
Cheng, M., & Madhavan, A. (2009). The dynamics of leveraged and inverse exchange-traded funds. Journal of Investment Management, 7(4), 43-62.
Dobi, D., & Avellaneda, M. (2012). Structural slippage of leveraged etfs. Retrieved from: http://ssrn.com/abstract=2127738 .
Erb, C. B., & Harvey, C. R. (2006). The strategic and tactical value of commodity futures. Financial Analysts Journal, 62(2), 69-97.
Henderson, B. J., & Buetow, G. W. (2014). The performance of leveraged and inverse leveraged exchange traded funds. Journal of Investment Management, 12(1), 69-92.
Hirshleifer, D. (1989). Determinants of hedging and risk premia in commodity futures markets. Journal of Financial and Quantitative Analysis, 24(3), 313-331.Available at: https://doi.org/10.2307/2330814.
Militaru, R., & Dzekounoff, D. (2010). Trading with leveraged and inverse ETFs. Futures: News, Analysis & Strategies for Futures, Options & Derivatives Traders, 39, 32-35.
Tang, H., & Xu, X. E. (2016). Tracking performance of leveraged energy exchange-traded funds. The Journal of Derivatives, 23(3), 37-60.Available at: https://doi.org/10.3905/jod.2016.23.3.037.
Trainor, J. W. J., & Baryla, J. E. A. (2008). Leveraged ETFs: A risky double that doesn't multiply by two. Journal of Financial Planning, 21(5), 48-55.Available at: https://doi.org/10.2469/dig.v39.n1.4.
Views and opinions expressed in this article are the views and opinions of the author(s), Asian Economic and Financial Review shall not be responsible or answerable for any loss, damage or liability etc. caused in relation to/arising out of the use of the content. |