


NON-PERFORMING LOANS OF COMMERCIAL BANKS IN SOUTH ASIAN COUNTRIES: ADVERSE SELECTION AND MORAL HAZARD ISSUES

1Department of Banking and Insurance, University of Dhaka, Bangladesh.
2Graduate School of Economics, Kobe University, Kobe, Japan.
ABSTRACT
In the South Asian region, a major cause of an increase in non-performing loans (NPL) is the bank’s adverse selection of borrowers. Using the GMM estimator, we empirically studied the bank-specific, industry specific and macroeconomic specific determinants of non-performing loans of banks in South Asian countries (Bangladesh, India, Nepal and Pakistan) from 1997 to 2012 and found that the adverse selection hypothesis of Stiglitz and Weiss (1981![]() ) was still effective. We found evidence for the bad luck, bad management, skimping and moral hazard hypotheses of Berger and DeYoung (1997
) was still effective. We found evidence for the bad luck, bad management, skimping and moral hazard hypotheses of Berger and DeYoung (1997![]() ) and their effect on the credit risk determination but we contributed to the literature by showing that ‘moral hazard type II’ (moral hazard between the bank management and the depositors) significantly affected the increase of non-performing loans. Bank size, industry concentration, inflation and GDP growth rate all significantly affected the sample countries’ non-performing loans. Empirical results showed a moderate degree of persistence of NPL and a late-hit of the global financial crisis in the region’s banking sector.
) and their effect on the credit risk determination but we contributed to the literature by showing that ‘moral hazard type II’ (moral hazard between the bank management and the depositors) significantly affected the increase of non-performing loans. Bank size, industry concentration, inflation and GDP growth rate all significantly affected the sample countries’ non-performing loans. Empirical results showed a moderate degree of persistence of NPL and a late-hit of the global financial crisis in the region’s banking sector.
Keywords: NPL, Cost inefficiency, Moral hazard, Moral hazard type- II, Adverse selection, Bad luck hypothesis
JEL Classification: G21; C23.
ARTICLE HISTORY: Received:17 June 2019 Revised:30 July 2019 Accepted:5 September 2019 Published:3 October 2019.
Contribution/ Originality:This study incorporates a new hypothesis of the ‘moral hazard type II’ in the existing literature of credit risk and evidence in how moral hazard type II and the adverse selection problems along with other bank specific and macroeconomic specific variables significantly affect the non-performing loans of the commercial banks.
1. INTRODUCTION
Banking business depicts the two-way relationship between the banking firm (i) and the borrowers (Q) where the cash flow (y) of each of the economic agents, from their individual lending and borrowing operation have a mutual effect. Prolonged existence of non-performing loans (NPL) in the bank balance sheet causes the bank severe management problems as it not only deteriorates the asset quality of the bank but also reduces its earnings and moral hazard problems between the bank and its funding channels mostly attributed to the depositors. On the other hand, high levels of NPL in the economy also signal the bankruptcy possibilities of the borrowers as the borrowers differ by risk parameter (ϴ) which is privately observed and come to the bank with same level of collateral (C) that can therefore not be used as good collateral (Stiglitz and Weiss, 1981![]() ) and thus result in the worsening of banker-customer relationship and economic conditions of a country.
) and thus result in the worsening of banker-customer relationship and economic conditions of a country.
Due to rapid globalization and financial liberalization, the role of banks in the economic development of a country has increased massively. But the problems of non-performing loans saddle a bank and cause the prolonged economic stagnation of a country or even a global financial crisis. Reinhart and Rogoff (2009![]() ) pointed out that NPL can be used as the signal of a banking crisis. Hence, the research in this field of the problems and the determinants of non-performing loans of banks remains equally important to the academics and the researchers in present and as it were in the past. Understanding the factors causing the increase in NPLs and resolving those is important to the bank management and the regulatory bodies in order to let the bank function and to rehabilitate the economy.
) pointed out that NPL can be used as the signal of a banking crisis. Hence, the research in this field of the problems and the determinants of non-performing loans of banks remains equally important to the academics and the researchers in present and as it were in the past. Understanding the factors causing the increase in NPLs and resolving those is important to the bank management and the regulatory bodies in order to let the bank function and to rehabilitate the economy.
Over the past decades, most of the research on the determinants of non-performing loans viewed NPLs as the functions of macroeconomic and bank specific determinants. Macroeconomic views of the determinants of NPL focused primarily on the macro-prudential factors. Fundamentals of the theoretical relationships between the NPL and the macroeconomic factors can be found in the Bernanke et al. (1998![]() ) framework of ‘financial acceleration’ and its later expansion by Gertler and Kyotaki (2011
) framework of ‘financial acceleration’ and its later expansion by Gertler and Kyotaki (2011![]() ) where the credit market is pro-cyclical and the role of asymmetric information and frictions affect the credit market. Rinaldi and Sanchis-Arellano (2006
) where the credit market is pro-cyclical and the role of asymmetric information and frictions affect the credit market. Rinaldi and Sanchis-Arellano (2006![]() ) found household disposable income; unemployment and monetary conditions had a strong relationship with non-performing loans in banking in the European Union.
) found household disposable income; unemployment and monetary conditions had a strong relationship with non-performing loans in banking in the European Union.
Literature of the microeconomic determinants of non-performing loans emphasizes on the bank-specific factors. Berger and DeYoung (1997![]() ) analyzed the Granger-causality relationship between the NPLs and their so called ‘bad luck’, ‘bad management’, ‘skimping’ and ‘moral hazard, where the empirical variables were cost efficiency and the capital adequacy. Among others, Williams (2004
) analyzed the Granger-causality relationship between the NPLs and their so called ‘bad luck’, ‘bad management’, ‘skimping’ and ‘moral hazard, where the empirical variables were cost efficiency and the capital adequacy. Among others, Williams (2004![]() ) followed the Berger and DeYoung hypotheses and came out with the same kind of relationship in European banking.
) followed the Berger and DeYoung hypotheses and came out with the same kind of relationship in European banking.
Salas and Saurina (2002![]() ) studies of Spanish banking from 1985 to 1997, found that along with macroeconomic factors the bank specific variables also explained the future changes in NPLs of banks. Similar strand of literature include Louzis et al. (2012
) studies of Spanish banking from 1985 to 1997, found that along with macroeconomic factors the bank specific variables also explained the future changes in NPLs of banks. Similar strand of literature include Louzis et al. (2012![]() ) who studied the determinants of NPL in Greek banking. However, no single study was safe from criticism due to an insufficient selection of variables or failure to implement the appropriate econometric methodology (Athanasoglou et al., 2008
) who studied the determinants of NPL in Greek banking. However, no single study was safe from criticism due to an insufficient selection of variables or failure to implement the appropriate econometric methodology (Athanasoglou et al., 2008![]() ).
).
We studied the determinants of bank non-performing loans as a function of macroeconomic factors, industry specific factors and the bank specific factors using the Generalized Methods of Moments (GMM) estimator for the panel data of 259 banks in South Asian countries (Bangladesh, India, Nepal and Pakistan) from 1997 to 2012.
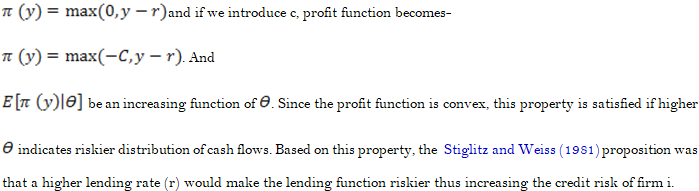
This paper will be interesting to researchers, readers, management personnel and the policy makers as we showed that the ‘adverse selection’ of borrowers by the bank in case of credit selection causes an increase in non-performing loans. We found that the individual bank’s lending rate positively affected the bad loan ratio but not the macroeconomic policy rates. By charging higher rates, banks ignored the safer borrowers who could not afford the rates and attracted the borrowers whose business types were high-risk with high-return which was more likely to result in an increase in non-performing loans.
This study empirically showed that in addition to the Berger and DeYoung (1997![]() ) ‘moral hazard’ hypothesis between the shareholders and the bank management; another ‘moral hazard type II’ between the depositors and the bank management also affected the credit quality of a bank. We showed that when a bank had excess liquidity, its management felt the cost of liquidity burden and disbursed loans and advances without proper screening and ultimately increased the volume of non-performing loans. In other words, depositors, as a third party, could not monitor the cost of excess liquidity but faced the moral hazard problems as a result of bad loan contracts.
) ‘moral hazard’ hypothesis between the shareholders and the bank management; another ‘moral hazard type II’ between the depositors and the bank management also affected the credit quality of a bank. We showed that when a bank had excess liquidity, its management felt the cost of liquidity burden and disbursed loans and advances without proper screening and ultimately increased the volume of non-performing loans. In other words, depositors, as a third party, could not monitor the cost of excess liquidity but faced the moral hazard problems as a result of bad loan contracts.
The sample selection for this study was also notable as most of our sample countries (Bangladesh, India and Pakistan) were under British rule for around two hundred years. We had the opportunity to study those countries’ banking systems together considering similar regulatory, social and economic environments. We recently found similar studies on developed and developing countries of America, Europe, and Asia but since this study focused on South Asia; it is a unique addition to the literature of the determinants of bank non-performing loans.
The rest of the paper is organized as follows: in section 2, we present relevant literature on the determinants of bank non-performing loans. In section 3 we present the empirical approach of our study and in section 4 the sample description has been outlined. In section 5 we present the result and finally in section 6 we present the conclusion and policy implications of our study.
2. THE LITERATURE OF THE DETERMINANTS OF NON-PERFORMING LOANS
Past literature viewed the determinants of bank non-performing loans (NPL) as a function of bank specific and macroeconomic factors. The bank specific factors may be termed as the microeconomic variables and can be directly found in the financial statements of a bank. On the other hand, the macroeconomic variables are the overall economic, regulatory and legal environment within which a bank operates its business. An extensive literature review found that the three streams of literature on the determinants of non-performing loans are the macroeconomic stream, the microeconomic stream and the synthesis of both the macro and microeconomic streams.
According to Stiglitz and Weiss (1981![]() ) the adverse selection of borrowers (Q) by the lending firm (bank, i) is one of the prime causes of higher credit risk. Q differs by a risk parameter (ϴ) which is privately observed. The bank can determine the statistical distribution of ϴ among the population of potential borrowers as all firms are assumed to bring the same amount of collateral (C) which can therefore not be used as a screening device. As it cannot observe ϴ, i cannot discriminate among firms and offer same standard debt contract in which Q have to repay amount (R) at a fixed rate (r) (if Q can) or their C will be seized by i.
) the adverse selection of borrowers (Q) by the lending firm (bank, i) is one of the prime causes of higher credit risk. Q differs by a risk parameter (ϴ) which is privately observed. The bank can determine the statistical distribution of ϴ among the population of potential borrowers as all firms are assumed to bring the same amount of collateral (C) which can therefore not be used as a screening device. As it cannot observe ϴ, i cannot discriminate among firms and offer same standard debt contract in which Q have to repay amount (R) at a fixed rate (r) (if Q can) or their C will be seized by i.
Concerning unsecured loans, each of the borrowers (q) will obtain a profit (π) that is related to its cash flow (y) by the expression:
Studies on the macroeconomic determinants of non-performing loans focused on external events such as the overall macroeconomic conditions, which are likely to affect the borrowers’ capacity to repay their loans. The classical literature studying the interactions between the macroeconomic environment and financial fundamentals includes the models developed by Bernanke and Gertler (1989![]() ); Kyotaki and Moore (1997
); Kyotaki and Moore (1997![]() ); Bernanke et al. (1998
); Bernanke et al. (1998![]() ) and Gertler and Kyotaki (2011
) and Gertler and Kyotaki (2011![]() ). Bernanke et al. (1998
). Bernanke et al. (1998![]() ) developed the framework of ‘financial accelerator’ where the credit markets are pro-cyclical and the role of asymmetric information between the borrowers and lenders affected the credit market shocks whereas Kyotaki and Moore (1997
) developed the framework of ‘financial accelerator’ where the credit markets are pro-cyclical and the role of asymmetric information between the borrowers and lenders affected the credit market shocks whereas Kyotaki and Moore (1997![]() ) and Gertler and Kyotaki (2011
) and Gertler and Kyotaki (2011![]() ) models allowed business cycle fluctuations and the role of frictions in case of credit market imperfections, respectively.
) models allowed business cycle fluctuations and the role of frictions in case of credit market imperfections, respectively.
Rinaldi and Sanchis-Arellano (2006![]() ) studied the macroeconomic determinants of the non-performing loans of seven European Union countries and found strong relationships between the credit risk and the household disposable income, rate of unemployment and the monetary conditions of a country. Ali and Daly (2010
) studied the macroeconomic determinants of the non-performing loans of seven European Union countries and found strong relationships between the credit risk and the household disposable income, rate of unemployment and the monetary conditions of a country. Ali and Daly (2010![]() ) found that the same set of macroeconomic conditions affects the default rates of Australia and the US banking differently but that the latter one was found to be more sensitive to the conditions. The problem of NPLs was found to be positive to the increase in the nominal interest rates and the number of bankruptcies and negative to the higher CPI inflation, economic growth and property price inflation in Hong Kong, according to the studies of Shu (2002
) found that the same set of macroeconomic conditions affects the default rates of Australia and the US banking differently but that the latter one was found to be more sensitive to the conditions. The problem of NPLs was found to be positive to the increase in the nominal interest rates and the number of bankruptcies and negative to the higher CPI inflation, economic growth and property price inflation in Hong Kong, according to the studies of Shu (2002![]() ).
).
Bohachova (2008![]() ) found the pro-cyclical nature of default risk where the banks accumulate risks more rapidly in economically good times and that some of these risks materialized as asset quality deterioration during recessions in the OECD countries. In the same line, Nkusu (2011
) found the pro-cyclical nature of default risk where the banks accumulate risks more rapidly in economically good times and that some of these risks materialized as asset quality deterioration during recessions in the OECD countries. In the same line, Nkusu (2011![]() ) empirically studied the panel of 26 advanced economies and found that macroeconomic vulnerabilities deteriorated the credit portfolios of banks. Espinoza and Prasad (2010
) empirically studied the panel of 26 advanced economies and found that macroeconomic vulnerabilities deteriorated the credit portfolios of banks. Espinoza and Prasad (2010![]() ) in their dynamic panel estimates from 1995 to 2008 in GCC countries showed the persistence of non-performing loans and the inverse relationship with economic growth and the interest rates. Castro (2013
) in their dynamic panel estimates from 1995 to 2008 in GCC countries showed the persistence of non-performing loans and the inverse relationship with economic growth and the interest rates. Castro (2013![]() ) used the dynamic panel data approach to study the macroeconomic determinants of credit risk in Greece, Ireland, Portugal, Spain and Italy (GIPSI) and found that credit risk is negatively affected by the GDP growth rate and the share and housing price indices but positively affected by the unemployment rate, interest rate, credit growth and an appreciation of the real exchange rate. Skarica (2014
) used the dynamic panel data approach to study the macroeconomic determinants of credit risk in Greece, Ireland, Portugal, Spain and Italy (GIPSI) and found that credit risk is negatively affected by the GDP growth rate and the share and housing price indices but positively affected by the unemployment rate, interest rate, credit growth and an appreciation of the real exchange rate. Skarica (2014![]() ) found the primary cause of high levels of NPL is the economic slowdown and deterioration in the state of employment and inflation in the seven central and Eastern European countries from Q:3 2007 to Q:3 2012.
) found the primary cause of high levels of NPL is the economic slowdown and deterioration in the state of employment and inflation in the seven central and Eastern European countries from Q:3 2007 to Q:3 2012.
The literature on microeconomic determinants of non-performing loans focused more on the variability of NPL across banks being attributed to bank level factors. Berger and DeYoung (1997![]() ) found the four mutually non-exclusive two-way causalities over the default risk in their studies of the US commercial banks from 1985 to 1994. They found that ‘bad luck’, ‘bad management’, ‘skimping’ and ‘moral hazard’ could affect the same bank at the same time. They argued that, bad luck could befall a poorly managed bank that also happened to be skimping on loan monitoring costs and for any loss of capital due to these factors, banks responded to moral hazard incentives and took increased risks. Williams (2004
) found the four mutually non-exclusive two-way causalities over the default risk in their studies of the US commercial banks from 1985 to 1994. They found that ‘bad luck’, ‘bad management’, ‘skimping’ and ‘moral hazard’ could affect the same bank at the same time. They argued that, bad luck could befall a poorly managed bank that also happened to be skimping on loan monitoring costs and for any loss of capital due to these factors, banks responded to moral hazard incentives and took increased risks. Williams (2004![]() ); Podpiera and Weill (2008
); Podpiera and Weill (2008![]() ) and Louzis et al. (2012
) and Louzis et al. (2012![]() )’ studies followed the Berger and DeYoung (1997
)’ studies followed the Berger and DeYoung (1997![]() ) hypotheses and came out with the same kind of results for the European savings banks, Czech banks and Greek banking sectors for different time periods, respectively.
) hypotheses and came out with the same kind of results for the European savings banks, Czech banks and Greek banking sectors for different time periods, respectively.
Keeton and Morris (1987![]() ) found that banks taking higher risk including in the form of excess lending eventually incurred greater losses. In a comparative study of the credit risk determinants of banks in the developed and the emerging economies, Ahmad and Ariff (2007
) found that banks taking higher risk including in the form of excess lending eventually incurred greater losses. In a comparative study of the credit risk determinants of banks in the developed and the emerging economies, Ahmad and Ariff (2007![]() ) found that regulatory capital and the management quality significantly determined banks’ credit portfolios.
) found that regulatory capital and the management quality significantly determined banks’ credit portfolios.
With the synthesis of both macroeconomic and the microeconomic determinants of non-performing loans, Salas and Saurina (2002![]() ) used the GMM estimation technique for the panel data from 1985 to 1997 of Spanish commercial and savings banks and found that the GDP growth rate, firm and family indebtedness, rapid past credit or branch expansion, inefficiency, portfolio composition, size, net interest margins, capital ratio and the market power significantly affect the credit risk of a bank. In a similar kind of study, Louzis et al. (2012
) used the GMM estimation technique for the panel data from 1985 to 1997 of Spanish commercial and savings banks and found that the GDP growth rate, firm and family indebtedness, rapid past credit or branch expansion, inefficiency, portfolio composition, size, net interest margins, capital ratio and the market power significantly affect the credit risk of a bank. In a similar kind of study, Louzis et al. (2012![]() ) found that along with the GDP growth rate and unemployment rate, inefficiency and performance indicators also explained the credit problems of Greek banking sector. Rajan and Dhal (2003
) found that along with the GDP growth rate and unemployment rate, inefficiency and performance indicators also explained the credit problems of Greek banking sector. Rajan and Dhal (2003![]() ) found that the terms of credit and macroeconomic and business conditions affected the NPLs in Indian banking. Festić et al. (2011
) found that the terms of credit and macroeconomic and business conditions affected the NPLs in Indian banking. Festić et al. (2011![]() ) studied five EU countries (Bulgaria, Romania, Estonia, Latvia and Lithuania) and found that macroeconomic slowdown and skimping on loan supervision contribute to the deterioration of credit quality.
) studied five EU countries (Bulgaria, Romania, Estonia, Latvia and Lithuania) and found that macroeconomic slowdown and skimping on loan supervision contribute to the deterioration of credit quality.
Among others Zribi and Boujelbegrave (2011![]() ) concluded that the macro prudential policies and the regulatory capital and ownership structure significantly affected the NPL of Tunisian banks. Chaibi and Ftiti (2015
) concluded that the macro prudential policies and the regulatory capital and ownership structure significantly affected the NPL of Tunisian banks. Chaibi and Ftiti (2015![]() ) studied the French and German banking sector and found a set of macroeconomic variables like the GDP growth, interest rate, unemployment and exchange rate along with the bank specific variables like loan loss provisions, inefficiency and the firm size affected the non-performing loans ratio of the banks.
) studied the French and German banking sector and found a set of macroeconomic variables like the GDP growth, interest rate, unemployment and exchange rate along with the bank specific variables like loan loss provisions, inefficiency and the firm size affected the non-performing loans ratio of the banks.
This study focused on the synthesis of the macroeconomic and the bank specific determinants of non-performing loans of banks in South Asian countries. We contributed to the literature of the determinants of non-performing loans by empirically showing that instead of macroeconomic policy rates, the individual bank’s lending rate and the information asymmetry between the depositors and the bank is prominently what determines the NPL. In this study, the panel data of 259 commercial banks from 1997 to 2012 is a relatively large sample that we studied empirically to allow for better insight into the factors determining the banking credit risk.
3. EMPIRICAL APPROACH OF THE DETERMINANTS OF NON-PERFORMING LOANS STUDY
3.1. Econometric Model
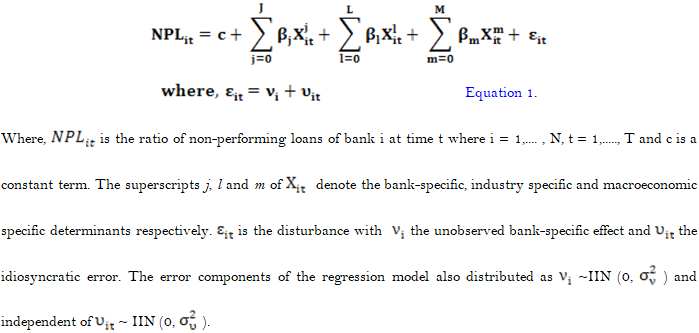
We viewed the determinants of non-performing loans (NPL) of banks as the function of bank-specific, industry specific and the macroeconomic specific variables and the general model to be estimated was of the following linear form:
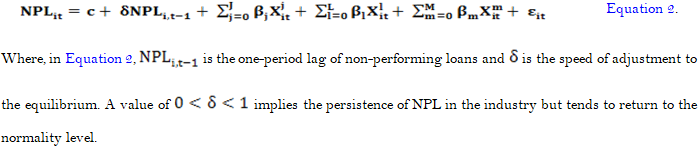
We adopted a dynamic specification of a model that included a lagged dependent variable in the right hand side among the regressors to account for the time persistence in the NPL structure following the recent literature in panel data studies (see, (Salas and Saurina, 2002![]() ; Louzis et al., 2012
; Louzis et al., 2012![]() )). The dynamic specification model of the determinants of non-performing loan is:
)). The dynamic specification model of the determinants of non-performing loan is:
The literature usually applied the fixed effects (FE) or the random effects (RE) modeling for static type of relationships but for dynamic relationships these models produce biased (especially when time dimension T gets smaller) and inconsistent estimates (see Baltagi (2001![]() )). Thus we preceded with the following five step issues for the econometric model of NPL determinants.
)). Thus we preceded with the following five step issues for the econometric model of NPL determinants.
First, we tested our data for non- stationarity using the Fisher test which does not require a panel to be balanced. This test is a question when the use of a relatively large T in a model of non-performing loans may be criticized on grounds of non-stationarity. The null of non-stationarity was rejected at the 1% level at every level.
Second, we examined whether the individual effects were fixed or random. The relevant Hausman test for Equation 1, confirmed the evidence in favor of a FE modeling1 . The estimation result also confirmed the existence of the individual effect since the F-statistics were significant (F (126, 687) =15.11, Probability> F = 0.0000). However, the least square (within) estimator of the FE model in the presence of a lagged dependent variable among regressors was both biased and inconsistent2 .
Third, we proceeded with the estimation of our model using the one step generalized methods of moments (GMM) estimator of Arellano and Bond (1991![]() ) paradigm which suggested that consistency and efficiency gains could be obtained by using all available lagged values of the dependent variable along with the exogenous regressors as instruments.
) paradigm which suggested that consistency and efficiency gains could be obtained by using all available lagged values of the dependent variable along with the exogenous regressors as instruments.
Fourth, we dealt with the problem of endogeneity with estimation of bank non-performing loan. The question was whether the capital variable (E/TA) was endogenous or not. To confirm this, we ran the same model twice. The first time we treated capital variable as strictly exogenous and the second time as endogenous. The Sargan test 3 for over-identifying restrictions indicated that no endogeneity assumption was valid for the capital variable in NPL modeling and we treated the capital variable as strictly exogenous.
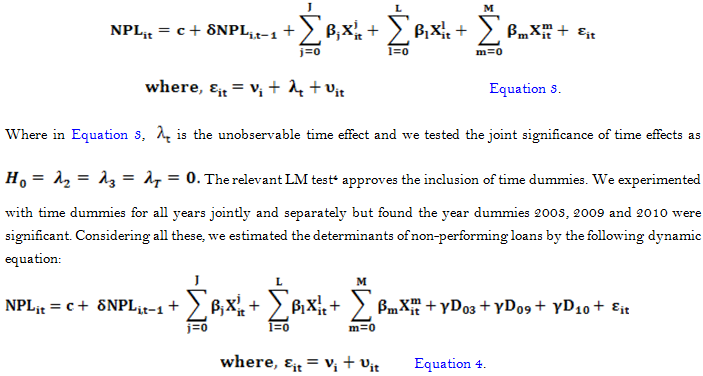
Finally, we addressed the unobserved time effects in the error components of our model as follows:
3.2. Empirical Determinants of Non-Performing Loans of Banks
For this empirical study of the econometric model of the determinants of non-performing loan developed in section 3.1, we used 3 categories of proxy variables namely (a) firm specific, (b) industry specific and (c) macroeconomic specific and Table 1 has a summary of these variables.
3.2.1. The Dependent Variables
Non-performing loan ratio: We used the ratio of nonperforming loans to total loans (NPL/TL) as the dependent variable in our model. By non-performing loans, we mean the volume of impaired loans and by definition, a loan is impaired when, based on current information and events, it is probable that a creditor will be unable to collect all amounts due to the contractual terms of the loan agreement (see FASB (Financial Accounting Standards Board) (2008![]() )). Alternatively, this ratio has been used to proxy the credit risk measures in many of the previous studies (see (Castro, 2013
)). Alternatively, this ratio has been used to proxy the credit risk measures in many of the previous studies (see (Castro, 2013![]() ; Imbierowicz and Rauch, 2014
; Imbierowicz and Rauch, 2014![]() )).
)).
3.2.2. The Explanatory Variables
- Bank-Specific Explanatory Variables
- Return on Assets
We used the return on average assets (ROA) as the proxy for the bank performance which negatively influences the levels of non-performing loans of a bank. Past performance can reflect the high quality of management (Louzis et al., 2012![]() ) leading to a low level of NPL.
) leading to a low level of NPL.
Table-1. Description of variables used in the study of non-performing loans of banks.
| Variables | Notation | Description | Expected effect |
| Dependent variables | |||
| Non-performing loan ratio | NPL/TL | Non-performing loan (%) over total loan is a proxy variable for credit quality or credit risk exposed to a bank | |
| Independent variables | |||
| (a). Bank-specific variables | |||
| Return on average assets | ROAA | Net income over average total assets (%) | - |
| i. Equity to total assets ratio | E/TA | Equity to total assets ratio (%) is a measure of capital adequacy of respective bank | - |
| ii. Cost to income ratio | C/TI | Total cost over total revenue (%) | - |
| iii. Bank size | ln(TA) | Natural logarithm of total assets of a bank | - |
| iv. Off-balance sheet income ratio | NNII/TA | Net non-interest income over total assets (%) | - |
| v. Liquidity ratio | LA/D&STF | Liquid asset to total deposits and short term funding ratio (%) express the liquidity position of a bank | - |
| vi. Growth of total loan | GTL | Annual growth rate (%) of loan | - |
| vii. Interest income to Total loan ratio | i | Total interest income over total loan (%) | + |
| (b). Industry-specific variables | |||
| viii. Concentration ratio | CR3 | Sum of total assets of largest three banks over that of the industry | - |
| (c). Macroeconomic-specific variables | |||
| ix. Standard deviation of short term interest rate | SDint | Annualized standard deviation of monthly average of daily call money rates | + |
| x. Term spread of interest rate | R | Difference between the yields spread of 10 year and 5 year Treasury bonds, R (%) | + |
| xi. Rate of inflation | %Inf | Annual rate of inflation (%) | - |
| xii. Economic growth rate | %GDP | Real economic growth rate as a % change in GDP | - |
- Equity to Total Assets Ratio
The ratio of equity to total assets measures the capitalization strength of a bank considering the regulatory requirements regarding the minimum equity holdings. We anticipated the impact of this variable on a bank’s non-performing loan to be negative as low financial capital would cause an increase in non-performing loans (Berger and DeYoung, 1997![]() ). To address the ‘moral hazard’ hypothesis: as a third party is bearing the risk of the excessive risk taking cost of another party but cannot easily be charged for or prevent that risk taking behavior of the bank, we expected that the equity to total assets ratio would significantly affect the bank’s non-performing loan ratio.
). To address the ‘moral hazard’ hypothesis: as a third party is bearing the risk of the excessive risk taking cost of another party but cannot easily be charged for or prevent that risk taking behavior of the bank, we expected that the equity to total assets ratio would significantly affect the bank’s non-performing loan ratio.
- Cost to Income Ratio
The cost to total income ratio was the proxy for inefficiency variable and we expected to see a statistically significant and negative relationship to the non-performing loans. Berger and DeYoung (1997![]() ) examined different inter-temporal relationships of this measured cost efficiency/inefficiency and those subsequently affected the non-performing loan of a bank. In their so called ‘bad luck’ hypothesis, increases in problem loans due to exogenous effects preceded the decreases in measured cost efficiency whereas the ‘bad management’ hypothesis had the opposite temporal order where low measured cost efficiency occurred before an increase in problem loans. On the other hand, according to their ‘skimping’ hypothesis, when the management chose short-term cost efficiency in exchange for long-term profitability there was an increase in the non-performing loans in their balance sheet.
) examined different inter-temporal relationships of this measured cost efficiency/inefficiency and those subsequently affected the non-performing loan of a bank. In their so called ‘bad luck’ hypothesis, increases in problem loans due to exogenous effects preceded the decreases in measured cost efficiency whereas the ‘bad management’ hypothesis had the opposite temporal order where low measured cost efficiency occurred before an increase in problem loans. On the other hand, according to their ‘skimping’ hypothesis, when the management chose short-term cost efficiency in exchange for long-term profitability there was an increase in the non-performing loans in their balance sheet.
- Bank Size
Bank size was measured in terms of natural logarithm of a bank’s total assets and we assumed that the predictive capacity of this variable was negative over NPL under the ‘diversification’ hypothesis where the theoretical argument that larger banks are mostly diversified to manage their loan portfolio and ‘bad’ borrowers (Zribi and Boujelbegrave, 2011![]() ).
).
- Off-Balance Sheet Income
Banking business has been diversified for many years now. Following Louzis et al. (2012![]() ) we examined the effect of off-balance sheet income on NPL and expected a statistically significant negative relationship. The net non-interest income (non interest expense less non-interest income) over total assets (NNII/TA) was taken as the proxy for the off-balance sheet income and we expected a positive impact of this variable on non-performing loans.
) we examined the effect of off-balance sheet income on NPL and expected a statistically significant negative relationship. The net non-interest income (non interest expense less non-interest income) over total assets (NNII/TA) was taken as the proxy for the off-balance sheet income and we expected a positive impact of this variable on non-performing loans.
- Liquidity Ratio
A higher liquidity ratio reduces the liquidity risk of a bank and fosters the ability of the management for loan servicing and monitoring that results in lower levels of non-performing loans. On the other hand, excess liquidity is a good proxy of moral hazard problems between the bank management and the depositors because they cannot monitor and make the management bound for effective use of the funds. We calculated the liquidity ratio (LA/D&STF) as the liquid assets of a bank over the deposits and short-term funding in percentage form and expected a statistically significant and inverse relationship with non-performing loans.
- Growth Rate of Total Loan
One of the fundamentals of bank management is loan management which is directly related to the quality control of the credit disburse. By increasing the volume of loans, management may try to offset or reduce the ratio of non-performing loans to total loans. We expected that the growth of total loans would significantly reduce the non-performing loan ratio of a bank.
- Interest Income to Total Loan Ratio
We introduced the ratio of interest income to total loan as the proxy for the adverse selection of borrowers by the bank. We argued that higher individual bank lending rate would invite the risky borrowers whose business type is high risk- high return because the safer customers may not be able to afford the higher cost of loans. In that sense, we assumed that the adverse selection of borrowers by the bank is one of the main causes of increases in non-performing loans. We also compared the predictive nature of the individual lending rate and the macroeconomic policy rates. Our hypothesis was that the higher the lending rate; the higher the default risk as such a rate deteriorates the borrowers’ ability and the willingness to repay the loan.
- Industry-Specific Variables
- Concentration Ratio
The concentration ratio (CR3) was the proxy variable for the market concentration and its impact on bank non-performing loan in our empirical study. This is a common and widely used measure of market concentration where higher concentration means lower competition and vice versa and it is calculated as the ratio of the sum of total assets of the largest three (3) banks to that of the industry. According to the structure-conduct-performance (SCP) hypothesis, banks in highly concentrated markets earn monopoly rents, because they tend to collude (Gilbert, 1984![]() ) and thus deteriorate the market competition. We expected the negative influence of a higher concentration on NPL because in the absence of a perfectly competitive market scenario, borrowers may feel reluctant to repay the loans.
) and thus deteriorate the market competition. We expected the negative influence of a higher concentration on NPL because in the absence of a perfectly competitive market scenario, borrowers may feel reluctant to repay the loans.
- Macroeconomic-Specific Variables
- Standard Deviation of Short-Term Interest Rate
As the proxy for the short-term lending rate, we used the annualized standard deviation of monthly average of the daily called money rates (SDint) and expected the positive relationship with the non-performing loan ratio of a bank.
- Term Spread of Interest Rate
The term spread of interest rate was the proxy variable for the long-term interest rate in our present study. We used the difference of yield spread of ten year and five year treasury bonds as the proxy of term structure of interest rate (R) and its impact on the bank non-performing loan ratio. Previous literature (see (Nkusu, 2011![]() ; Castro, 2013
; Castro, 2013![]() )) emphasized the impact of the long-term interest rate on the bank’s problematic loans. An increase in the lending rate simultaneously weakens the debt servicing capabilities of a borrower hence we expected a positive relationship with the NPL.
)) emphasized the impact of the long-term interest rate on the bank’s problematic loans. An increase in the lending rate simultaneously weakens the debt servicing capabilities of a borrower hence we expected a positive relationship with the NPL.
- GDP Growth Rate
The stable Gross domestic product (GDP) growth rate represents the stability of an economy and thus affected the demand and supply of loans and deposits directly. GDP growth ensures the stability of the economy and in that stable economic environment a borrowers’ business risk reduces significantly and increases the ability of debt servicing (Salas and Saurina, 2002![]() ). We expected a statistically significant inverse relationship with GDP growth and the non-performing loans of a bank.
). We expected a statistically significant inverse relationship with GDP growth and the non-performing loans of a bank.
- Rate of Inflation
The effect of inflation on the non-performing loan ratio of a bank was not deterministic in the past literature. Theoretically, inflation should reduce the real value of debt and hence make debt servicing easier but also high inflation may pass through to nominal interest rates, reducing borrowers’ loan servicing capacity (Skarica, 2014![]() ). Although Rinaldi and Sanchis-Arellano (2006
). Although Rinaldi and Sanchis-Arellano (2006![]() ) reported a positive relationship, following Shu (2002
) reported a positive relationship, following Shu (2002![]() ) we expected inflation and NPL would have a statistically significant inverse relationship.
) we expected inflation and NPL would have a statistically significant inverse relationship.
4. SAMPLE AND DATA
In this research of the determinants of the non-performing loans of banks, we studied the unbalanced panel of 2595 South Asian banks from 1997 to 2012. By banks, we mean the financial intermediaries who take deposits and provide loans and advances in the ordinary course of business. We excluded the data of Islamic banks from our sample as in India and Nepal there was little or no Islamic banking operation. For our analyses, we collected data from various sources. The dependent variable and the bank specific explanatory variables were collected from the Bureau Van Dijk’s Bank Scope database (Bank Scope, 2013![]() ) using the universal model of banking database. We took the primary data set from the Bank Scope but then calculated the concentration ratio (CR3) which we used as the industry specific explanatory variables. For macroeconomic specific variables, we collected data from two sources. We collected the data of short-term money market rates 6 and the term spread of interest rate7 from the each country’s central bank website. From International Financial Statistics (IFS) database (International Financial Statistics (IFS), 2014
) using the universal model of banking database. We took the primary data set from the Bank Scope but then calculated the concentration ratio (CR3) which we used as the industry specific explanatory variables. For macroeconomic specific variables, we collected data from two sources. We collected the data of short-term money market rates 6 and the term spread of interest rate7 from the each country’s central bank website. From International Financial Statistics (IFS) database (International Financial Statistics (IFS), 2014![]() ) we collected the yearly data of the rate of inflation and the growth rate of gross domestic product (GDP). Table 2 presents the descriptive statistics of the empirical variables used in the present study. As we see in South Asia, the non-performing loan to total loan ratio was quite high (more than 8%) in the studied period. Among other key indicators, ROA was around 1% and the cost to income ratio was more than 61%. The average equity to capital ratio was around 10% and the liquid assets to the deposit and short term funding 19.71% indicated the quiet level of solvency of the South Asian banks. The average rate of inflation was slightly higher than 7% and the South Asian nations’ GDP grew more than 6% on an average during the period.
) we collected the yearly data of the rate of inflation and the growth rate of gross domestic product (GDP). Table 2 presents the descriptive statistics of the empirical variables used in the present study. As we see in South Asia, the non-performing loan to total loan ratio was quite high (more than 8%) in the studied period. Among other key indicators, ROA was around 1% and the cost to income ratio was more than 61%. The average equity to capital ratio was around 10% and the liquid assets to the deposit and short term funding 19.71% indicated the quiet level of solvency of the South Asian banks. The average rate of inflation was slightly higher than 7% and the South Asian nations’ GDP grew more than 6% on an average during the period.
Table-2. Descriptive statistics of the variables of non-performing loans model.
| Variables | Mean |
Median |
Standard deviation |
| Dependent variable | |||
| Non-performing loan ratio (NPL/TL) | 8.3432 |
4.2800 |
10.4056 |
| Independent variables | |||
| Bank specific | |||
| Return on average assets (ROAA) | 0.9950 |
1.1450 |
3.3746 |
| Equity to total asset ratio (E/TA) | 9.9883 |
7.0900 |
12.3831 |
| Cost to income ratio (C/TI) | 61.2300 |
48.5100 |
53.5445 |
| Size (lnTA) | 7.1870 |
7.1253 |
2.0547 |
| Net non-interest income ratio (NNII/TA) | 0.8788 |
0.6945 |
3.3148 |
| Liquidity ratio (LA/D&STF) | 19.7128 |
14.4250 |
28.8512 |
| Growth rate of total loan (GTL) | 26.7537 |
19.7450 |
46.5776 |
| Interest income to total loan ratio (i) | 12.4542 |
10.5900 |
19.9496 |
| Industry specific | |||
| Concentration ratio (CR3) | 0.5598 |
0.5412 |
0.1798 |
| Macroeconomics specific | |||
| Short term interest rate (Sdint) | 1.3430 |
0.9992 |
1.1464 |
| Term spread of interest rate (R) | 1.0741 |
0.6000 |
1.2237 |
| GDP growth rate | 6.1365 |
6.1800 |
2.2592 |
| Rate of inflation | 7.0261 |
6.3700 |
3.4116 |
Source: Stata output/authors’.
5. EMPIRICAL RESULTS
5.1. The Baseline Result
Table 3 presents the GMM regression output of Equation 4 of the determinants of non-performing loans (NPL) of the banks in South Asia from 1997 to 2012. The first column of the table presents the name of the dependent and the deterministic variables including bank specific, industry specific and macroeconomic specific variables while each column of model 1, model 2 and model 3 presents the coefficient and standard error respectively.
The Wald-test confirmed the fine goodness of fit of our panel data set and the Sargan-test showed no evidence of over-identifying restrictions. According to the results of the AB (AR1) test a negative first order autocorrelation existed but did not imply the inconsistency of the estimates. Inconsistency would be implied if there was second-order autocorrelation (Arellano and Bond, 1991![]() ) but this was rejected by the AB (AR2) test subsequently.
) but this was rejected by the AB (AR2) test subsequently.
Table-3. Determinants of non-performing loan (NPL) of banks in South Asia, 1997-2012, total sample.
| Variables | Model1 |
Model2 |
Model3 |
|||
| Dependent variable: Non-performing loan ratio (NPL/TL) | Coeff. |
S.E. |
Coeff. |
S.E. |
Coeff. |
S.E. |
| Independent variables | ||||||
| Bank specific | ||||||
| One period lagged NPL/TL | .38604*** |
0.03275 |
.38268*** |
0.03312 |
.2555*** |
0.04235 |
| Return on asset (ROA) | -.89498*** |
0.08190 |
-.89981*** |
0.08228 |
-.85744*** |
0.08573 |
| Equity to total asset ratio (E/TA) | -.22691*** |
0.04090 |
-.22004*** |
0.04128 |
-.25058*** |
0.04735 |
| Cost to income ratio (C/TI) | -.00558* |
0.00300 |
-.00548* |
0.00301 |
-0.00445 |
0.00310 |
| Size (lnTA) | -2.588*** |
0.27484 |
-2.6939*** |
0.27950 |
-2.2267*** |
0.37601 |
| Net non-interest income ratio (NNII/TA) | -.22295* |
0.13306 |
-.23793* |
0.13396 |
0.04667 |
0.16507 |
| Liquidity ratio (LA/D&STF) | -.04484*** |
0.01200 |
-.04534*** |
0.01216 |
-.03005** |
0.01320 |
| Growth rate of total loan (GTL) | -.04396*** |
0.00597 |
-.04433*** |
0.00631 |
-.04023*** |
0.00690 |
| Interest income to total loan ratio (i) | .36009*** |
0.05069 |
.36556*** |
0.05105 |
.29436*** |
0.05846 |
| Industry specific | ||||||
| Concentration ratio (CR3) | -2.4719*** |
0.80702 |
-2.4921*** |
0.82473 |
-2.604** |
1.14280 |
| Macroeconomics specific | ||||||
| Short term interest rate (Sdint) | -0.04647 |
0.07552 |
-0.02061 |
0.08061 |
||
| Term spread of interest rate (R) | -0.0531 |
0.14793 |
||||
| GDP growth rate | -.35605*** |
0.04973 |
-.347*** |
0.05090 |
-.23719*** |
0.06644 |
| Rate of inflation | -.08256** |
0.04103 |
-.07584* |
0.04128 |
-.08165* |
0.04657 |
| Year 2003 (Dummy) | 1.3335*** |
0.35420 |
1.287*** |
0.36302 |
1.2001 |
0.93165 |
| Year 2009 (Dummy) | .78418*** |
0.23774 |
.73405*** |
0.24331 |
.67239** |
0.26626 |
| Year 2010 (Dummy) | 1.5772*** |
0.24039 |
1.5915*** |
0.24644 |
1.4354*** |
0.27692 |
| Intercept | 29.078*** |
2.48970 |
29.913*** |
2.55090 |
26.69*** |
3.36610 |
| Number of observations | 639 |
632 |
502 |
|||
| Wald test (p-value) | χ2(15) = 1675.96 |
0.0000 |
χ2 (16) = 1646.42 |
0.0000 |
χ2 (17) = 462.37 |
0.0000 |
| Sargan test (p-value) | χ2 (97) = 432.55 |
0.0000 |
χ2 (97) = 425.98 |
0.0000 |
χ2 (84)= 356.51 |
0.0000 |
| AB test AR(1)(p-value) | z = -2.2202 |
0.0264 |
z = -2.2588 |
0.0239 |
z = -1.8947 |
0.0581 |
| AB test AR(2)(p-value) | z = -2.0702 |
0.1257 |
z = -2.032 |
0.2076 |
z = -1.2372 |
0.2160 |
Note: The table reports the regression output from GMM estimation of the determinants of non-performing loan of banks. Coefficients that are significantly different from zero at the 1%, 5% and 10% level are marked with ***, **, and * respectively. Wald test shows the fine goodness of fit of the model while Sargan test is the test for over-identifying restrictions in GMM dynamic model estimation. AB test AR(1) and AR(2) refer to the Arellano-Bond test that average auto covariance in residuals of order 1 and order 2 is 0 (H0: no auto correlation).
Empirical results showed a moderate degree of persistence of non-performing loans in South Asian banking as the one-period lagged dependent variable (δ (one period lagged NPL/TL) = 0.38604) was statistically significant which also justified the use of GMM in the dynamic panel estimation of our model. This level of persistence of NPL in the South Asian region seems similar to the French and German banking market (Chaibi and Ftiti, 2015![]() ).
).
The statistically significant negative coefficient of the performance variable (proxy by return on asset (ROA) implied the ‘bad management’ hypothesis where performance serves as a proxy for the quality of management and lowering the levels of non-performing loans.
The results supported the ‘moral hazard’ hypothesis that low capitalized banks lead to an increase in non-performing loans. The statistically significant coefficient of the capital variable (E/TA) indicated that every 1% decrease in the equity to total asset ratio would increase NPL by approximately 23 basis points.
Empirical evidence found that the ‘skimping’ hypotheses persist in the South Asian banking region. Short-term cost efficiency burgeons the future level of NPL. Our empirical results supported the so called ‘diversification hypothesis’ in both proxy variables size (lnTA) and net non-interest income ratio (NNII/TA). The statistically significant negative coefficients of both the deterministic variables predicted that banks having the capabilities of income diversification in terms of size and other non-interest income would have low levels of non-performing loans.
We found empirical evidence in favor of the ‘liquidity hypothesis’ that banks with no liquidity shortage become able to expand their loans and advances and can reduce the non-performing loans ratio significantly. Numerically speaking, if a bank could increase the liquid assets to deposit and short term funding and subsequently increase the total loans by 1 percentage point then the NPL would be reduced by 4 basis points.
We empirically proved that in South Asian banking, rather than macroeconomic policy rates, the individual bank’s lending rate significantly determined its non-performing loan ratio and thus supported the adverse selection hypothesis.
In model 1 of Table 3, we included the individual bank lending rate as the determinant of NPL. In model 2 and model 3, we included the short-term lending rate (proxy of which is the annualized standard deviation of monthly average of daily call money rates, SDint) and the long-term interest rate/term spread of interest rate (proxy by the difference between the yields spread of ten year and five year Treasury bonds, R) as the determinants of NPL. The models outcome showed that if the bank increased its lending rate by 1% then its NPL ratio goes up by 36 basis points which were statistically significant whereas the coefficients of the SDint and R were statistically insignificant.
Industry factor was also a significant determinant of non-performing loans in South Asia. Our proxy variable concentration ratio (CR3) was statistically significant and had a negative coefficient meaning that the higher ratio of non-performing loans was significantly due to the lack of fare competition in the banking industry.
As per our hypothetical expectations, the systematic factors affected the non-performing loan ratio of individual bank inversely. The GDP growth rate significantly reduced the NPL. The significant negative coefficient of the inflation rate implied that higher inflation weakens the borrowers’ ability to debt service by reducing their real income and these findings were consistent with previous literature (see Chaibi and Ftiti (2015![]() )).Our empirical results also showed that in 2003, 2009 and 2010, the non-performing loan level was significantly high possibly due to the global recession which was confirmed by the positive coefficients of the year dummies in the baseline model.
)).Our empirical results also showed that in 2003, 2009 and 2010, the non-performing loan level was significantly high possibly due to the global recession which was confirmed by the positive coefficients of the year dummies in the baseline model.
5.2. Robustness Check
In Table 4 we presented the result of our empirical model of the determinants of non-performing loans in South Asia using the fixed effect8 panel estimator as an alternative to the GMM estimator.
However, we found no change in signs and no significant change in values of the coefficients of the explanatory variables in the alternative estimator which confirmed that our baseline GMM estimation output was robust and that the coefficients of the estimation could be interpreted with confidence.
Table-4. Robustness check (Fixed effect estimator as an alternative to GMM estimator) of the determinants of non-performing loan (NPL) of banks in South Asia, 1997-2012, total sample.
| Variables | Model1 |
Model2 |
Model3 |
|||
| Dependent variable: Non-performing loan ratio (NPL/TL) | Coeff. |
S.E. |
Coeff. |
S.E. |
Coeff. |
S.E. |
| Independent variables | ||||||
| Bank specific | ||||||
| Return on average assets (ROAA) | -.29541** |
0.11459 |
-.3269*** |
0.11357 |
-.24456*** |
0.0946 |
| Equity to total asset ratio (E/TA) | -.17608*** |
0.04761 |
-.17636*** |
0.04745 |
-.47348*** |
0.04425 |
| Cost to income ratio (C/TI) | .02456*** |
0.00564 |
.02502*** |
0.00557 |
.01126** |
0.0046 |
| Size (lnTA) | -3.5787*** |
0.33512 |
-3.6271*** |
0.34529 |
-1.585*** |
0.46202 |
| Net non-interest income ratio (NNII/TA) | -1.4154*** |
0.17854 |
-1.5544*** |
0.18002 |
.42223** |
0.20303 |
| Liquidity ratio (LA/D&STF) | .03345* |
0.01843 |
.03282* |
0.01852 |
.02712* |
0.0162 |
| Growth rate of total loan (GTL) | -.04813*** |
0.00688 |
-.06076*** |
0.00807 |
-.03899*** |
0.00684 |
| Interest income to total loan ratio (i) | 0.12737* |
0.08085 |
.14825* |
0.08087 |
0.1046 |
0.07403 |
| Industry specific | ||||||
| Concentration ratio (CR3) | -5.201*** |
1.2007 |
-5.0306*** |
1.1942 |
-4.5399*** |
1.2959 |
| Macroeconomics specific | ||||||
| Short term interest rate (Sdint) | -.37423*** |
0.13045 |
-.25632** |
0.11137 |
||
| Term spread of interest rate (R) | -0.24544 |
0.17054 |
||||
| GDP growth rate | -.40553*** |
0.08368 |
-.40277*** |
0.08552 |
-.19983** |
0.08981 |
| Rate of inflation | -.28727*** |
0.06852 |
-.26805*** |
0.06887 |
-.21166*** |
0.0596 |
| Year 2003 (Dummy) | 1.2868* |
0.67518 |
0.91775 |
0.67769 |
0.45174 |
1.2951 |
| Year 2009 (Dummy) | 0.62774 |
0.45839 |
0.30917 |
0.46391 |
0.39496 |
0.39086 |
| Year 2010 (Dummy) | 2.1735*** |
0.45633 |
2.3779*** |
0.45519 |
2.0481*** |
0.41501 |
| Intercept | 42.554*** |
2.6669 |
43.63*** |
2.7281 |
26.969*** |
3.9521 |
| Number of observations | 825 |
811 |
669 |
|||
| R2 | 0.4713 |
0.4899 |
0.379 |
|||
| Wald test (p-value) | F (14, 684) = 43.55 |
0.0000 |
F (15, 669) = 42.83 |
0.0000 |
F(16, 526) = 20.06 |
0.0000 |
| Hausman test, χ2 (p-value) | 39.5.20 |
0.0000 |
1443.44 |
0.0000 |
123.82 |
0.0000 |
Note: The table reports the regression output from Fixed Effect estimation of the determinants of NPL. Coefficients that are significantly different from zero at the 1%, 5% and 10% level are marked with ***, **, and * respectively. Wald test is the test for the goodness of fit of the model while Hausman test confirm the justification of using fixed effect estimator.
6. CONCLUSION AND IMPLICATIONS OF THE STUDY
We studied the cross-country panel data set with micro and macro level variables and presented the empirical results on how bank specific, industry specific and macroeconomics specific factors affected the bank non-performing loans. We followed the single stage model of NPLs determinants for the empirical study that included four South Asian countries’ (Bangladesh, India, Nepal and Pakistan) banking sector data from 1997 to 2012. Our empirical findings were consistent with our theoretical analysis and the significantly positive persistence of NPLs behavior in the sample region justified the use of the GMM estimator, an up-to date econometric methodology that we effectively used to address the issues that profits showed a tendency to persist over time, reflecting impediments to market competition, informational opacity and/or sensitivity to regional/macroeconomic shocks. Among the bank specific determinants, the statistically significant coefficients of the proxy variables supported the Berger and DeYoung (1997![]() ) ‘bad management’, ‘skimping’ and ‘moral hazard’ hypotheses and the Louzis et al. (2012
) ‘bad management’, ‘skimping’ and ‘moral hazard’ hypotheses and the Louzis et al. (2012![]() ) ‘diversification’ and ‘too big to fail’ hypotheses. The findings also supported the ‘moral hazard II’ hypothesis where the depositors are mainly affected and the ‘adverse selection’ of borrowers by the banks also significantly affected the level of non-performing loans of a bank. The significantly negative coefficients of inflation and GDP growth rate revealed the ‘bad luck’ hypotheses of Berger and DeYoung (1997
) ‘diversification’ and ‘too big to fail’ hypotheses. The findings also supported the ‘moral hazard II’ hypothesis where the depositors are mainly affected and the ‘adverse selection’ of borrowers by the banks also significantly affected the level of non-performing loans of a bank. The significantly negative coefficients of inflation and GDP growth rate revealed the ‘bad luck’ hypotheses of Berger and DeYoung (1997![]() ) where the external elements affected the increase in NPLs. In case of South Asia, the concentration ratio of banks still has some deterministic capacity of non-performing loans along with some adverse effects of the global financial crisis. In terms of policy implications, we suggest that the banks take appropriate actions to achieve cost efficiency and the excellence of management in order to address the moral hazard and adverse selection issues and minimize the non-performing loans ratio. The policy makers should focus on the macro prudential policies so that the bank level lending rate remains within a justified range to reduce the credit risk problems of each bank. In this paper, we comprehensively addressed the question of how microeconomic and macroeconomic forces affect the non-performing loans of a bank. But studies on a number of additional explanatory variables like corporate tax rates, ownership structure, deposit insurance, rate of unemployment, and portfolio effect could not be tested due to the limitations of the data and the degrees of freedom or the potential multicollinearity problem could be tested as an extension of the model.
) where the external elements affected the increase in NPLs. In case of South Asia, the concentration ratio of banks still has some deterministic capacity of non-performing loans along with some adverse effects of the global financial crisis. In terms of policy implications, we suggest that the banks take appropriate actions to achieve cost efficiency and the excellence of management in order to address the moral hazard and adverse selection issues and minimize the non-performing loans ratio. The policy makers should focus on the macro prudential policies so that the bank level lending rate remains within a justified range to reduce the credit risk problems of each bank. In this paper, we comprehensively addressed the question of how microeconomic and macroeconomic forces affect the non-performing loans of a bank. But studies on a number of additional explanatory variables like corporate tax rates, ownership structure, deposit insurance, rate of unemployment, and portfolio effect could not be tested due to the limitations of the data and the degrees of freedom or the potential multicollinearity problem could be tested as an extension of the model.
| Funding: This study received no specific financial support. |
| Competing Interests: The authors declare that they have no competing interests. |
| Acknowledgement: Both authors contributed equally to the conception and design of the study. |
REFERENCES
Ahmad, N.H. and M. Ariff, 2007. Multi-country study of bank credit risk determinants. International Journal of banking and Finance, 5(1): 135-152.
Ali, A. and K. Daly, 2010. Macroeconomic determinants of credit risk: Recent evidence from a cross country study. International Review of Financial Analysis, 19(3): 165-171.Available at: https://doi.org/10.1016/j.irfa.2010.03.001.
Arellano, M. and S. Bond, 1991. Some tests of specification for panel data: Monte Carlo evidence and an application to employment equations. The Review of Economic Studies, 58(2): 277-297.Available at: https://doi.org/10.2307/2297968.
Athanasoglou, P.P., S.N. Brissimis and M.D. Delis, 2008. Bank-specific, industry-specific and macroeconomic determinants of bank profitability. Journal of International Financial Markets, Institutions and Money, 18(2): 121-136.
Baltagi, B.H., 2001. Econometric analysis of panel data. 2nd Edn., Chichester: John Wiley & Sons.
Bank Scope, 2013. Bureau Van Dijk. Moody’s analytics. Available from www.bvdep.com.
Berger, A.N. and R. DeYoung, 1997. Problem loans and cost efficiency in commercial banks. Journal of Banking & Finance, 21(6): 849-870.Available at: https://doi.org/10.1016/s0378-4266(97)00003-4.
Bernanke, B. and M. Gertler, 1989. Agency costs, net worth, and business fluctuations. The American Economic Review, 79(1): 14-31.
Bernanke, B.S., M. Gertler and S. Gilchrist, 1998. The financial accelerator in a quantitative business cycle framework. Handbook of Macroeconomics, 1: 1341-1395.Available at: https://doi.org/10.1016/s1574-0048(99)10034-x.
Bohachova, O., 2008. The impact of macroeconomic factors on risks in the banking sector; a cross country empirical assessment. IAW Discussion Papers No. 44.
Castro, V., 2013. Macroeconomic determinants of the credit risk in the banking system: The case of the GIPSI. Economic Modelling, 31: 672-683.Available at: https://doi.org/10.1016/j.econmod.2013.01.027.
Chaibi, H. and Z. Ftiti, 2015. Credit risk determinants: Evidence from a cross-country study. Research in International Business and Finance, 33: 1-16.Available at: https://doi.org/10.1016/j.ribaf.2014.06.001.
Espinoza, R. and A. Prasad, 2010. Nonperforming loans in the GCC banking systems and their macroeconomic effects. IMF Working Paper, No. 10/224.
FASB (Financial Accounting Standards Board), 2008. Statement of Financial Accounting Standards No. 114. FASB Emerging Issues Task Force (EITF), FAS114-1-17.
Festić, M., A. Kavkler and S. Repina, 2011. The macroeconomic sources of systemic risk in the banking sectors of five new EU member states. Journal of Banking & Finance, 35(2): 310-322.Available at: https://doi.org/10.1016/j.jbankfin.2010.08.007.
Gertler, M. and N. Kyotaki, 2011. Financial intermediation and credit policy in business cycle analysis. Handbook of Monetary Economics, 3A: 547-599.
Gilbert, R., 1984. Bank market structure and competition: A survey. Journal of Money, Credit and Banking, 16(4): 617-644.Available at: https://doi.org/10.2307/1992096.
Imbierowicz, B. and C. Rauch, 2014. The relationship between liquidity risk and credit risk in banks. Journal of Banking & Finance, 40: 242-256.Available at: https://doi.org/10.1016/j.jbankfin.2013.11.030.
International Financial Statistics (IFS), 2014. Available from https://data.imf.org/IFS.
Judson, R.A. and A.L. Owen, 1999. Estimating dynamic panel data models: A guide for macroeconomists. Economics Letters, 65(1): 9-15.Available at: https://doi.org/10.1016/s0165-1765(99)00130-5.
Keeton, W.R. and C.S. Morris, 1987. Why do banks’ loan losses differ. Economic Review, 72(5): 3-21.
Kyotaki, N. and J. Moore, 1997. Credit chains. Journal of Political Economy, 105(21): 211-248.
Louzis, D.P., A.T. Vouldis and V.L. Metaxas, 2012. Macroeconomic and bank-specific determinants of non-performing loans in Greece: A comparative study of mortgage, business and consumer loan portfolios. Journal of Banking & Finance, 36(4): 1012-1027.Available at: https://doi.org/10.1016/j.jbankfin.2011.10.012.
Nkusu, M., 2011. Non-performing loans and macro financial vulnerabilities in advanced economies. IMF Working Paper No. 11/161.
Podpiera, J. and L. Weill, 2008. Bad luck or bad management? Emerging banking market experience. Journal of Financial Stability, 4(2): 135-148.Available at: https://doi.org/10.1016/j.jfs.2008.01.005.
Rajan, R. and S.C. Dhal, 2003. Non-performing loans and terms of credit of public sector banks in India: An empirical assessment. Reserve Bank of India Occasional Papers, 24(3): 81-121.
Reinhart, C. and K. Rogoff, 2009. From financial crash to debt crisis. NBER Working Paper 15795.
Rinaldi, L. and A. Sanchis-Arellano, 2006. Household debt sustainability: What explains household non-performing loans? An empirical analysis. ECB Working Paper No. 570, Kaiserstrasse 29 60311 Frankfurt am Main, Germany. pp: 1-45.
Salas, V. and J. Saurina, 2002. Credit risk in two institutional regimes: Spanish commercial and savings banks. Journal of Financial Services Research, 22(3): 203-224.
Shu, C., 2002. The impact of macroeconomic environment on the asset quality of Hong Kong’s banking sector. Hong Kong Monetary Authority Research Memorandum. Economic Research Division, Research Department, Hong Kong Monetary Authority. pp: 1-26.
Skarica, B., 2014. Determinants of non-performing loans in Central and Eastern European countries. Financial Ttheory and Practice, 38(1): 37-59.Available at: https://doi.org/10.3326/fintp.38.1.2.
Stiglitz, J.E. and A. Weiss, 1981. Credit rationing in markets with imperfect information. The American Economic Review, 71(3): 393-410.
Williams, J., 2004. Determining management behaviour in European banking. Journal of Banking & Finance, 28(10): 2427-2460.Available at: https://doi.org/10.1016/j.jbankfin.2003.09.010.
Zribi, N. and Y. Boujelbegrave, 2011. The factors influencing bank credit risk: The case of Tunisia. Journal of Accounting and Taxation, 3(4): 70-78.
APPENDIX
Table-A5. Correlation matrix* of the variables studied for the model of the determinants of non-performing loan of banks in South Asia.
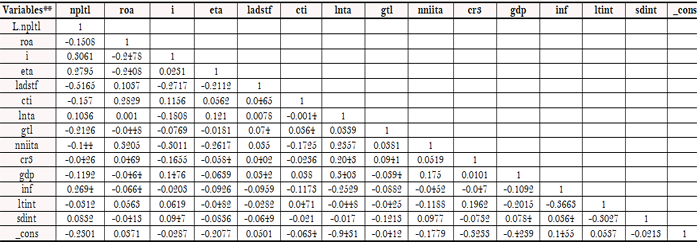
* Output of Stata.
** Refer to the Table 1 of summary statistics for elaboration of the names of the variables.
Views and opinions expressed in this article are the views and opinions of the author(s), Asian Economic and Financial Review shall not be responsible or answerable for any loss, damage or liability etc. caused in relation to/arising out of the use of the content. |
Footnotes:
1. The relevant Hausman test chi-squared statistics was x2 (11) = 3905.20 with p-value is 0.0000
2. The Monte Carlo studies that measured the corresponding bias in the coefficients of the lagged dependent variables have found that the bias is significant for small values of T but goes to zero as T increases (see Judson and Owen (1999)).
3. In both the cases ρ = 0.00 which means the question of endogeneity is irrelevant for capital variable in NPL modeling.
4.The relevant LM test chi-squared statistics was x2(12) = 85.73with p-value = 0.0000.
6. We used the annualized standard deviation of monthly average of daily call money rates as the proxy of short term interest rates.
7. Term structure of interest rate is proxied as the difference between the yields spread of 10 year and 5 year Treasury bonds (T-bond). Also for Nepal, we sampled the development bond yield as the equivalent to 5 year T-bond and the national savings certificates yield as equivalent to 10 year T-bond as they have no such classified maturity bonds.