


RELATIONSHIP BETWEEN FINANCIAL INCOME TAX REFORM AND IMPLICIT TAX: CASE OF SOUTH KOREAN BOND MARKET

1Korea Institute of Public Finance, South Korea.
2 Seoul National University of Science and Technology, South Korea.
ABSTRACT
In South Korea, comprehensive taxation, which is a combination of income from various sources, has been applied to financial income exceeding a certain amount. However, criticism continues to be raised that the level of financial income is lower compared with other incomes, and South Korea’s taxation authorities lowered the standard amount in 2013, thereby increasing the tax burden on financial income. This study aims to analyze the response of the bond market to the reduction of the standard amount of comprehensive taxation for financial income. This study analyzes the implicit tax phenomenon that the pre-tax return of bonds with large tax benefits is relatively low, in Korean bond market. It suggests that the sustainability level of the bond market has increased as the difference between the yield of the National Housing Bond, which has a large tax burden after 2013, and that of the general Korean Treasury Bond has decreased to a statistically significant level. Therefore, this study proposes that tax reforms on financial income may affect not only the level of tax burden but also the macro-economy of money transfers among financial instruments and financial markets.
Keywords: Financial income tax, Bond market sustainability, Implicit tax, Tax reform, Comprehensive taxation, Bond spread, National housing bond.
JEL Classification: B22; C12; H26.
ARTICLE HISTORY: Received:27 May 2019 Revised:3 July 2019 Accepted:6 August 2019 Published:16 September 2019.
Contribution/ Originality:The paper's primary contribution is finding that tax reforms on financial income may affect not only the level of tax burden but also implicit taxes and the macro-economy of money transfers among financial instruments and financial markets.
1. INTRODUCTION
Since South Korea introduced the comprehensive taxation for financial income (CTFI) in 1996, changes in tax rates, taxation systems, and standard amounts have occurred. During its introduction, the minimum amount of withholding tax of 15% was applied to minimize the impact of the financial market, whereas the sum of the married couple was set at 40 million KRW (Korea National Assembly Budget Office, 2012![]() ). This system raised criticism that the effective tax rate on the comprehensive income would be raised, which could harm tax equality between financial and non-financial incomes, such as earned and business incomes (KNABO, 2012
). This system raised criticism that the effective tax rate on the comprehensive income would be raised, which could harm tax equality between financial and non-financial incomes, such as earned and business incomes (KNABO, 2012![]() ; Ki and Hwang, 2014
; Ki and Hwang, 2014![]() ).
).
The South Korean government announced an amendment to the tax law to lower the standard amount of financial income tax to 30 million KRW to strengthen taxation on financial income in August 2012. In December 2012, the National Assembly decided to reduce the total amount of financial income tax base to 20 million KRW. Although the standard cuts in CTFI are considered to be measures for financial income and tax equality among non-financial income earners, criticisms regarding the ripple effects of financial markets continue. In other words, as the tax burden on income from financial assets increases, the portfolio of financial assets can change, which may lead to the transfer of funds between stocks, bonds, deposits, and insurance markets or transfers of funds between financial products.
However, several studies have been completed on the taxable equity or tax revenue effect between financial and non-financial income earners and the estimation of taxable persons due to the enforcement of the CTFI system and the change of the tax rate or the reduction of the standard amount. However, the analysis of the effect of the financial market on the financial income tax system is relatively limited. Therefore, analyzing the impact of the financial market on the changes in the financial income taxation system is necessary, and the impact on the financial market must be considered in changing the financial income tax or making policy decisions.
This study aims to analyze the ripple effects of the financial market on the bond market as the tax burden of the existing taxable population increases with the accrual of the total taxable persons of financial income earners by lowering the standard amount of CTFI. Particularly, this study analyzes the impact of the standard amount reduction of CTFI on the bond market, which is subject to differential taxation on interest income, although various financial markets exist such as stocks, bonds, deposits, and insurance. The reasons for the analysis of the bond market are as follows.
First, the bond market is characterized by its capability to capture the effects of changes in financial income tax due to the existence of bonds with taxable benefits such as National Housing Bond (NHB), Korean Treasury Bond (KTB), and corporate bonds with relatively low taxation benefits.
Second, implicit tax effects can be measured in analyzing the effects of changes in financial income taxation on financial markets. The tax preference phenomenon in the bond market exists due to the difference in the size of the tax benefit by bond product (Wilkie, 1992![]() ; Jung and Yi, 2002
; Jung and Yi, 2002![]() ; Jung and Roh, 2004
; Jung and Roh, 2004![]() ). Therefore, the realization of implicit tax can be observed, in which the pre-tax return of financial instruments with large tax benefits and the post-tax return of instruments with small tax benefits are equal. The bond market is expected to be optimized to apply this methodology.
). Therefore, the realization of implicit tax can be observed, in which the pre-tax return of financial instruments with large tax benefits and the post-tax return of instruments with small tax benefits are equal. The bond market is expected to be optimized to apply this methodology.
The remainder of this paper is as follows. Section 2 reviews the CTFI system and related precedent studies. Section 3 describes the research hypothesis and the research methodology. Section 4 explains the results of descriptive statistics and regression analysis. Finally, Section 5 summarizes the analysis results.
2. THEORETICAL BACKGROUND AND LITERATURES REVIEW
2.1. CFTI
Financial income was subject to separate taxation until the introduction of the CTFI in 1996. After 1996, financial income has been subject to comprehensive taxation in principle. However, annual financial income of less than 20 million KRW is generally taxed with full withholding tax. The criterion for the annual excess of 20 million KRW is based on the total amount of financial income excluding tax exempt and separate taxable financial income. However, even if the annual financial income is less than 20 million KRW, the financial income that is not withheld in South Korea is taxed together with other incomes.
The characteristics of CTFI can be summarized as follows. CTFI is likely to cause tax equality problems. Horizontal equity has the same taxation capability, that is, taxpayers with the same income should pay the same tax. The present CTFI has a problem with horizontal equity. Financial income is subject to comprehensive taxation. However, if the total annual financial income per person is less than 20 million KRW, then such income is terminated with withholding tax. In addition, only financial income that exceeds 20 million KRW is included in comprehensive income; hence, is a problem of equity exists between incomes. Therefore, taxpayers with only financial income are subject to tax rates that are higher than the lowest tax rate on the total income (Park and Nho, 2001![]() ).
).
In addition, tax burden on financial income is relatively high because the withholding tax rate of financial income is higher than the effective tax rate of earned or comprehensive income. For example, the National Statistical Yearbook indicates that the withholding effective tax rate of 2014 interest income tax was 9.5%, and the withholding effective tax rate of dividend income was 12%. In comparison with the fact that the effective tax rate of earned income tax is only approximately 4.74% since the end of the 2014 settlement measures, the withholding tax of tax rate on financial income is high, although financial instruments subject to the tax exemption and reduction are considered.
Furthermore, vertical equity indicates that the tax burden should be progressive as the income increases. Although a difference exists in the financial income amount, the same tax rate may apply, and the effective tax rate of the comprehensive income may be rather inverse. For example, if the financial income of CTFI is only 52.2 million KRW or less, then the problem of vertical equity exists among financial income earners by applying a withholding tax rate of 14% collectively. The actual tax burden may not be entirely negative for low-income earners because various financial instruments for tax exemption and reduction exist to prevent such problems.
Second, CTFI can generate a threshold effect. Under the current system, financial income of less than 20 million KRW is terminated with withholding tax, financial income exceeding 20 million KRW is subject to comprehensive taxation, and the tax burden increases according to the amount of income other than financial income. Thus, the current CTFI, such as line drawing, increases the difference in tax burden before and after the base amount, thereby resulting in an inefficient tax cut effort and a distortion of asset allocation (Park and Jung, 2014![]() ; Park, 2016
; Park, 2016![]() ). Since CTFI requires taxpayers to voluntarily report and pay tax; thus, the standard amount setting can advantageously reduce the compliance costs of the taxpayer. However, certain incentives to avoid taxable income through the use of tax exempt and reduction instruments exist due to the threshold effect, thereby causing distortion of the allocation of assets because of incentives to distribute financial income to spouses and children.
). Since CTFI requires taxpayers to voluntarily report and pay tax; thus, the standard amount setting can advantageously reduce the compliance costs of the taxpayer. However, certain incentives to avoid taxable income through the use of tax exempt and reduction instruments exist due to the threshold effect, thereby causing distortion of the allocation of assets because of incentives to distribute financial income to spouses and children.
Third, CTFI has a double taxation adjustment function for dividend income. Shareholder dividends comprise retained earnings, which are taxed on corporate income; thus, shareholders are taxed again through corporate income tax. Gross-up and dividend tax payment systems are operated to solve this double taxation problem. However, such adjustments only require taxpayers with at least withholding tax to be paid and are only applied to taxpayers subject to CTFI. In other words, all dividend incomes are not double taxation adjusted; however, double taxation is limited to a part of dividend income.
Fourth, CTFI is related to health insurance systems. Generally, financial income is partially related to the national health insurance system. The eligibility of dependents on National Health Insurance may be lost or the premium burden may increase significantly depending on the size of financial income. Since December 2006, the eligibility of the dependents of the workplace subscriber occurs only if the financial income is less than 40 million KRW. The financial income of 40 KRW million is the base amount before the reduction in the base amount as of 2013, and the tax burden on the health insurance premium has increased considerably because the payment of tax subjected to comprehensive taxation has been converted into general insurance. At present, health insurance premiums are raised for those who work at the workplace and the income outside the workers’ income exceeds 72 million KRW a year.
2.2. Literature Review of Implicit Tax
Implicit tax is a phenomenon in which the pre-tax return decreases with the explicit taxation on investments (Scholes et al., 2014![]() ). A typical background to explain the mechanism of implicit taxation is the bond market where investors choose tax-exempt bonds (municipal bonds) and fully taxable bonds (corporate bonds) of the same risk. When numerous investors purchase tax-benefit bonds, the demand growth increases the price of the bond and lowers the effective interest rate (pre-tax return). Therefore, investors pay implicit tax by paying low pre-tax income on tax benefit bonds. Ultimately, marginal investors can earn the same after-tax return on investment in a balanced state.
). A typical background to explain the mechanism of implicit taxation is the bond market where investors choose tax-exempt bonds (municipal bonds) and fully taxable bonds (corporate bonds) of the same risk. When numerous investors purchase tax-benefit bonds, the demand growth increases the price of the bond and lowers the effective interest rate (pre-tax return). Therefore, investors pay implicit tax by paying low pre-tax income on tax benefit bonds. Ultimately, marginal investors can earn the same after-tax return on investment in a balanced state.
Prior studies on this implicit tax are classified into investment asset, corporate, and international levels. Prior studies analyzing the implicit taxation of investment assets have focused on the analysis of the relationship between investor level tax and pre-tax return. The majority of studies use exogenous effects on the explicit tax rate on the investment to identify the implicit tax at the investor level clearly. Guenther (1994![]() ) provided evidence that US Treasury prices have a substantive response to tax rate changes in 1981 and 1986, and Atwood (2003
) provided evidence that US Treasury prices have a substantive response to tax rate changes in 1981 and 1986, and Atwood (2003![]() ) reported implicit tax effects on local bonds (Mankiw and James, 1996
) reported implicit tax effects on local bonds (Mankiw and James, 1996![]() ). Erickson and Maydew (1998
). Erickson and Maydew (1998![]() ) reported an increase in the return on preferred stocks from 70% to 50% on dividend income deductions to capture implicit tax on preferred stocks.
) reported an increase in the return on preferred stocks from 70% to 50% on dividend income deductions to capture implicit tax on preferred stocks.
Klassen and Mescall (2012![]() ) analyzed implicit tax phenomena using a natural and experimental environment, with a sudden announcement that they would discontinue tax incentives for income trusts in 2006 (recognition of securitization of income trusts). As a result of the analysis, the authors estimated the implicit tax rate from 3.01% to 5.01%, which is less than the theoretical range of 0%–27.4%, and no evidence of implicit tax of high dividend common stock was observed in the same case. Meanwhile, Edwards and Shevlin (2011
) analyzed implicit tax phenomena using a natural and experimental environment, with a sudden announcement that they would discontinue tax incentives for income trusts in 2006 (recognition of securitization of income trusts). As a result of the analysis, the authors estimated the implicit tax rate from 3.01% to 5.01%, which is less than the theoretical range of 0%–27.4%, and no evidence of implicit tax of high dividend common stock was observed in the same case. Meanwhile, Edwards and Shevlin (2011![]() ) suggested an implicit tax of corporations exists following the abolishment of tax exemption (elimination of securitization treatment of income trusts).
) suggested an implicit tax of corporations exists following the abolishment of tax exemption (elimination of securitization treatment of income trusts).
Other studies have used cross-sectional differences when no impact on explicit tax rates is observed. Atwood (2003![]() ) argued that taxable local bonds are used as benchmark assets to apply a tax rate of approximately 34% for fully tax-exempt bonds and a 27% rate for bonds subject to AMT. Engel et al. (1999
) argued that taxable local bonds are used as benchmark assets to apply a tax rate of approximately 34% for fully tax-exempt bonds and a 27% rate for bonds subject to AMT. Engel et al. (1999![]() ) found no implicit tax at the shareholder level on pre-tax profits for financial instruments for financial reporting purposes and debt instruments for tax reporting purposes.
) found no implicit tax at the shareholder level on pre-tax profits for financial instruments for financial reporting purposes and debt instruments for tax reporting purposes.
Wilkie (1992![]() ) conducted a representative study that analyzed the implicit tax phenomena at the corporate level. The author used 818 sample companies from 1968 to 1985 and found that the implicit tax of companies benefiting from tax benefits (subsidies) reduces profits. Wilkie (1992
) conducted a representative study that analyzed the implicit tax phenomena at the corporate level. The author used 818 sample companies from 1968 to 1985 and found that the implicit tax of companies benefiting from tax benefits (subsidies) reduces profits. Wilkie (1992![]() ) also found that the pre-tax return on capital decreases due to tax benefits (subsidies). Berger (1993
) also found that the pre-tax return on capital decreases due to tax benefits (subsidies). Berger (1993![]() ) analyzed the implicit tax effect of US R&D tax credits, which showed a negative stock price response to the creation of the R&D tax credit system. Therefore, the author argued that the implicit tax effect of R&D tax credits is substantial. Salbador and Vendrzyk (2006
) analyzed the implicit tax effect of US R&D tax credits, which showed a negative stock price response to the creation of the R&D tax credit system. Therefore, the author argued that the implicit tax effect of R&D tax credits is substantial. Salbador and Vendrzyk (2006![]() ) examined the tax cut effect of implicit tax on 60 defense contractors in relation to the tax preference of TRA86 in 1986. The result provided evidence that defense companies cannot avoid implicit tax using monopoly status because they do not have sufficient market power.
) examined the tax cut effect of implicit tax on 60 defense contractors in relation to the tax preference of TRA86 in 1986. The result provided evidence that defense companies cannot avoid implicit tax using monopoly status because they do not have sufficient market power.
Jennings et al. (2012![]() ) analyzed the implicit tax phenomenon at the firm level as a result of the widening of the tax base in accordance with TRA86 and found that the implicit tax at the firm level offsets the explicit taxation in the enterprise sample before TRA86. However, the implicit tax effect is present even after-tax reform; nevertheless, the size has decreased remarkably. The reasons for these results are as follows. First, Jennings et al. (2012
) analyzed the implicit tax phenomenon at the firm level as a result of the widening of the tax base in accordance with TRA86 and found that the implicit tax at the firm level offsets the explicit taxation in the enterprise sample before TRA86. However, the implicit tax effect is present even after-tax reform; nevertheless, the size has decreased remarkably. The reasons for these results are as follows. First, Jennings et al. (2012![]() ) argued that the cross-sectional area deviations to the size of the tax-benefit investment after TRA86 have decreased because of the expansion of the tax base, thereby resulting in a decrease in the effective tax rate and a smaller implicit tax effect. Second, given that implicit tax is a phenomenon that occurs throughout the market, both firms in the experimental and control groups were US firms, and both groups were subjected to implicit tax of the economy as a whole.
) argued that the cross-sectional area deviations to the size of the tax-benefit investment after TRA86 have decreased because of the expansion of the tax base, thereby resulting in a decrease in the effective tax rate and a smaller implicit tax effect. Second, given that implicit tax is a phenomenon that occurs throughout the market, both firms in the experimental and control groups were US firms, and both groups were subjected to implicit tax of the economy as a whole.
Chyz et al. (2016![]() ) extended the study of Jennings et al. (2012
) extended the study of Jennings et al. (2012![]() ) to analyze implicit tax and reported that the decline in explicit tax burden that US corporations have incurred over the past 25 years has been partially offset by an increase in implicit tax. Moreover, multinational companies found that the savings on explicit taxation regarding implicit tax were smaller than those on competitors. In other words, US multinational corporations have relatively low implicit tax effects in the United States. Bryant-Kutcher et al. (2012
) to analyze implicit tax and reported that the decline in explicit tax burden that US corporations have incurred over the past 25 years has been partially offset by an increase in implicit tax. Moreover, multinational companies found that the savings on explicit taxation regarding implicit tax were smaller than those on competitors. In other words, US multinational corporations have relatively low implicit tax effects in the United States. Bryant-Kutcher et al. (2012![]() ) analyzed the implicit tax reduction of multinational corporations and found that foreign effective tax rates of US multinational corporations between 1990 and 2006 were negatively related to firm value and foreign tax return (ROA). This result emphasizes that an error in the measurement of implicit tax may exist because the ROA includes more income than the costs (implicit tax).
) analyzed the implicit tax reduction of multinational corporations and found that foreign effective tax rates of US multinational corporations between 1990 and 2006 were negatively related to firm value and foreign tax return (ROA). This result emphasizes that an error in the measurement of implicit tax may exist because the ROA includes more income than the costs (implicit tax).
South Korea’s representative studies analyzing the inherent taxation phenomenon at the enterprise level are those of Ko (1996![]() ), Lee and Lee (1997
), Lee and Lee (1997![]() ), Kim (2000
), Kim (2000![]() ), Roh and Kim (2016
), Roh and Kim (2016![]() ) and Kim and Roh (2017
) and Kim and Roh (2017![]() ). These studies have used domestic firm samples and argued that an implicit tax effect exists. Roh and Kim (2016
). These studies have used domestic firm samples and argued that an implicit tax effect exists. Roh and Kim (2016![]() ) analyzed the existence of implicit tax before and after the tax rate change and argued that, different from the findings of Jennings et al. (2012
) analyzed the existence of implicit tax before and after the tax rate change and argued that, different from the findings of Jennings et al. (2012![]() ) the magnitude of the implicit tax increased after the change of the corporation tax rate. Meanwhile, Kim and Roh (2017
) the magnitude of the implicit tax increased after the change of the corporation tax rate. Meanwhile, Kim and Roh (2017![]() ) analyzed the change in implicit tax before and after the tax rate change and suggested that the implicit tax rate decreased after the tax rate change. Thus, the results of this analysis were consistent with the findings of Jennings et al. (2012
) analyzed the change in implicit tax before and after the tax rate change and suggested that the implicit tax rate decreased after the tax rate change. Thus, the results of this analysis were consistent with the findings of Jennings et al. (2012![]() ).
).
Finally, Huizinga et al. (2008![]() ), Bradley et al. (2015
), Bradley et al. (2015![]() ) and Blouin et al. (2016
) and Blouin et al. (2016![]() ) examined implicit tax at the multinational level. These studies involve tax reforms, such as tax cuts in certain countries, rather than making an actual investment through simple accounting among firms in each country. Strategic relocation of assets and liabilities and adjustments in transfer pricing increase pre-tax return rates reported in countries with relatively low tax burdens. However, no primary impact on real pre-tax return exists given that actual product manufacturing and sales volume do not change.
) examined implicit tax at the multinational level. These studies involve tax reforms, such as tax cuts in certain countries, rather than making an actual investment through simple accounting among firms in each country. Strategic relocation of assets and liabilities and adjustments in transfer pricing increase pre-tax return rates reported in countries with relatively low tax burdens. However, no primary impact on real pre-tax return exists given that actual product manufacturing and sales volume do not change.
Situations may exist where measuring implicit tax on the basis of the results of accounting it is difficult because the result of the transfer of income is contrary to the result of implicit tax. Therefore, studies on income transfer can only measure the effect of net income transfer by controlling actual investment. However, such studies analyze the income transfer using the difference in pre-tax return between domestic and foreign companies.
3. RESEARCH HYPOTHESES AND RESEARCH METHODOLOG
3.1. Research Hypotheses
As the standard amount of financial income subject to comprehensive taxation was reduced from 40 million to 20 million KRW in 2013, not only the taxpayers subject to comprehensive taxation but also financial income earners with a taxable financial income exceeding 20 million and below 40 million KRW, respectively, were affected. Therefore, financial assets can be transferred to assets, such as tax exemption or reduction, inevitably to mitigate or avoid such an increase in tax burden (Kim, 2013![]() ). Through this method, the event of the cut-off of the standard amount raised concerns in the studies of Cho (1996
). Through this method, the event of the cut-off of the standard amount raised concerns in the studies of Cho (1996![]() ), Jung and Roh (2004
), Jung and Roh (2004![]() ) and Park and Jung (2014
) and Park and Jung (2014![]() ) that the financial market would receive a negative impact.
) that the financial market would receive a negative impact.
However, the South Korean government has made several changes to the CTFI. The standard amount has been set at 40 million KRW since 1996. The CTFI was suspended in 1997 due to the foreign exchange crisis and has been implemented again since 2001. The total tax base has been reduced from 40 million to 20 million KRW since 2013. The government, which gradually reduces the standard amount of such a comprehensive taxable financial income, seems to have a policy consideration to minimize the negative impact on the financial market. Particularly, in the prior studies, the dominant view was that the creation of CTFI and a reduction in the standard amount has a negative impact on the financial market.
However, this study attempts to approach this financial market impact from two perspectives as follows:
First, a shift may exist from financial markets to real assets. Such asset movements due to cuts in the standard amount of financial income subject to comprehensive taxation can affect the financial markets and the entire financial industry. This result has been viewed negatively because the size of the financial market can be reduced or the scale of the shadow economy can be expanded.
Second, shifts may occur from financial markets to other financial markets or from financial products to other financial products. If the assets of the existing financial market move to other financial markets or if the tax benefits are transferred to a financial asset within the same sector, then the impact on the overall financial market may be limited; however, such movements may have a negative impact on certain financial sectors. Kim and Seo (2013![]() ) argued that financial investment has shifted between financial products because the substitution relationship between financial products becomes clearer as the comprehensive taxation scope for financial income is expanded; because tax exemption, reduction, or separation of taxation financial instruments can meet the policy objectives set by the government. However, if a devaluation of funds exists from non-taxable, exempted, or separated taxable financial assets in the financial market, then such a devaluation will affect the financial performance of each type of financial business. In addition, devaluation may result in a deterioration in the equity of the financial sector, which may ultimately be a negative financial market impact.
) argued that financial investment has shifted between financial products because the substitution relationship between financial products becomes clearer as the comprehensive taxation scope for financial income is expanded; because tax exemption, reduction, or separation of taxation financial instruments can meet the policy objectives set by the government. However, if a devaluation of funds exists from non-taxable, exempted, or separated taxable financial assets in the financial market, then such a devaluation will affect the financial performance of each type of financial business. In addition, devaluation may result in a deterioration in the equity of the financial sector, which may ultimately be a negative financial market impact.
Thus, identification (as in the current CTFI evaluation) of the negative impact of the CTFI on the financial market, as well as the concerns raised in prior research, is necessary. Therefore, this study attempts to analyze the effect of moving financial assets due to the reduction of the base amount.
Several prior studies have implied that implicit taxes exist in the bond market. The demand for bonds increases and the pre-tax return on bonds decreases as a result of the preference for the NHB with high tax benefits (Jung and Yi, 2002![]() ; Jung and Roh, 2004
; Jung and Roh, 2004![]() ). Likewise, investors can prefer tax-advantaged NHB with to minimize the increased tax burden by lowering the CTFI threshold, thereby resulting in the implicit tax effect. Therefore, the yield spread between taxable NHB and taxable general bonds (national bonds) is likely to decrease in 2013, the year in which the total amount of taxable financial income was cut. The reason for establishing the spread with KTB is that it is similar to a national bond; thus, KTB has a similar default risk to the government guaranteed bonds, and distinguishing the difference can be clearer according to the tax incentive of the NHB than the corporate bond.
). Likewise, investors can prefer tax-advantaged NHB with to minimize the increased tax burden by lowering the CTFI threshold, thereby resulting in the implicit tax effect. Therefore, the yield spread between taxable NHB and taxable general bonds (national bonds) is likely to decrease in 2013, the year in which the total amount of taxable financial income was cut. The reason for establishing the spread with KTB is that it is similar to a national bond; thus, KTB has a similar default risk to the government guaranteed bonds, and distinguishing the difference can be clearer according to the tax incentive of the NHB than the corporate bond.
Furthermore, an implicit tax phenomenon exists due to the application of differential taxation between NHB with high tax benefits and general bonds subject to taxation (Jung and Yi, 2002![]() ). However, this implicit tax phenomenon can become increasingly pronounced as the standard amount of CTFI is lowered and the level of discriminatory taxation is further intensified. Therefore, this study intends to develop the following research hypothesis.
). However, this implicit tax phenomenon can become increasingly pronounced as the standard amount of CTFI is lowered and the level of discriminatory taxation is further intensified. Therefore, this study intends to develop the following research hypothesis.
Research hypothesis: The difference between NHB’s pre- and after-tax returns decreases after the CTFI’s standard amount reduction.
3.2. Research Models and Data
As shown in Equation 1, the research model of this study is designed by benchmarking the research model of Won and Lee (2007![]() ) as a methodology of event study. The dependent variable is defined as the spread between the yields on NHB and KTB (maturity of 5 years), and the interest variable is defined as “1” for the period from the CTFI standard amount reduction from 40 million to 20 million KRW; otherwise, the interest variable is “0”. The variable is defined as follows. First, Post2013 is “1” if it is from January 2013 to December 2013 and “0” otherwise. Second, Post2013.10–2014.3 differentiates the analysis window by measuring “1” from October 2012 to March 2014 and “0” otherwise to grasp the effect immediately before and after lowering the standard amount of CTFI. The reason for differentiating the window in this manner is that Post2013 analyzes whether a change has occurred before and after the reduction of the standard amount of CTFI. Meanwhile, Post2013.10 –2014.3 analyzes whether a temporary change has occurred due to the reduction of the standard amount.
) as a methodology of event study. The dependent variable is defined as the spread between the yields on NHB and KTB (maturity of 5 years), and the interest variable is defined as “1” for the period from the CTFI standard amount reduction from 40 million to 20 million KRW; otherwise, the interest variable is “0”. The variable is defined as follows. First, Post2013 is “1” if it is from January 2013 to December 2013 and “0” otherwise. Second, Post2013.10–2014.3 differentiates the analysis window by measuring “1” from October 2012 to March 2014 and “0” otherwise to grasp the effect immediately before and after lowering the standard amount of CTFI. The reason for differentiating the window in this manner is that Post2013 analyzes whether a change has occurred before and after the reduction of the standard amount of CTFI. Meanwhile, Post2013.10 –2014.3 analyzes whether a temporary change has occurred due to the reduction of the standard amount.
In the analysis, if β1 is a negative coefficient, then the difference between the NHB and KTB yields is small after the reduction of the standard amount, which indicates that the demand for investment in the NHB with tax benefit is increased. Finally, this analysis implies that implicit tax in the bond market is realized.
+ β6KOSPI_Indext + β7Yield_Curvet + ε (1)
Spread: The yield of the NHB–the yield of KTB.
Post: Period after CTFI reduction.
Post2013: "1" if January 2013 through December 2013, "0" otherwise.
Post2013.10~2014.3: "1" if it is October 2012 to March 2014, otherwise "0".
Volume: Natural logarithm of trading volume.
ISSUE: Natural logarithm of new bond issuance.
Maturity: Natural logarithm of expiration amount.
KOSPI_Vol: Natural log value of KOSPI trading volume.
KOSPI_Index: Natural logarithm of the KOSPI index.
Yield_Curve: KTB yield–CD yield.
To control factors that may affect the dependent variable, the spreads, variables in the bond market level, and factors in the stock market are included in the control variables. Volume is the natural logarithm of the total volume of transactions on the relevant date in the bond market, and ISSUE is the natural logarithm of the newly issued bond value. Maturity is a natural logarithm of the maturity (Stock and Watson, 2002![]() ).
).
KOSPI_Vol is the natural logarithm of the KOSPI trading volume of the day, and KOSPI_Index is the natural logarithm of the KOSPI index of the day. Yield_Curve controls the interest rate of the entire financial market with the difference of CD yield from the KTB yield of the day.
This study extracts the bonds and stocks data from Korea Financial Investment Association from January 1, 2010 to December 31, 2015 to analyze whether the financial assets have been transferred to the NHB market in the bond market and analyze whether the financial assets have been transferred to the NHB in this way.
4. EMPIRICAL RESULT
4.1. Descriptive Statistics
4.1.1. Distribution of Spread
Figure 1 shows the bond spread (= pre-tax yield of NHB − after-tax yield of KTB) declining from September 2012 to September 2013. This phenomenon indicates that the demand for NHBs with large tax benefits has increased since the standard amount of CTFI was lowered in 2012. These results suggest that the demand for the NHB increased in the second half of 2012 due to many controversies over the proposed amendment to the tax law on the standard amount reduction of CTFI.
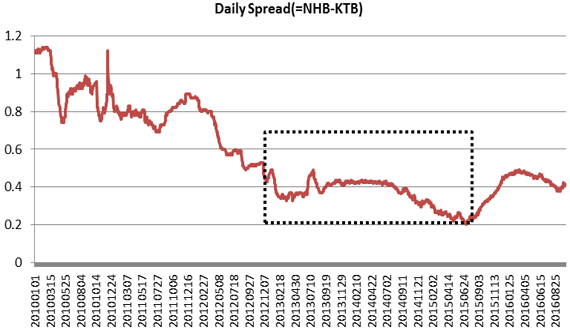
Figure-1. Daily bond spread (pre-tax yield of NHB- after-tax yield of KTB).
Source: Economic statistics system of Bank of Korea.
In addition, the trend of bond spread continued to decline after 2013, considering that a dressing effect exists at the end of each year. In other words, this phenomenon is empirical evidence that the pre-tax yield of the NHB is similar to the after-tax yield of KTB as because the demand for the NHB with large tax benefits increases.
Figure 2 shows the quarterly average spread of the volatility daily spread. An upward trend is observed until the third quarter in 2013 but then declines in the fourth quarter. This trend indicates that the demand for the NHB, which has a relatively large tax benefit, has increased as the debate on the standard amount reduction continues. Particularly, bond spreads increase again in the second and third quarters of 2013 due to limitations, such as bond maturity, which did not move quickly and were shifted after the standard amount cut.
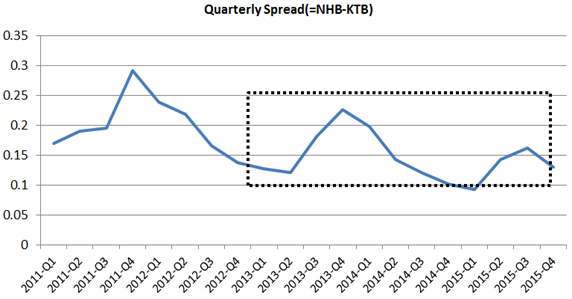
Figure-2. The quarterly average bond spread of the volatility daily spread.
Source: Economic statistics system of Bank of Korea.
Table-1. Trend of descriptive statistics of quarterly bond spreads.
Year-Quarter |
N |
Mean |
STD |
MIN |
MEDIAN |
MAX |
2011Q1 |
60 |
0.169 |
0.033 |
0.080 |
0.175 |
0.220 |
2011Q2 |
61 |
0.190 |
0.014 |
0.160 |
0.190 |
0.210 |
2011Q3 |
63 |
0.195 |
0.031 |
0.150 |
0.180 |
0.250 |
2011Q4 |
64 |
0.291 |
0.016 |
0.250 |
0.290 |
0.320 |
2012Q1 |
62 |
0.239 |
0.038 |
0.160 |
0.230 |
0.310 |
2012Q2 |
61 |
0.218 |
0.009 |
0.200 |
0.220 |
0.240 |
2012Q3 |
64 |
0.165 |
0.040 |
0.110 |
0.155 |
0.240 |
201204 |
62 |
0.137 |
0.023 |
0.090 |
0.140 |
0.170 |
2013Q1 |
61 |
0.127 |
0.015 |
0.100 |
0.120 |
0.160 |
2013Q2 |
62 |
0.121 |
0.012 |
0.100 |
0.120 |
0.140 |
2013Q3 |
62 |
0.181 |
0.025 |
0.130 |
0.170 |
0.240 |
2013Q4 |
63 |
0.226 |
0.016 |
0.196 |
0.224 |
0.256 |
2014Q1 |
61 |
0.197 |
0.036 |
0.138 |
0.201 |
0.243 |
2014Q2 |
60 |
0.143 |
0.021 |
0.103 |
0.154 |
0.166 |
2014Q3 |
62 |
0.121 |
0.005 |
0.109 |
0.121 |
0.132 |
2014Q4 |
63 |
0.102 |
0.015 |
0.070 |
0.101 |
0.142 |
2015Q1 |
60 |
0.092 |
0.012 |
0.069 |
0.091 |
0.118 |
2015Q2 |
62 |
0.143 |
0.043 |
0.082 |
0.151 |
0.204 |
2015Q3 |
63 |
0.162 |
0.023 |
0.119 |
0.161 |
0.194 |
2015Q4 |
64 |
0.130 |
0.023 |
0.087 |
0.126 |
0.164 |
Source: Economic statistics system of Bank of Korea.
Table 1 shows the trend of descriptive statistics of quarterly spreads. The average spread is 0.239% and 0.31% on average in the first quarter of 2012; it is the largest spread between the first quarter of 2012 and the fourth quarter of 2013, with an average increase of 0.226% and a maximum of 0.256% in the fourth quarter of 2013. The bottom of the spread, however, is from the fourth quarter of 2012 to the second quarter of 2013, which indicates the increase in demand for NHB.
The decline in the spread since October 2012 can be attributed to investors buying NHBs as incentives to reduce the tax burden. In addition, spreads decreased further from the first quarter of 2014, which indicates the continued preference for NHBs with large tax benefits.
4.1.2. Descriptive Statistics of Major Variables
Table 2 shows the descriptive statistics for the main variables before and after the reduction of the CTFI standard amount. The average of the spreads before the base rate reduction (Post2013 = 0) is 0.189%, whereas that after the reduction (Post2013 = 1) decreases to 0.164%, and the maximum of the spread decreases from 0.31% to 0.256%. Similarly, the median of the spread falls from 0.2% to 0.15%. Hence, the standard amount cut of CTFI affects the overall spread of NHB and NTB yields.
Table-2. Descriptive statistics of major variables.
Variables |
N |
Variables |
Mean |
STD |
Min |
Median |
Max |
Post2013=0 |
249 |
Spread |
0.189 |
0.051 |
0.090 |
0.200 |
0.310 |
Volume |
12.356 |
0.312 |
10.606 |
12.400 |
12.954 |
||
ISSUE |
8.620 |
1.203 |
4.205 |
8.788 |
11.724 |
||
Maturity |
8.988 |
1.019 |
5.991 |
9.042 |
11.783 |
||
KOSPI_Vol |
10.752 |
0.274 |
10.109 |
10.725 |
11.703 |
||
KOSPI_Index |
7.565 |
0.036 |
7.478 |
7.570 |
7.625 |
||
Yield_Curve |
-2.779 |
0.862 |
-4.605 |
-2.659 |
-1.273 |
||
Post2013=1 |
248 |
Spread |
0.164 |
0.047 |
0.100 |
0.150 |
0.256 |
Volume |
12.373 |
0.376 |
9.107 |
12.395 |
13.157 |
||
ISSUE |
8.580 |
1.357 |
2.996 |
8.770 |
13.137 |
||
Maturity |
9.017 |
1.173 |
3.219 |
9.096 |
11.916 |
||
KOSPI_Vol |
10.368 |
0.238 |
9.754 |
10.349 |
11.325 |
||
KOSPI_Index |
7.581 |
0.030 |
7.485 |
7.589 |
7.630 |
||
Yield_Curve |
-1.117 |
1.127 |
-4.604 |
-0.693 |
-0.273 |
Note1: Definition of Post2013 is "1" if January 2013 through December 2013, "0" otherwise.
4.2. Results of Regression Analysis
Table 3 shows the results of the analysis of the impact of the CTFI base rate cut on the spread of the difference between NHB and NTB yields. In the research model, the yield curve variable (Yield_Curve) is the NTB spread, which denotes the difference between NTB and CD yields. This variable is closely related to the NHB spread; thus, it is divided into model1 and model2 by including or excluding it from the research model. The sample is divided into a narrow window (2012–2013) and a wide window (2011–2014). The main interest variable Post is detailed in Post2013 (January 2013–December 2013) and is classified as Post2012.10–2014.3 (October 2012–March 2014).
First, as a result of analyzing the sample from 2012 to 2013, which is a narrow window, Post2013 has a statistically significant coefficient of − 0.044 (p < 0.01) in the analysis excluding Yield_Curve, whereas it is statistically significant in the analysis including Yield_Curve 0.013 (p < 0.1). Second, the coefficients of −0.073 (p < 0.01) and −0.059 (p < 0.01) are statistically significant when the Yield_Curve variable is excluded or included in the study model in Post2012.10–2014.3. Thus, the demand for the NHB, which has a short window but a large tax benefit, has increased, such that the NHB’s return is relatively smaller that of NTB. This result supports the hypothesis that the implicit tax is realized in the bond market after the CTFI’s standard amount cut. The results indicate that as the standard amount of CTFI is reduced, bond investors have increased their relative demand for NHBs with large tax benefits to avoid the increasing tax burden. Therefore, asset movements exist in the bond market by using tax exemption or reduced financial assets.
Volume (trading volume) and KOSPI_Vol (KOSPI trading volume) show statistically significant negative coefficients as a result of the analysis of control variables, and KOSPI_Index (KOSPI index) indicates statistically significant positive coefficient. This result implies that the more the trading volume of the bond is, the more the NHB purchase transaction is and the spread decreases. In addition, investment funds may move from the stock to the bond market. Yield_Curve (KTB yield − CD yield) shows a statistically significant positive coefficient, which indicates that the returns of KTB and NHB fluctuate in the same direction.
Table-3. Analysis of the bond spread before and after the cut of the CTFI standard: Narrow sample.
2012-2013 Sample |
||||
Model 1 |
Model 2 |
|||
Post2013 |
Post2012.10~2014.3 |
|||
Intercept |
−0.264 (0.487) |
−5.930*** (0.568) |
−0.724* (0.416) |
−3.770** (0.571) |
Post2013 |
−0.044*** (0.005) |
−0.013* (0.007) |
− |
− |
Post2012.10~2014.3 |
− |
− |
−0.073*** (0.004) |
−0.059*** (0.007) |
Volume |
−0.025*** (0.006) |
−0.017*** (0.006) |
−0.022*** (0.005) |
−0.011*** (0.006) |
ISSUE |
−0.002 (0.002) |
−0.005** (0.002) |
−0.002 (0.001) |
−0.004** (0.002) |
Maturity |
0.001 (0.002) |
0.001 (0.002) |
0.001 (0.002) |
0.001 (0.002) |
KOSPI_Vol |
−0.045*** (0.009) |
−0.017** (0.010) |
−0.063*** (0.007) |
−0.036*** (0.011) |
KOSPI_Index |
0.166** (0.065) |
0.819*** (0.073) |
0.249*** (0.055) |
0.601*** (0.071) |
Yield_Curve |
− |
0.015*** (0.002) |
− |
0.012*** (0.002) |
R2 |
0.381 |
0.435 |
0.381 |
0.544 |
Observation |
497 |
498 |
||
Note 1: ***, **, and * indicate statistically significant at the 1%, 5% and 10% two-tailed level, respectively.
Note 2: Definition of the variables is as follows:
Spread: The yield of the NHB–the yield of KTB.
Post: Period after CTFI reduction.
Post2013: "1" if January 2013 through December 2013, "0" otherwise.
Post2013.10~2014.3: "1" if it is October 2012 to March 2014, otherwise "0".
Volume: Natural logarithm of trading volume.
ISSUE: Natural logarithm of new bond issuance.
Maturity: Natural logarithm of expiration amount.
KOSPI_Vol: Natural log value of KOSPI trading volume.
KOSPI_Index: Natural logarithm of the KOSPI index.
Yield_Curve: KTB yield–CD yield.
In Table 4, which extends to the broad window (2011 to 2014), Post2013 shows statistically significant at −0.014 (p < 0.01) and −0.017 (p < 0.01), and Post2012.10–2014.3 is statistically significant at −0.067 (p < 0.01) and −0.053 (p < 0.01). This result is due to the increase in demand for NHBs that have large tax benefits. In other words, the demand for non-taxable financial instruments increases due to the announcement or enforcement of government policy related to the reduction of CTFI. This result can be interpreted as the occurrence of asset transfer from non-taxable financial products to general taxable financial products.
5. CONCLUSIONS
Financial income has a characteristic of capital gain and is a passive income relative to earned income. The tax burden of financial income in South Korea continues to be low compared with earned income. The same tax rate as earned income is applied to financial income over a certain amount through CTFI; however, financial income smaller than this standard amount (20 million KRW) continues to be lower than the earned income. The standard amount was lowered in 2013 from 40 million to 20 million KRW; however, numerous claims continue that academia and politics should raise the tax burden on financial income.
Table-4. Analysis of the bond spread before and after the cut of the CTFI standard: Wide sample.
2011-2014 Sample |
||||
Model 1 |
Model 2 |
|||
Post2013 |
Post2012.10~2014.3 |
|||
Intercept |
2.621***(0.302) |
−0.131 (0.363) |
2.988***(0.252) |
2.018***(0.347) |
Post2013 |
−0.014***(0.004) |
−0.017***(0.004) |
− |
− |
Post2012.10~2014.3 |
− |
− |
−0.067***(0.003) |
−0.053***(0.004) |
Volume |
−0.020***(0.005) |
−0.011***(0.005) |
−0.020***(0.004) |
−0.013***(0.004) |
ISSUE |
0.001 (0.001) |
0.001 (0.001) |
−0.001 (0.004) |
−0.001 (0.001) |
Maturity |
−0.002 (0.002) |
−0.004** (0.002) |
−0.001 (0.001) |
−0.003* (0.002) |
KOSPI_Vol |
0.011* (0.006) |
0.026***(0.007) |
−0.032***(0.005) |
−0.018** (0.007) |
KOSPI_Index |
−0.302***(0.037) |
−0.276 (0.048) |
−0.289***(0.031) |
−0.189***(0.044) |
Yield_Curve |
− |
0.005***(0.002) |
− |
0.004***(0.002) |
R2 |
0.098 |
0.054 |
0.376 |
0.219 |
Observation |
991 |
991 |
||
Note 1: ***, **, and * indicate statistically significant at the 1%, 5% and 10% two-tailed level, respectively.
Note 2: Definition of the variables is as note1 of Table 3.
Nevertheless, the tax authorities need to consider various factors that can be derived to increase the tax burden on financial income, that is, to be taxed at the same level as earned income. In other words, raising the tax burden level of financial income can result in the transfer of money in the financial market, the shift to specific financial products with tax benefits in the financial market, and equity problems in the financial sector.
Therefore, this study confirms that the yield of NHB with a large tax benefit is lowered due to the change of the standard amount in 2013. In other words, an implicit tax phenomenon occurred in the bond market due to the financial income tax reform.
This result implies that the tax reform had an economic impact on the bond market, although it was aimed at raising the tax burden level of financial income earners. Particularly, the reform increased the demand for NHBs, which have large tax benefits in the bond market (funds have shifted from other financial markets to bond markets), and the bond market increased sustainability.
The results of this study provide a policy implication as follows. When proceeding with a financial income tax reform, the negative effects must be minimized considering the economic impact on financial markets.
| Funding: This study received no specific financial support. |
| Competing Interests: The authors declare that they have no competing interests. |
| Acknowledgement: Both authors contributed equally to the conception and design of the study. |
REFERENCES
Atwood, T., 2003. Implicit taxes: Evidence from taxable, AMT, and tax-exempt state and local government bond yields. Journal of the American Taxation Association, 25(1): 1-20.Available at: https://doi.org/10.2308/jata.2003.25.1.1.
Berger, P.G., 1993. Explicit and implicit tax effects of the R & D tax credit. Journal of Accounting Research, 31(2): 131-171.Available at: https://doi.org/10.2307/2491268.
Blouin, J.L., A.R. Leslie and K.S. Jeri, 2016. Conflicting transfer pricing incentives and the role of coordination. SSRN Scholarly Paper ID 1609697. Rochester, NY: Social Science Research Network. Available from https://doi.org/10.1111/1911-3846.12375.
Bradley, S., D. Estelle and R. Leslie, 2015. Cross-country evidence on the preliminary effects of patent box regimes on patent activity and ownership. National Tax Journal, 68(4): 1047–1071.Available at: https://doi.org/10.17310/ntj.2015.4.07.
Bryant-Kutcher, L.A., D.A. Guenther and M. Jackson, 2012. How do cross-country differences in corporate tax rates affect firm value? Journal of the American Taxation Association, 34(2): 1-17.Available at: https://doi.org/10.2308/atax-10207.
Cho, K.K., 1996. Impacts of comprehensive taxation for financial income. Korea Economic Research Institute. (In Korean). Available from http://kiss.kstudy.com/thesis/thesis-view.asp?key=1945765 .
Chyz, J., L. LeAnn and S. Hannah, 2016. Implicit taxes of U.S. domestic and multinational firms over the past quarter-century. SSRN Scholarly Paper ID 2654840. Rochester, NY: Social Science Research Network. Available from http://papers.ssrn.com/abstract=2654840 .
Edwards, A. and T. Shevlin, 2011. The value of a flow-through entity in an integrated corporate tax system. Journal of Financial Economics, 101(2): 473-491.Available at: https://doi.org/10.1016/j.jfineco.2011.03.003.
Engel, E., M. Erickson and E. Maydew, 1999. Debt-equity hybrid securities. Journal of Accounting Research, 37(2): 249-274.Available at: https://doi.org/10.2307/2491409.
Erickson, M.M. and E.L. Maydew, 1998. Implicit taxes in high dividend yield stocks. Accounting Review, 73(4): 435-458.
Guenther, D.A., 1994. Earnings management in response to corporate tax rate changes: Evidence from the 1986 tax reform act. Accounting Review, 69(1): 230-243.
Huizinga, H., L. Laeven and G. Nicodeme, 2008. Capital structure and international debt shifting. Journal of Financial Economics, 88(1): 80-118.Available at: https://doi.org/10.1016/j.jfineco.2007.05.006.
Jennings, R., C.D. Weaver and W.J. Mayew, 2012. The extent of implicit taxes at the corporate level and the effect of TRA86. Contemporary Accounting Research, 29(4): 1021-1059.Available at: https://doi.org/10.1111/j.1911-3846.2012.01157.x.
Jung, W.-o. and H. Roh, 2004. Effects on bond returns of the global taxation of financial incomes in Korea. Korean Journal of Accounting Review, 29(3): 91-114.
Jung, W.O. and G. Yi, 2002. Evidence on the existence of implicit taxes in Korean bonds market. Korean Journal of Accounting Review, 27(4): 57–83.
Ki, E.S. and M.H. Hwang, 2014. The effects of a reduction in the threshold of global taxation on financial income on firms’ distribution policy. Korean Journal of Taxation Research, 31(3): 213–242.
Kim, J.C. and H.S. Roh, 2017. The extent of implicit taxes before and after the tax rate change. Korean Journal of Financial and Accounting Information, 17(3): 1–23.
Kim, K.S., 2000. The realization of implicit taxes and market barrier. Korean Journal of Accounting Review, 25(2): 27–49.
Kim, S.J., 2013. Implications and impacts of financial income tax reform in life insurance industry. KiRi Weekly Focus, 12–15. (In Korean). Available from http://kiss.kstudy.com/thesis/thesis-view.asp?key=3244005 .
Kim, Y.D. and B.H. Seo, 2013. Analysis of money-move among financial sectors in Korea. Korea Institute of Finance. Available from http://kiss.kstudy.com/thesis/thesis-view.asp?key=3187496 .
Klassen, K. and D. Mescall, 2012. Investor taxes and equity pricing: Using income trusts in a crosssectional analysis. Canadian Tax Journal, 60(3): 533-566.
KNABO, 2012. Finance analysis and economic projection for FY2013 and long-medium term. (In Korean). Available from https://www.nabo.go.kr/Sub/04Etc/04_Search.jsp?query=2013+%EC%A4%91%EC%9E%A5%EA%B8%B0+%EC%9E%AC%EC%A0%95 .
Ko, J.K., 1996. Empirical analysis of implicit taxes. Korean Journal of Taxation Research, 8: 277–300.
Korea National Assembly Budget Office, 2012. Finance analysis and economic projection for FY2013 and long-medium term. (In Korean). Available from https://www.nabo.go.kr/Sub/04Etc/04_Search.jsp?query=2013+%EC%A4%91%EC%9E%A5%EA%B8%B0+%EC%9E%AC%EC%A0%95 .
Lee, J.K. and T.H. Lee, 1997. Empirical analysis of implicit taxes caused from tax benefits. Korea Institute of Public Finance. Available from http://www.kipf.re.kr/Publication/B/조세혜택으로-인한-내재적-조세의-실증연구/87 .
Mankiw, N.G. and M.P. James, 1996. Stock market yields and the pricing of municipal bonds. Working Paper 5607. National Bureau of Economic Research. Available from http://www.nber.org/papers/w5607 .
Park, H.J. and R.Y. Jung, 2014. A study on the general taxation of financial income-focused on the influence of standard amount reduction. Hongik Law Review, 15(3): 603–633.Available at: https://doi.org/10.16960/jhlr.15.3.201409.603.
Park, J.S., 2016. Improvement and problem of financial income taxation using line drawing. Korean Economic & Financial Review, 25(2): 3–9.
Park, Y.I. and J.H. Nho, 2001. An analysis on the global taxation of financial income and the improvement of tax legislation. Journal of Industrial Economics and Business, 13(6): 557–573.
Roh, H.S. and J.C. Kim, 2016. A study on the measurement of corporate implicit taxes. Accounting Information Review, 34(1): 163–182.
Salbador, D.A. and V.P. Vendrzyk, 2006. An examination of the relations among tax preferences, implicit taxes, and market power in a noncompetitive market. Journal of the American Taxation Association, 28(2): 47-67.Available at: https://doi.org/10.2308/jata.2006.28.2.47.
Scholes, M.S., M.A. Wolfson, M.M. Erickson, M. Hanlon, E.L. Maydew and T.J. Shevlin, 2014. Taxes & business strategy. 5th Edn., Boston: Prentice Hall.
Stock, J.H. and M.W. Watson, 2002. Forecasting using principal components from a large number of predictors. Journal of the American Statistical Association, 97(460): 1167-1179.Available at: https://doi.org/10.1198/016214502388618960.
Wilkie, P.J., 1992. Empirical evidence of implicit taxes in the corporate sector. The Journal of the American Taxation Association, 14(1): 97-116.
Won, S. and K.B. Lee, 2007. Characteristics of the corporate bond market and the determinants of credit spread. Journal of Money & Finance, 21(2): 83-115.
Views and opinions expressed in this article are the views and opinions of the author(s), Asian Economic and Financial Review shall not be responsible or answerable for any loss, damage or liability etc. caused in relation to/arising out of the use of the content. |