


USING DEA AND MALMQUIST PRODUCTIVITY INDEX TO ANALYZE THE OPERATIONAL EFFICIENCY OF TAIWAN BIOTECHNOLOGICAL INDUSTRY

Distinguished Professor, Graduate Institute of International Business, National Taipei University, Taiwan
ABSTRACT
This study employs data envelopment analysis (DEA) method and Malmquist productivity index (MPI) to reexamine the change of operational efficiency for both individual firm and whole biotechnological industry. Concerning the whole industry, lower efficiency of the industry is mostly caused by pure technological inefficiency. When applying the sense of total factor productivity (TFP) index, the changes of TFP in biotechnological industry is most accounted for the efficiency changes rather than technological charges. These results benefit to biotechnology industry managers and regulators through the provision of useful guidelines for management control within the competitive biotechnological industry and market.
Keywords:Data envelopment analysis, Malmquist productivity index., Biotechnological industry, Operational efficiency, Total factor productivity.
JEL ClassificationL6; O1; O3; O4.
ARTICLE HISTORY: Received:25 April 2017 Revised:12 May 2017Accepted:30 May 2017Published:5 July 2017
Contribution/ Originality:: This study contributes in the existing literature with employing DEA and MPI to reexamine the change of operational efficiency for biotechnological industry in Taiwan. Concerning the whole industry, lower efficiency of industry is mostly caused by pure technological inefficiency. The changes of TFP is mostly accounted for the efficiency changes.
1. INTRODUCTION
Biotechnological industry is promising a knowledge intensity industry, which is characterized by the large capitals, high-quality talents, high levels of reward and profit for R&D activities. At all levels of the technology sector, one hears that biotechnological companies can and should be held accountable for the R&D efforts they provide (Chiesa and Toletti, 2003). In the 1980s, a push for accountability was undertaken in biotechnological companies in the United States and all biotechnological companies faced the task of allocating scarce R&D resources among high risk, high return R&D activities. Biotechnological companies have been concerned with efficiency and current tight economic conditions have further highlighted the importance of that concern. In 1982, the Taiwan government declared its Technology Industry Establishment Promotion Decree and shed more light on the biotechnological industry and/or markets further, as the critical development industry in Taiwan. Government has also first included the biotechnological industry into the ten emerging focus industries since 1998 in Taiwan. And under this circumstance, Taiwanese biotechnological industry started developing in a bid to increase operational efficiency, and to pull more funds into the invested supply market. The reason was that there was market orientation with this demand of uplifting life quality and reducing financial uncertainty. Taiwan’s biotechnology companies have also faced the accountability issue in the 2000s and administrators have brought about some revolutionary changes.
In addition, this paper is to provide an acceptable measure of biotechnology industry efficiency in Taiwan during the shocks of the crisis of subprime mortgage and financial tsunami in the period 2007-2010. After the crisis of subprime mortgage and financial tsunami, no bankruptcy of banks occurred in Taiwan, indicating that the impact of the crisis of subprime mortgage and financial tsunami on Taiwanese banks has been relatively slight. However, this does not mean that Taiwan’s biotechnological industry structure remains problem-free for the foreseeable future. Thus, it is an appropriate time to quantify, and also to explain, the anticipated different types of efficiency among biotechnology companies, since we believe that efficiency will become a strategic variable in tackling the increasing competitive pressure and structural changes within the biotechnological industry.
A biotechnology company may be viewed as an enterprise in which the professional staff provides the operating conditions for converting quantifiable resources (inputs) into patents and revenues (outputs). That is to say, R&D expense constraints ensure that there is only so much money available, and whether or not there is a price tag attached, we need to choose among competing options. Now and then, there have been efforts to improve efficiency in biotechnology companies. The efficiency of biotechnology companies is a critical issue in technology industry development.
Morrison and Siegel (1998) assessed the impacts on external R&D performance of food-processing industry of both suppliers’ pricing decisions and workers’ adoption of biotech materials. They distinguish high-tech from other capital use and include a measure of high-tech capital in the whole sector to reflect other knowledge spillover effect s by way of hedonic analysis. Morrison (2003) further established the determinants and implications of the observed performance in the high-tech industry of agriculture biotech and food processing industries. Chiesa and Toletti (2003) also investigated the R&D cost and led revenue in US biotech (in particular of genomics, proteomics, pharmaceutical and bioinformatics industry) in order to analyze the factors to the R&D performance of the bio-tech industry. They found that there is a technology push factor related to the development of biotechnology and, the demand pull related to the growing R&D performance required by the market. Verma and Sinha (2002) developed a theoretical framework for understanding the interdependencies between project and their relationship to project performance, based on the Fortune 500 high-tech manufacturing firm, in a multiple-concurrent R&D environment.
Niosi and Banik (2005) work was based on 90 Canadian-based publicly quoted biotechnology companies. They found that the companies located in regional agglomerations grow faster than isolated in regional ones, and biotech companies spun-off from universities have a better performance than that of start-ups. Finally, Chen and Yeh (2005) applied DEA to analyze the comparative performance of six high-tech industries currently developed in Taiwan. The results indicate that semiconductor and computer industries have the best performance, while the biotech operates at a worst level. In detail, the biotech industry reveals a lowest average scale efficiency scores, but a highest pure technical efficiency scores among the six industries. Yang et al. (2009) estimated MPI of the Taiwanese biotech and biopharmaceutical industry in 2004-2007 periods. Empirical results showed a productivity improvement of 7.17% during this period, which was mainly due to the cost saving in allocative efficiency and the improvement in cost scale efficiency.
We employ DEA and MPI to calculate the cost efficiency and measure the technical efficiencies and their dynamic changes of 18 biotechnological companies in this paper. We take the role of resource manager and recognize that resources are scarce and we cannot afford to waste them (Chen and Ali, 2002). We want biotechnology companies to be productive so that they can provide better service in light of constraints and attract more investors. Given the circumstances, we argue that the DEA and MPI are the mathematical models designed especially for application to research-oriented institutions like the biotechnology companies. There are three reasons: Firstly, the DEA model is able to derive a single aggregate score which indicates the performance status of each biotechnology companies relative to a designated group of peers. Secondly, the DEA model is capable of identifying any perceived slacks in input used or output produced, and provides insight on possibilities for increasing outputs and/or conserving inputs in order for an inefficient biotechnology companies to become efficient. Thirdly, DEA method is extended to measure Malmquist index of total factor productivity and a decomposition of TFP measures revealed whether the performance of factors productivity is due to technological change or technical efficiency change.
The main purpose of this paper is to measure and evaluate the resource utilization efficiency of biotechnological companies in Taiwan. The results of this study can helpfully provide useful information and suggestions to promote the development of Taiwan’s biotechnological industry. The reminders of this paper are organized as follows. Section 2 presents a review of the relevant literature. Section 3 describes the methodology of the DEA and Malmiquist Productivity Index. Section 4 describes the data employed and its characteristics. Section 5 presents the empirical results. The paper then provides the concluding remarks in section 6.
2. LITERATURE REVIEW
Since some important literatures related DEA have been discussed, here we briefly review the main related literature about Malmquist Total Factor Productivity (TFP) analysis. In contrast to DEA efficiency scores are calculated not only for a single year but for several years and efficiency change rates can be determined. Early studies on productivity are based on factor productivities such as labor productivity or capital productivity. Over the time, studies started to focus on TFP because it reflects the effectiveness of whole inputs as well as the technological change. The importance of the frontier approach arises from its availability to express TFP by the combination of several different components. Nishimizu and Page (1982) decomposed TFP growth into two components, namely technical efficiency change and technological progress. As a result, the differences in TFP growth rates of countries have been used to explain the determinants of economic advancement. Since the developing countries look for ways to get to the level of economic prosperity as high as the developed countries, many studies use TFP as the main tool to determine the sources of economic growth.
TFP growth has been studied extensively by many researchers as it is considered to be one of the most important factors of rapid growth in many areas of studies. Young (1992) studied the TFP growth in Hong Kong economy for the time period 1961 to 1986 and estimated an average TFP growth rate of 0.34. Edwards (1998) extended the previous studies by using a panel of 93 developing and developed countries during 1980-90. He shows evidence of an average growth rate of 0.3%. He also constructs a new openness index in order to understand the relationship between TFP and trade orientation. Furthermore, Miller and Upadhyay (2000) study also focused on 83 developing and developed countries from 1960 to 1989 with a fixed effects approach. They rank the countries according to their TFP growth performances and Turkey is in the 50th.
Mahadevan (2002a) measured TFP growth in food, chemical, textile and fabricated metal industries over the period 1980 to 1994 in South Korea. She used the stochastic frontier approach and found that productivity is the main driver of output growth. She also concludes that the increase in export affects TFP growth positively and the technical efficiency change is positive except for the food and textile industries. In another study, Mahadevan (2002b) applied DEA technique using the dataset that covers 28 sub‐sectors of Malaysian manufacturing industry between 1981 and 1996. She reported that the source of TFP growth is technical efficiency change rather than technological progress.
Liu and Wang (2008) also employed data envelopment analysis (DEA) to measure the Malmquist productivity of semiconductor packaging and testing firms in Taiwan from 2000 to 2003. They measured Malmquist productivity which includes three components: the measurement of technical change, the measurement of the frontier forward shift, and the measurement of the frontier backward shift of a company over two consecutive periods. The result not only reveals patterns of productivity change and presents a new interpretation along with the managerial implication of each Malmquist component, but also identifies the strategy shifts of individual companies based upon isoquant changes. Hsieh and Klenow (2009) examined the effects of resource misallocation on TFP and compares India and China with the US. Their findings suggested that if India and China reached the US efficiency level through reallocation of capital and labor to equalize marginal products, China would enjoy TFP gains of 30% to 50% and India would experience a greater gain from TFP, i.e. 40% to 60%.
Recently, Singh and Singh (2012) analyzed the rate of total factor productivity growth and technical progress of Indian Agriculture between the period 1971 to 2004, using Malmquist Productivity Index. The decomposition of productivity growth into efficiency change and technical progress reveals that the efficiency change is positively contributing towards the growth of productivity whereas, the negative growth of technology restrict the potential productivity growth in Indian agriculture. Neupane (2013) investigated the changes in efficiency and productivity of banking industry during the period of 2007/08 to 2011/12 and analyzed the effects of various indicators on the efficiency of the twenty two commercial banks in Nepal. Malmquist Index is used as to measure the efficiency and productivity where as Tobit regression is used as to analyze the determinants of efficiency. Overall, the results show that the productivity change of commercial banks in Nepal has improved over the sample period and that the increase in productivity change in Nepalese commercial banks is due to the technical progress rather than efficiency components. It also reports that the decline in efficiency change is due to decline in both pure efficiency change and scale efficiency change. Bassem (2014) tries to investigate productivity changes of 33 Middle East and North Africa microfinance institutions over the period of 2006–2011 by also using the Malmquist productivity index (MPI) method but a balanced panel dataset of 198 observations. The empirical findings indicate that the microfinance industry has reported overall productivity regress in the study period even though all the MENA MPIs have positive TFP growth with the exception of the year 2010–2011. For above articles, by decomposing the Malmquist index, the results showed that during the study period their case studies have experienced mainly an increment of pure technical efficiency or technical progress (improvement in management practices) rather than an improvement in optimum size. Recently, Zhang et al. (2016) tried to evaluate the total factor productivity (TFP) growth of 30 provinces in China by adopting the Malmquist-Luenberger (ML) and traditional Malmquist (M) productivity index as well as incorporating undesirable outputs from 2011–2014. The results show that the average annual growth of the ML productivity index was lower than that of the traditional M productivity index growth during the research period. The findings also reveal that the true TFP growth in China will be overestimated if undesirable outputs are ignored. Technical changes are the main contributor to TFP growth. There are huge regional disparities of productivity growth in China.
Basically, previous literature has well documented that DEA is suitable method allowing the economic performance of firms to be assessed. A notable strength of DEA is that it allows for the consideration of multiple inputs and outputs while not requiring identical units. In contrast to DEA efficiency scores are calculated and efficiency change rates can be determined. The Malmquist productivity index (MPI) have gained considerable popularity in past couple of years due to its appealing feature of allowing a further decomposition of productivity variation and detect whether the performance of factors productivity is due to technological change or technical efficiency change. This satisfies our paper to assess the cost efficiencies of biotechnological companies in Taiwan, and to identify the sources of TFP to be managed for achieving performance improvements. Following this lead, we propose a methodology that allows to estimate the efficiency and productivity of biotechnological firms in Taiwan.
3. METHODOLOGY
3.1. Data Envelopment Analysis
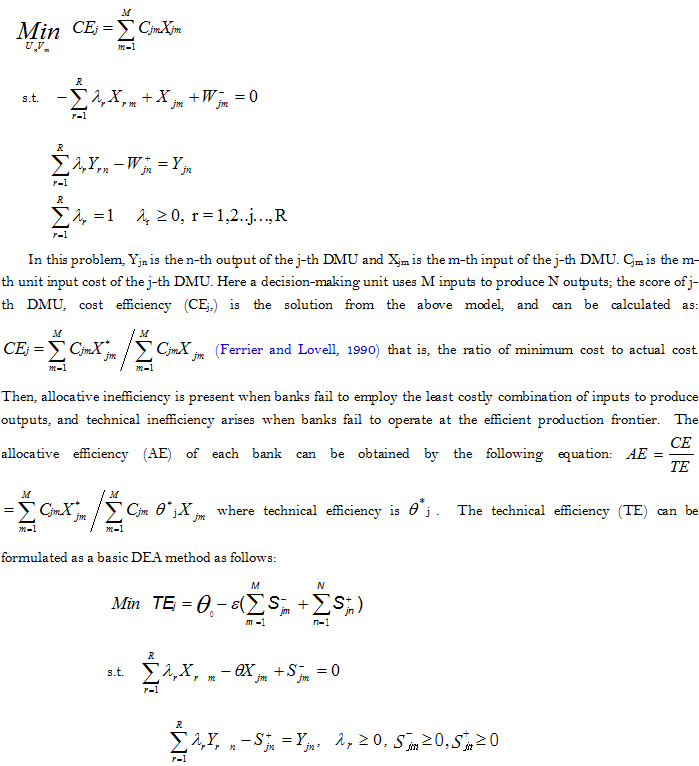
In DEA approach, the efficiency concept is Farell (1957) productive efficiency, as extended by Fare et al. (1985). Our study deals with three definitions of efficiency: cost efficiency, allocative efficiency, and technical efficiency. We assume a convex reference technology, strong disposability of inputs and outputs. The disposability assumptions imply that an increase in inputs never results in a decrease in outputs, and that any reduction in outputs remains possible with the same amount of inputs. In DEA model, the piecewise linear frontiers are constructed by employing mathematical programming techniques, first described by Charnes et al. (1978) (CCR model) and later extended by Banker et al. (1984) (BCC model). The CCR and BCC models do not relate to price information, and only engages input and output quantities. If the input price is known, the cost efficiency (CE) of each bank may be calculated by solving CEj of linear programs of the form:
3.2. The Malmiquist Productivity Index
We further employed the Malmquist total factor productivity (TFP) index to measure the effect of productivity change on the panel data, a method first developed by Caves et al. (1982). Later on, an output-based Malmquist productivity change index was developed by Fare et al. (1994) and Fare et al. (1994). Kim and Gwangho (2001) extended the application of a decomposition of total factor productivity growth in Korean manufacturing industries. In this model an index M01, representing the productivity of the production point (X1, Y1) relative to the production point (X0,Y0), was shown as:
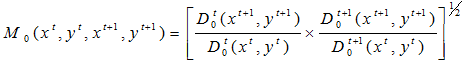
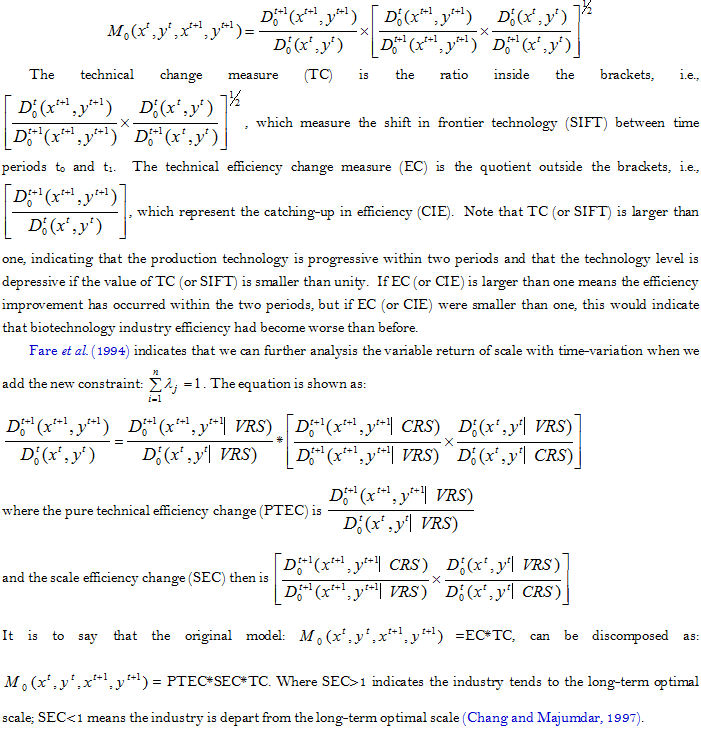
This index is, in fact, the geometric mean of two output-based Malmquist TFP indices. Next, a magnitude which is greater than unity will represent positive TFP growth from period t0 to period t1. In addition, we assume that the distance functions are translog form with identical second order terms and that the technology is piece-wise linear which allows for inefficiencies. Following Fare et al. (1992) the above index can be broken down into two components, that is, technical change measure and technical efficiency change measure. The above equation can be rewritten thus:
4. DATA EMPLOYED AND ITS CHARACTERISTICS
We employ the institution function of the firm in this paper, which is in line with the competitive biotechnology industry environment in Taiwan. This can also effectively benefit firm operations and improve biotechnology firm’s efficiency. In accordance with this approach, we specify three types of firm output, namely the net business revenues (business revenues after the tax), sales revenues, and intellectual property rights (including patents revenue and admission fees, and other business revenues). The first two types of output constitute the main activities of biotechnology firms; with the last representing an extra source of revenue for firms (Chiesa and Toletti, 2003). The input measures based on the above output entail operating resources. We select the following four input factors: number of staff’s employed, firm assets, the cost of equipment and instrument, and the R&D expenses.
It should also be noted that the net business revenues is the net profit of sales revenues, net profit being their main element. One of these needs to be excluded in order to avoid a multi-collinearity problem in the DEA model. The results of our correlation analysis also support the high correlation phenomenon between the net business revenues and sales revenues, with a correlation coefficient of 0.879. We then choose the net business revenues for the further analysis.
Next, we determine the relationships between inputs and outputs. The DEA model requires definitions of inputs and outputs so that when inputs are added, outputs will increase. We employ a correlation analysis to test for isotonicity (i.e., the positive direction of the relationship between inputs and outputs). According to the results of the inter-correlation analysis, it is clear that the correlation coefficients between our chosen outputs and inputs are all positive.
We have further utilized sensitivity analysis to determine the appropriate inputs/ outputs in accordance with this approach (Golany and Roll, 1989). The basic efficiency model is the given model, and the remaining four rival cases, i.e., deleting one of the input items, are used in our sensitivity analysis in order to capture various aspects of technical efficiency. We find that the high correlation coefficient of efficiency between the rival model and the base model (all larger than 0.85) indicates that the new combinations may have a minor effect on the results. In addition, the average technical efficiency in base model is similar to the four rival models (all ranges from 0.55 to 0.62), suggesting that the base model is not worse to the various rival models in discriminating between companies. The similar results are occurred when the minimum efficiency score is compared (all ranges from 0.12 to 0.17) and the number of efficient companies is selected. Thus, deleting the inputs item of companies to the model has a less important effect on the results and we do not need to consider the rival models.
Thus, we specify two types of firm output, namely net business revenues and intellectual property rights. Four types of input, namely number of staff employed, firm assets, the cost of equipments and instruments, and the R&D expenses are also included. There is some advantage in keeping the number of inputs [M] and outputs [N] small, relative to the number of banks [R]. As the ratio (M+N)/R rises, the ability to discriminate between banks in the DEA model falls significantly, and many banks will become efficient. As to the input cost, the price of staff is derived by dividing the total expenditure on employees into the total number of staff. The price of equipments/instruments is a proxy and is derived by dividing total costs of equipments/instruments into the book value of fixed assets (equipments/instruments). The price of assets is a proxy and is obtained by the interest level. Dividing the sum of R&D expenses into net business revenues derives the price of R&D expenses Verma and Sinha (2002).
The official report from the Taiwanese Commission on National Corporations of the Ministry of Economic Affairs provides a rich source of data on the operations of all of Taiwan’s biotechnology industry. We have gathered the requisite data for 18 companies, and which represents 90 per cent of the domestic companies in Taiwan, covering the period 2005 to 2015. It should be noted that we choose the time span of 2005 to 2015 because Taiwan government recently still strongly emphasize that the biotechnological industry is one of the five most important industries in Taiwan. In this study, promotional performance in this near 10-year period is evaluated. In addition, we would like to examine the impact effects on the operational efficiency in Taiwan biotechnological industry during the period of the crisis of subprime mortgage and financial tsunami.
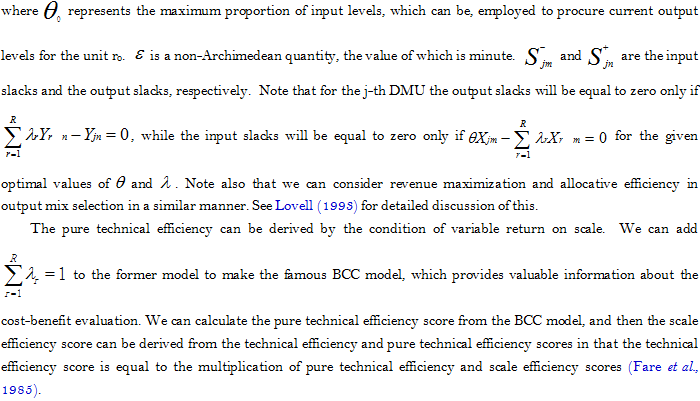
Literature affirms the assumption that most firms operate with variable returns to scale rather than constant returns to scale, hence it is considered practical to present CRS as well as VRS results to add richness of the analysis. While the basic DEA models use CRS and VRS formulations, they are static in time, hence leading to the criticism that this is a case of comparing statics. This criticism can be ameliorated by using longitudinal data and the Malmquist productivity index (MPI).The MPI measures the productivity changes in a DMU between two time periods. It requires panel data on inputs and outputs, and the analysis provides values for total factor productivity (TFP). The output based Malmquist index is defines as the product of the technical change (T) and the technical efficiency (E) change. The technology change (T) can be understood to be shifts in the efficiency frontier, while the technical efficiency (E) can be understood as the movement or catch up of the DMU towards the efficiency frontier in a particular time period.
5. EMPIRICAL RESULTS AND ANALYSIS
The cost efficiency score analysis shows that one biotechnology company is relatively efficient, and her efficiency score is equal to 1.0000. The technical efficiency score analysis also shows that six biotechnology companies are relatively efficient. This shows that the resource utilization of these biotechnology companies is functioning well. In order to interpret the contents of efficiency, more discrimination among the six biotechnology companies was undertaken.
As shown in Table 1, we can observe that the calculated mean cost efficiency between 2005 and 2015 was 0741. Relative to their cost frontier, biotechnology companies operated efficiently with actual costs ranging from 61% to 72% above the minimum cost levels. As to the cost efficiency score (CE) in each year, we then find that it was 0.761 in 2006, with a gentle increase to 0.778 in 2007, and 0.781 in 2008,but decrease to 0.724 in 2009 and 0.710 in 2010. It is clear that average cost efficiency worsened in 2010 relative to 2008, since that 2007 was the year that the crisis of subprime mortgage and financial tsunami hit Taiwan’s technological industries. It may show that the subprime mortgage and financial tsunami promises to have a short-run shock effect to undermine the cost efficiency in Taiwan’s biotechnology companies. However, after 2012, cost efficiencies have become better, the score 0.828 in 2013 and 0.857 in 2014. Concerning the individual firms, there are six firms involved in the strong technical efficiency and/or pure technical efficiency units; however, ten firms located in the inefficiency units (Table 2).
Under the cost efficiency score (CE) equals the product of the technical efficiency (TE) and the allocative efficiency (AE) scores, and the relative magnitudes of these scores provide evidences of the sources of the inefficiencies. We can find that the mean technical efficiency scores of biotechnology companies (0.853) are lower than the mean allocative efficiency score (0.867) during the 2005-2015 period. This seems to suggest that technical inefficiency has greater significance than allocative inefficiency as a source of inefficiency within all inefficient biotechnology companies.
Table-1. Efficiency Evaluation Results of Biotechnological Firms During 2005-2015
Firm name |
TE |
PTE |
SE |
AE |
CE |
China |
1 |
1 |
1 |
0.882 |
0.882 |
Grape King |
0.798 |
0.875 |
0.912 |
0.742 |
0.592 |
Sinon |
0.705 |
0.705 |
1 |
0.908 |
0.64 |
Ho-Tung |
1 |
1 |
1 |
0.814 |
0.814 |
Yung-Shin |
0.844 |
0.892 |
0.946 |
0.884 |
0.746 |
Standard |
0.904 |
1 |
0.904 |
0.914 |
0.763 |
Pihsiang |
0.737 |
0.805 |
0.915 |
0.694 |
0.511 |
ApexBio |
0.697 |
0.768 |
0.907 |
0.892 |
0.622 |
Sinphar |
0.972 |
1 |
0.972 |
0.978 |
0.759 |
Yung-Zip |
0.883 |
0.906 |
0.975 |
0.899 |
0.794 |
Microlife |
1 |
1 |
1 |
0.798 |
0.798 |
Enfield(Excelsior ) |
0.996 |
1 |
0.996 |
0.694 |
0.688 |
TTY |
1 |
1 |
1 |
0.915 |
0.915 |
Apex |
1 |
1 |
1 |
1 |
1 |
Bioteque |
0.793 |
0.872 |
0.909 |
0.875 |
0.694 |
Chia-Jei |
1 |
1 |
1 |
0.789 |
0.789 |
Maywufa |
0.802 |
0.802 |
1 |
0.801 |
0.652 |
Chi-Sheng |
0.797 |
0.871 |
0.915 |
0.875 |
0.697 |
Average |
0.853 |
0.901 |
0.946 |
0.867 |
0.741 |
Notes: TE= technical efficiency; PTE=pure technical efficiency;
SE= scale efficiency; AE= allocative efficiency;
CE=cost efficiency score
Table-2. Efficiency Evaluation Results During 2005-2015
Efficiency |
Number |
Percentage |
|
Technical Efficiency = 1 ; |
Pure Technical Efficiency = 1 |
6 |
33.33% |
Technical Efficiency < 1 ; |
Pure Technical Efficiency = 1 |
2 |
11.11% |
Technical Efficiency < 1 ; |
Pure Technical Efficiency < 1 |
10 |
55.56% |
Total |
18 |
100.00% |
|
Thus, given input prices, the effects on cost inefficiency could be attributed to the under-utilization of inputs, rather than the incorrect choice of the initial input combinations. Similar results can be found when TE and AE scores of the particular year are analyzed. The TE score of 0.848 in 2015, was lower than the 0.853 in the year 2005 to 2015, while the AE score of 0.842 in 2015 was also lower than the 0.867 score during the period 2005 to 2015. We also find that the mean scale efficiency score of 0.891 in 2015 was slightly lower than that of 2005, at 0.901 and 0.941 during the period 2005-2015. Similar results can be found when periods of data are used for 2005 or 2015 with the respective mean allocative efficiency scores (0.833; 0.851) being lower than the respective mean technical efficiency scores (0.852; 0.868) based on our estimation.
Based on the technical efficiency measure, pure technical efficiency and scale efficiency can be further measured. We find that the mean of pure technical efficiency (0.901) is lower than the mean of scale efficiency (0.946) for the period 2005-2015, suggesting that the pure technical factor plays a more important role than the factor of scale in explaining the source of technical inefficiency within inefficient biotechnology companies. That is to say, for technical inefficiency within the biotechnology companies can be attributed to under-utilization of inputs, rather than inappropriate returns of scale or the selection of incorrect input combinations.
Furthermore, in the classification of biotechnological firms, agriculture biotechnological industry and biotechnological service industry have lower scale efficiency while other has lower pure technological efficiency (Table 3). Lastly, in the case of slack variable analysis, in order to improve the operational efficiency, the firm needs to reduce the factor cost of machine and equipment.
Table-3. Efficiency Score of the Classification of Biotechnological Firms During 2006-2015
Classification |
TE |
PTE |
SE |
Medical products |
0.787 |
0.862 |
0.914 |
Special chemical products and foods |
0.802 |
0.874 |
0.918 |
Agricultural biotechnological industry |
0.942 |
0.972 |
0.969 |
Medical instruments |
0.898 |
0.954 |
0.942 |
Biotechnological service industry |
0.834 |
0.895 |
0.932 |
Notes: TE= technical efficiency; PTE=pure technical efficiency;
SE= scale efficiency.
The short-term evolution of technical efficiency for a biotechnology company is also a critical factor in efficiency analysis. This study has also conducted a six-year longitudinal analysis to provide some evidence for this. Table 4 shows the results. The average Malmquist productivity index of the whole biotechnology companies is 1.089 during the period 2005-2015, representing a slightly increase in the productivity. In analyzing the components of the Malmquist productivity index, we find that the average technical change index (TC) number is 1.046 and the technical efficiency change index (EC) number is 1.042. This implies that most of the growth in biotechnology company productivity in that year stemmed from technical progress and computerization. Taiwan’s biotechnological industries/markets are highly competitive and the biotechnology company’s production technology is obvious growth. On the other hand, the improvement index for technical efficiency is 1.046, showing that the technology in inefficient biotechnology companies has not obvious improved. It is as much to say that the growth in biotechnology company productivity has not significant occurred and can be attributed to improvements in production technology, rather than to cost savings in management. As indicated that the last column in Table 4, it was found that the mean efficiency change number (EC) of that of 2006-2015 (1.042) is lower than that of 2013-2014 (1.051), and 2014-2015(1.044). This result is similar to that of the technical change number (TC) data. These results confirm again that there is a lower efficiency improvement within 2006-2015than that of 2013-2014 and 2014-2015.
Table 4. Malmquist Productivity Index of Whole Biotechnological Industry During 2005-2015
Year |
EC |
TC |
PTEC |
SEC |
TFP |
2005-2006 |
1.071 |
1.116 |
0.962 |
1.088 |
1.066 |
2006-2007 |
1.016 |
1.017 |
0.958 |
1.03 |
1.009 |
2007-2008 |
1.045 |
1.05 |
1.058 |
1.077 |
1.098 |
2008-2009 |
1.038 |
1.042 |
1.012 |
1.022 |
1.081 |
2009-2010 |
1.031 |
1.035 |
0.983 |
1.068 |
1.067 |
2010-2011 |
1.035 |
1.041 |
0.99 |
1.045 |
1.077 |
2011-2012 |
1.043 |
1.05 |
1.022 |
1.051 |
1.095 |
2012-2013 |
1.048 |
1.054 |
0.993 |
1.031 |
1.105 |
2013-2014 |
1.051 |
1.048 |
0.998 |
1.041 |
1.101 |
2014-2015 |
1.044 |
1.05 |
0.999 |
1.046 |
1.097 |
Average |
1.042 |
1.046 |
0.997 |
1.05 |
1.089 |
Notes: EC= technical efficiency change; TC= technical change; PTEC= pure technical efficiency change; SEC= scale efficiency change; TFP= Malmquist total factor productivity.
Among 18 biotechnology companies, the individual Malmquist productivity index of each firm is listed in Table 5. And, Table 6 is the explaining results of Malmquist productivity index. We find that the variations in technical efficiency change are not quite large. There are three reasons which may account for this. Firstly, many new employees are needed when a new biotechnology company is established. Since the new biotechnology companies may recruit talented biotechnology company staff from other biotechnology companies rather than train up inexperienced personnel themselves, the established biotechnology companies take steps to ensure their staff do not stray and thereby disrupt business (Donthu and Boonghee, 1998).
Table-5. Malmquist Productivity Index of Each Biotechnological Firm During 2005-2015
Firms |
EC |
TC |
PTEC |
SEC |
TFP |
China |
1.042 |
1.035 |
0.895 |
0.995 |
1.125 |
Grape King |
1.036 |
1.048 |
1 |
1.075 |
1.148 |
Sinon |
1.038 |
1.029 |
1.04 |
1.034 |
1.098 |
Ho-Tung |
1.002 |
1.015 |
1.055 |
1.032 |
1 |
Yung-Shin |
0.972 |
1.015 |
0.895 |
1.118 |
1.002 |
Standard |
1.015 |
1.022 |
0.946 |
1.038 |
1.039 |
Pihsiang |
0.971 |
1.019 |
0.942 |
1.061 |
1.001 |
ApexBio |
1.395 |
1.034 |
0.949 |
1.075 |
1.425 |
Sinphar |
0.975 |
0.956 |
0.948 |
1.009 |
0.962 |
Yung-Zip |
0.907 |
1.002 |
1.095 |
0.871 |
0.908 |
Microlife |
1.031 |
1.048 |
1.02 |
1.031 |
1.021 |
Enfield(Excelsior ) |
1.025 |
1.087 |
1.038 |
1.051 |
1.081 |
TTY |
1.038 |
1.098 |
1.037 |
1.035 |
1.146 |
Apex |
1.081 |
1.082 |
1.095 |
1.078 |
1.088 |
Bioteque |
1.142 |
1.149 |
0.979 |
1.144 |
1.308 |
Chia-Jei |
1.071 |
1.054 |
1.066 |
1.075 |
1.025 |
Maywufa |
0.964 |
0.932 |
1.031 |
0.925 |
0.921 |
Chi-Sheng |
1.076 |
1.095 |
1.154 |
0.934 |
1.185 |
Average |
1.042 |
1.04 |
1.01 |
1.032 |
1.082 |
Notes: EC= technical efficiency change; TC= technical change;
PTEC= pure technical efficiency change; SEC= scale efficiency change; TFP= Malmquist total factor productivity
One upshot of this is increased salaries, which can push up the labor costs of a biotechnology company. The established biotechnology companies raise salaries in order to attract new employees and thereby increase labor costs. This process offsets existing efficiency improvements and reduces the impact technical upgrading.
Table-6. Explaining Results of Malmquist Index
Symbol |
Meaning |
Biotechnology Companies |
TFP>1 |
Productivity Improvement |
Chung-hua, Putau-wang, He-tung, Sheng-dar, Bi-shiang, Wu-ding, Bai-liue, Dong-mau, Dong-yang, Bang-kuo, Chi-sheng. |
TFP<1 |
Productivity |
Shing-nung, Yung-shin, Shing-huei, Yung-jih, Ya-bo, Chia-chie, Bo-Deng. |
Depression |
||
EC<1 |
Efficiency |
Yung-shin, Shing-huei, Yung-jih, Bo-Deng. |
Depression |
||
TC<1 |
Technology |
Shing-nung, Ya-bo, Chia-chie. |
Depression |
||
PEC<1 |
Pure Efficiency |
Yung-shin, Shing-huei. |
Depression |
||
SEC<1 |
Scale Efficiency |
Yung-jih, Bo-Deng. |
Depression |
Notes: EC= technical efficiency change; TC= technical change;
PTEC= pure technical efficiency change; SEC= scale efficiency change; TFP= Malmquist total factor productivity.
Secondly, when new biotechnology companies plan to set up some new branches in order to cope with market competition, additional biotechnology company staff is required, producing the spared manpower at the same time (Niosi and Banik, 2005). Thirdly, the prosperity of the direct high technology industry markets in Taiwan, which will descend of the activities of the related financial intermediates. New biotechnology companies, therefore, make an effort to absorb investments by means of competitive interest rates, lowering the gap in interest rates among biotechnology companies. It will reduce technical efficiency and lower the magnitude of the Malmquist productivity index.
6. CONCLUDING REMARKS
We employ DEA and MPI to investigate the cost efficiency and measure the technical efficiencies and their dynamic changes of 18 biotechnological companies in Taiwan during the period 2005-2015. Major conclusions of the empirical research are as followers: Firstly, concerning the whole biotechnology industry, the technical inefficiency has greater significance than allocative inefficiency as a source of inefficiency within all inefficient biotechnology companies. Thus, given input prices, the effects on cost inefficiency could be attributed to the under-utilization of inputs, rather than the incorrect choice of the initial input combinations. Again, the pure technical factor also plays a more important role than the factor of scale in explaining the source of technical inefficiency within inefficient biotechnology companies. Thus, inefficiency within the biotechnology companies can be attributed to under-utilization of inputs, rather than inappropriate returns of scale, or the selection of incorrect input combinations. Concerning the individual firms, there are five to seven firms involved in the strong technical efficiency and/or pure technical efficiency units; however, the eleven firms located in the inefficiency units (Niosi and Banik, 2005).
Secondly, it was found that the event of the crisis of subprime mortgage and financial tsunami has a short-run shock effect to undermine the cost efficiency in Taiwan’s biotechnology companies. Similar results could also be obtained when an alternative parametric programming approach is conducted (Hong et al., 2002; Chen and Yeh, 2005). The results also show that the crisis of subprime mortgage and financial tsunami would depreciate costs, allocative and technical efficiency in Taiwanese biotechnological company. It may suggest that the low rates of return and R&D risk of the biotechnological firms could be the major reasons (Chiesa and Toletti, 2003). Although, as in many neighboring countries, the Taiwanese government adopted various strategies in response to the outbreak of the crisis of subprime mortgage and financial tsunami, the evidence suggests that the crisis has some weakened the cost efficiency of Taiwan’s biotechnology industry (Kim and Gwangho, 2001). Meanwhile, the biotechnological firms’ rates of return have depreciated, an obvious factor being the considerable widening of R&D risk during the period 2007 to 2010.
Thirdly, while applying the sense of Malmquist productivity index, the changes of total factor productivity in biotechnological industry are must accounted by the efficiency changes rather than technological charges. This implies that most of the growth in biotechnology company productivity in that year stemmed from technical progress and computerization. Again, if the growth in biotechnology company productivity has not quite more occurred and it can be attributed to less improvements in production technology, rather than to cost savings in management (Morrison, 2003).
In addition, such a reexamination of Taiwan’s biotechnology company performance/ efficiency covering those years in which the worst effects of the crisis of subprime mortgage and financial tsunami were being felt, can provide development directions, based on experience, for the globalization or deregulation of the entrance of the Mainland China to the Taiwan’s biotechnology industry (Zhu, 2000; Yang et al., 2009) and help to avert future invasions from further potential financial crisis or other risk environment.
| Funding: This study received no specific financial support. |
| Competing Interests: The author declares that there are no conflicts of interests regarding the publication of this paper. |
REFERENCES
Banker, R.D., A. Charnes and W.W. Cooper, 1984. Some models for estimating technical and scale inefficiencies in data envelopment analysis. Management Science, 30(9): 1078-1092.View at Google Scholar | View at Publisher
Bassem, B.S., 2014. Total factor productivity change of MENA microfinance institutions: A malmquist productivity index approach. Economic Modelling, 39(C): 182-189. View at Google Scholar | View at Publisher
Caves, D.W., L.R. Christensen and W.E. Diewert, 1982. Multilateral comparisons of output, input, and productivity using superlative index number. Economic Journal, 92(1): 73-86. View at Google Scholar | View at Publisher
Chang, H. and S. Majumdar, 1997. The optimal local exchange carrier size. Review of Industrial Organization, 15(3): 238-251.
Charnes, A., W.W. Cooper and E. Rhodes, 1978. Measuring the efficiency of decision making units. European Journal of Operational Research, 2(6): 429-444. View at Publisher
Chen, C.J. and Q.J. Yeh, 2005. A comparative performance evaluation of Taiwan’s high-tech industries. International Journal of Business Performance Management, 7(1): 16-33. View at Google Scholar | View at Publisher
Chen, Y. and A.I. Ali, 2002. Output-input ratio analysis and DEA frontier. European Journal of Operational Research, 142(3): 476-479. View at Google Scholar | View at Publisher
Chiesa, V. and G. Toletti, 2003. How biotechnology changes pharma R&D: A managerial perspective. International Journal of Biotechnology, 5(2): 125-136.View at Google Scholar | View at Publisher
Donthu, N. and Y. Boonghee, 1998. Retail productivity assessment using data envelopment analysis. Journal of Retailing, 74(1): 89-105. View at Google Scholar | View at Publisher
Edwards, S., 1998. Openness, productivity and growth: What do we really know? Economic Journal, 108(447): 383-398. View at Google Scholar | View at Publisher
Fare, R., S. Grosskopf, B. Lindgren and P. Roos, 1992. Productivity changes in Swedish pharamacies 1980-1989: A non-parametric malmquist approach. Journal of Productivity Analysis, 3(1): 85-101.< View at Google Scholar | View at Publisher
Fare, R., S. Grosskopf and C.A.K. Lovell, 1985. The measurement of efficiency of production. Boston: Kluwer Academic Publishers.
Fare, R., S. Grosskopf and C.A.K. Lovell, 1994. Production frontiers. Cambridge: Cambridge University Press, UK.
Fare, R., S. Grosskopf, M. Norris and Z. Zhang, 1994. Productivity growth, technical progress, and efficiency changes in industrialised countries. American Economic Review, 84(1): 66-83. View at Google Scholar
Farell, M.J., 1957. The measurement of productive efficiency. Journal of the Royal Statistical Society, 120(2): 253-281.
Ferrier, G.D. and C.A.K. Lovell, 1990. Measuring cost efficiency in banking: Econometric and linear programming evidence. Journal of Econometrics, 46(2): 229-245. View at Google Scholar | View at Publisher
Golany, B. and Y. Roll, 1989. An application procedure for DEA. OMEGA, 17(3): 237-250.View at Google Scholar | View at Publisher
Hong, Y., Q. Wei and G. Hao, 2002. DEA models for resource reallocation and production input/output estimation. European Journal of Operational Research, 136(1): 19-31. View at Google Scholar | View at Publisher
Hsieh, C.T. and P.J. Klenow, 2009. Misallocation and manufacturing TFP in China and India. Quarterly Journal of Economics, 124(4): 1403–1448.View at Google Scholar | View at Publisher
Kim, S. and H. Gwangho, 2001. A decomposition of total factor productivity growth in Korean manufacturing industries: A stochastic frontier approach. Journal of Productivity Analysis, 16(3): 269-281. View at Google Scholar
Liu, F.H. and P.H. Wang, 2008. DEA malmquist productivity measure: Taiwanese semiconductor companies. International Journal of Production Economics, 112(1): 367-379.View at Google Scholar | View at Publisher
Lovell, C.A.K., 1993. Production frontiers and productive efficiency. In Fried, H. O., Lovell, C.A.K., and S.S. Schmidt (Eds.), The measurement of productive efficiency. New York: Oxford University Press.
Mahadevan, R., 2002a. Has Korean manufacturing production reached its full potential? Economic analysis and policy (EAP), Queensland University of Technology (QUT). School of Economics and Finance, 32(2): 251-260.
Mahadevan, R., 2002b. Perspiration" versus "inspiration" in Malaysian industrialization,” economia internazionale. International Economics, Camera di Commercio di Genova, 55(4): 501-519.
Miller, S. and M. Upadhyay, 2000. The effect of openness, trade orientation and human capital on total factor productivity. Journal of Development Economics, 63(2): 399–423. View at Google Scholar | View at Publisher
Morrison, C.J., 2003. Productivity and efficiency measurement in our ‘new economy’ determinants, interactions, and policy relevance. Journal of Productivity Analysis, 19(2): 161-172.View at Google Scholar
Morrison, C.J. and D. Siegel, 1998. Knowledge capital and cost structure in the US food and fiber industries. American Journal of Agricultural Economics, 80(1): 30-45. View at Google Scholar | View at Publisher
Neupane, B., 2013. Efficiency and productivity of commercial banks in Nepal: A malmquist index approach. Asian Journal of Finance & Accounting, 5(2): 220-243. View at Google Scholar | View at Publisher
Niosi, J. and M. Banik, 2005. The evolution and performance of biotechnology regional systems of innovation. Cambridge Journal of Economics, 29(3): 343-352. View at Google Scholar | View at Publisher
Nishimizu, M. and J.J.M. Page, 1982. Total factor productivity growth, technological progress and technical efficiency change: Dimensions of productivity change in Yugoslavia, 1965–1978. Economic Journal, 92(368): 920–936. View at Google Scholar | View at Publisher
Singh, P. and A. Singh, 2012. Decomposition of technical change and productivity growth in Indian agriculture using non-parametric malmquist index. Eurasian Journal of Business and Economics, 5(9): 187-202. View at Google Scholar
Verma, D. and K.K. Sinha, 2002. Toward a theory of project interdependencies in high-tech R&D environment. Journal of Operations Management, 20(5): 451-468. View at Google Scholar | View at Publisher
Yang, Y.L., T.C. Sheng and C.J. Huang, 2009. Estimating the cost malmquist productivity index in the Taiwan biotech and biopharmaceutical industry. Taiwan Journal of Applied Economics, Special Issue for Productivity and Efficiency, 88: 60-85.
Young, A., 1992. A tale of two cities: Factor accumulation and technical change in Hong Kong and Singapore. NBER Macroeconomics Annual, 7: 13-54. View at Google Scholar | View at Publisher
Zhang, J., H. Fang, B. Peng, X. Wang and S. Fang, 2016. Productivity growth-accounting for undesirable outputs and its influencing factors: The case of China. Sustainability, 8(11): 1-13. View at Google Scholar | View at Publisher
Zhu, J., 2000. Multi-factor performance measure model with an application to fortune 500 companies. European Journal of Operational Research, 123(1): 105-112. View at Google Scholar | View at Publisher
Views and opinions expressed in this article are the views and opinions of the author(s), Asian Economic and Financial Review shall not be responsible or answerable for any loss, damage or liability etc. caused in relation to/arising out of the use of the content. |