


TESTING THE RANDOM WALK BEHAVIOR IN THE DAMASCUS SECURITIES EXCHANGE USING UNIT ROOT TESTS WITH STRUCTURAL BREAKS

Banking and Finance Sciences, Faculty of Economics, Tishreen University, Lattakia, Syria
ABSTRACT
This study aims to test whether stock prices on the Damascus Securities Exchange (DSE) follow a random walk process, using weekly data during the period from January 2010 to Mars 2017. For that purpose, in addition to the ADF test, which does not account for structural breaks in the data, the Zivot and Andrews test with one break, the Lumsdaine and Papell test with two breaks and the Lee and Strazicich tests with one and two endogenously determined structural breaks are applied. The findings of the study provide evidence in favor of random walk hypothesis in the DSE despite considering up to structural breaks in the data. Moreover, the dates of endogenously captured structural breaks in the majority of models tested coincide with the political instability that erupted in 2011 in Syria.
Keywords:Market efficiency, Random walk, Unit root tests, Structural breaks, Zivot and Andrews test, Lumsdaine and Papell test, Lee and Strazicich test, Damascus securities exchange.
JEL Classification:G14, G15, C22.
ARTICLE HISTORY: Received:12 May 2017 Revised:13 June 2017Accepted:19 June 2017Published:29 June 2017
Contribution/ Originality:: This study contributes to the existing literature as it is the first, up to my knowledge, that examines the validity of the random walk hypothesis on the Damascus Securities Exchange (DSE) using Unit Roots Tests that allow for endogenous structural breaks in the data.
1. INTRODUCTION
Fama (1970) classified efficiency into three types: weak, semi-strong and strong forms of efficiency. The weak form of the efficient market hypothesis EMH suggests that futures prices cannot be predicted using past historical price data (Fama, 1970).
There are several approaches to examine the weak form of efficiency. However, the random walk hypothesis has been widely used by a large number of studies (Chaudhuri and Wu, 2003; Chancharat and Valadkhani, 2007; Hiremath and Kamaiah, 2012; Mishra and Smyth, 2017). If stock prices follow a random walk process, there is no tendency for the price level to return to a trend path over time. This suggests that future returns cannot be predictable based on the basis of historical information (Chaudhuri and Wu, 2003; Chancharat and Valadkhani, 2007).
A variety of approaches have been used to investigate the random walk properties of stock prices. One of the most common approaches is to test for a unit root in stock prices (Tiwari and Kyophilavong, 2014). If stock prices contain a unit root, this implies that the random walk hypothesis is accepted. But if the stock prices are mean stationary, this implies that the random walk hypothesis is rejected (Mishra and Smyth, 2017).
The traditional unit root tests, such as the Augmented Dickey Fuller (ADF), the Phillips and Perron (1988) or the Kwiatkowski et al. (1992) tests, were widely used in the literature to test for the EMH (Maghyereh, 2003; Marasheh and Shrestha, 2008; Al-Jafari and Altaee, 2011; Salameh et al., 2011; Al-Ahmad, 2012; Al-Jafari and Abdulkadhim, 2012; Saeedi et al., 2014; Tiwari and Kyophilavong, 2014). But, a limitation of these tests is that they fail to account for an existing break in the data, which could be resulted from any significant economic, financial, or political events. Perron (1989) was amongst the first who highlighted the importance of controlling for structural breaks in the data. The Perron test, however, treated the structural break as exogenous (Mishra and Smyth, 2017).
Trying to overcome the criticism to the Perron test, Zivot and Andrews (1992) have developed a model to test for a unit root with an endogenous structural break. Lumsdaine and Papell (1997) extended the Zivot and Andrews (1992) model to accommodate two structural breaks1 .
However, these endogenous tests were criticized for their treatment of breaks under the null hypothesis. Lee and Strazicich (2003) demonstrated that these endogenous break unit root tests assume no break under the null hypothesis. Thus, researchers might conclude that the series is trend stationary while in fact it is non-stationary with breaks (Narayan and Smyth, 2004; Glynn et al., 2007). To address this issue, Lee and Strazicich (2003;2004) developed one break and two breaks minimum Lagrange Multiplier (LM) unit root tests in which the alternative hypothesis unambiguously implies the series is trend stationary (Glynn et al., 2007).
Several studies have investigated the random walk behavior on developing and emergent markets. However, there are few studies that tested the randomness of these markets using unit root tests which allow for endogenous structural breaks in the stock prices series (Chaudhuri and Wu, 2003; Narayan and Smyth, 2004; Chancharat and Valadkhani, 2007; Chancharat et al., 2009)
Damascus Securities Exchange (DSE) is a young and nascent stock market in the Middle East. It started trading in 10th March 2009, and the DSE weighted price index (DWX) was launched in 31-12-2009. The empirical researches that examined the efficiency of this market are rare.
Al-Ahmad (2012) examined the weak form efficiency of the Damascus Securities Exchange (DSE), using daily stock returns of the weighted price index (DWX) from 31-12-2009 to 30-11-2011. She applied several tests of random walk (the autocorrelation test,the runs test,the unit root tests, the variance ratio test and of the GARCH (1,1) model). The results revealed that stock prices on the DSE do not follow the random walk model, and hence, the weak form efficiency of the DSE is rejected.
Abbas (2014) reexamined the randomness of the Damascus Securities Exchange using daily stock returns of the (DWX) index from 2009 until 2014. She used two parametric tests (serial-correlation test and variance ratio test), and two non -parametric tests (runs test and BDS test). She also found that daily returns do not confirm to a random walk during the period of study.
In their study, Al-Ahmad and Al-Saleh (2016) used the monthly returns of firms listed in the Damascus Securities Exchange from 2009 until 2014 to examine the random walk behavior in returns. They applied various tests (the unit root test, the autocorrelation test, the runs test and the GARCH model). And to take the impact of the Syrian crisis into account when judging the efficiency of the market, they divided the period of study into three periods, the pre-crisis period, the crisis period and the whole period. Their findings showed inability to reject the weak form efficient market hypothesis for more than half of the studied firms. The results also revealed that the Syrian crisis has negatively affected the efficiency of most of the studied firms.
Unlike these few previous studies, that did not account for endogenously captures structural breaks in the data, this study proposes to investigate the random walk hypothesis in the DSE using units roots tests that allow for endogenous structural breaks in the data. Allowing for structural breaks in the unit root tests is important to explore whether the political instability that erupted in 2011 in Syria caused a structural break in the data that should be taken into account before judging the efficiency of the Damascus Securities Exchange (DSE).
The remainder of this study proceeds as follows: section two describes the data and explains the methodology, section three discusses the findings and section four concludes the study.
2. DATA AND METHODOLOGY
2.1. Data
The data used in this study are the natural logs of weekly stock prices of Damascus Securities Exchange (DSE) represented by the weighted price index (DWX). The data consist of 372 observation covering the period from January 2010 to Mars 20172 .
Table 1 presents the descriptive statistics of the data. As is shown in the table, the Jarque-Bera statistic is highly significant (P=0.000) thereby rejecting the hypothesis that the series is normally distributed.
Table-1. Descriptive statistic of the DWX (natural logs, weekly data)
Mean |
Median |
Max |
Min |
Std |
Skewness |
Kurtosis |
Jarque-Bera |
Obs. |
7.097 |
7.119 |
8.028 |
6.645 |
0.261 |
0.407 |
3.955 |
24.434 |
|
P (0.000) |
372 |
Source: Eviews output
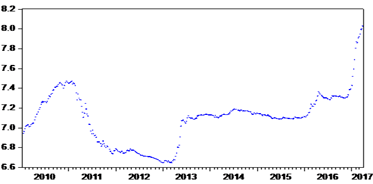
Figure-1. Time series plots of the DWX (natural logs, weekly data)
Source: Eviews output
2.2. Methodology
To test for the presence of a unit root in the serie studied, the Augmented Dickey-Fuller (ADF) test, which does not account for any structural breaks in the data, is first applied. The Zivot and Andrews (1992) test, which endogenously captures one structural break in the data, and the Lumsdaine and Papell (1997) test, which allows for the possibility of two breaks, are then used.
A limitation on these endogenous break tests is that the critical values are derived while assuming no breaks under the null hypothesis of unit root (Glynn et al., 2007; Narayan and Smyth, 2007). To address this issue, the minimum Lagrange Multiplier (LM) unit root tests with one and two structural breaks proposed by Lee and Strazicich (2003;2004) are also used in this study.
Below is a brief explanation of the tests applied.
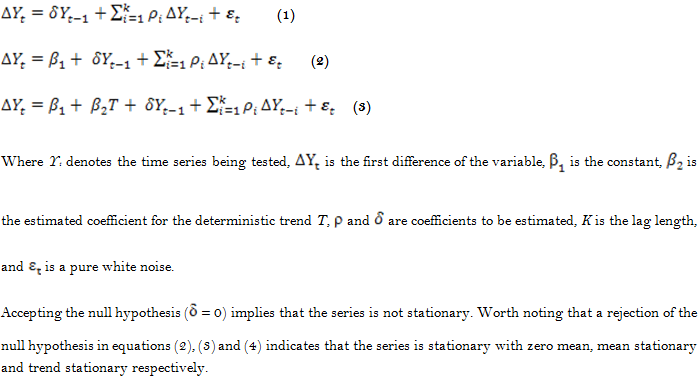
2.2.1. The ADF Test
The ADF unit root test is used in this study to examine the time series properties of the data without allowing for any structural breaks. The ADF test is applied as follows:
2.2.2. The Zivot and Andrews (1992) Test
Zivot and Andrews (1992) have developed methods to endogenously search for a structural break in the data. To estimate the Zivot and Andrews test, three models are proposed: model (A) allows for a one-time shift in the intercept; model (B) allows for a break in the slope; while model (C) allows for a break in intercept and slope (Narayan and Smyth, 2004). These three models have the following forms:
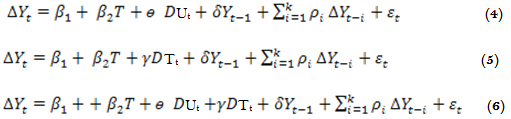
Where the dummy variable DUt captures structural change in the intercept at time TB; DUt =1 if t > TB and zero otherwise; the dummy variable DTt represents a change in the slope of the trend function (captures shift in the trend variable at time TB); DTt = t-TB if t > TB and zero otherwise; TB denotes the time of break.
The break date is chosen as the one which minimizes the one-sided t-statistic for the ADF unit root (![]() ) Glynn et al. (2007).
) Glynn et al. (2007).
The null hypothesis under the three models is that ![]() =0, which implies that the series has a unit root with a drift that excludes any structural breaks whereas the alternative hypothesis is that
=0, which implies that the series has a unit root with a drift that excludes any structural breaks whereas the alternative hypothesis is that ![]() < 0, which implies that the seriesis breakpoint stationary with a one-time break occurring at an unknown point in time (Waheed et al., 2006; Narayan and Smyth, 2007).
< 0, which implies that the seriesis breakpoint stationary with a one-time break occurring at an unknown point in time (Waheed et al., 2006; Narayan and Smyth, 2007).
2.2.3. The Lumsdaine and Papell (1997) Test
Lumsdaine and Papell (1997) extended the three models A, B and C of Zivot and Andrews test to allow for two endogenous structural breaks. These models are named as model (AA), (BB) and (CC). The modification of model which allows for two structural breaks in both the intercept and slope (model CC) is expressed as follow:
Where DU1t and DU2t are indicator dummy variables for a mean shift occurring at TB1 and TB2. The other two dummy variables (i.e. DT1t and DT2t) are indicators for structural breaks in the trend at TB1 and TB2 respectively. DU1t=1 if t>TB1 and zero otherwise; DU2t=1 if t>TB2 and zero otherwise; DT1t= t-TB1 if t>TB1 and zero otherwise; and DT2t=t-TB2 if t>TB2 and zero otherwise. Worth noting that the null hypothesis under the Lumsdaine and Papell test is the same as the one under the Zivot and Andrews test (Valadkhani et al., 2005).
2.2.4. The Lee and Strazicich Test
Lee and Strazicich (2003) proposed using a minimum Lagrange Multiplier LM test for testing the presence of a unit root with two structural breaks, while Lee and Strazicich (2004) suggested a one break LM unit root test. The authors considered two models of structural break, model A which allows for structural break in the intercept under the alternative hypothesis, and model C which allows for structural break in both the intercept and trend under the alternative hypothesis. The LM root test has the advantage that it is unaffected by structural breaks under the null3 .
3. RESUTS AND DISCUSSION
The study started through using the ADF test, which does not take into account any structural breaks. The model is estimated both with and without a trend. Based on the results presented in table 2, the series under investigation is not stationary at the level.
Table-2. The results of ADF unit root test
Critical values |
lag |
T-statistic |
|
-3.448 (1%) |
9 |
-0.737 |
Intercept |
-2.869 (5%) |
|||
-2.570 (10%) |
|||
-3.984 (1%) |
9 |
-1.108 |
Intercept and trend |
-3.422 (5%) |
|||
-3.134 (10%) |
Notes: The optimal lag length of the ADF test was selected based on the Schwartz Info Criterion (SIC). ***and ** indicate significance at the 1% and 5% level of significance respectively.
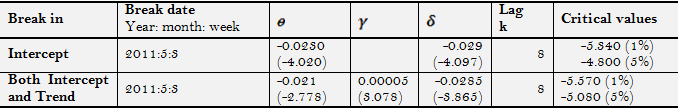
As suggested by Perron (1989) the failure to find stationarity in the data may be due to the fact that unit root tests have low power when structural breaks are ignored. To address this problem, the Zivot and Andrews test (models A and C) 4 is applied. The results, reported in table 3, reveal that the stock prices series still contains a unit root.
As revealed in the table, the endogenously captured break in the two models (A and C) occurred in 2011. The breakpoint captured in model A is statistically significant in intercept ( ![]() ), and the breakpoint captured in model C is significant in both the intercept and slope (
), and the breakpoint captured in model C is significant in both the intercept and slope (![]() )
)
Table-3. The results of the Zivot and Andrews test
Notes: The T-statistic are reported in brackets. ***and ** indicate significance at the 1% and 5% level of significance respectively. Following Lumsdaine and Papell (1997) and Ben-David et al. (2003) for annual data Kmax is assumed to be equal to eight.
The failure of the Zivot and Andrews test to reject the unit root null hypothesis could be due to the failure of this test to allow for more than one structural break (Aslan, 2010). Thus, the Lumsdaine and Papell (1997) unit root test with two structural breaks is next applied.
As can be seen from table 4, the results of models AA and CC suggest that the calculated t-statistics are lower than the critical values. Hence, one cannot reject the unit root null hypothesis.
The results reveal that in addition to the breaks identified earlier in 2011, the two breaks test captures structural breaks in 2013 and 2016. Worth noting that, in model AA, only the first breakpoint, captured in 2011, is significant. In model CC, the first break, captured in 2013, is significant in both the intercept and slope while the second, captured in 2016, is significant only in slope.
Table-4. The results of the Lumsdaine and Papell test
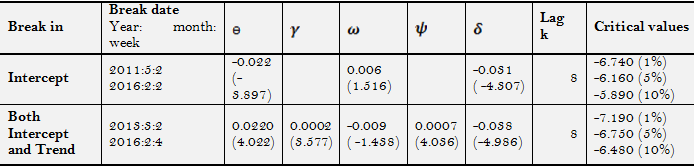
Notes: The T-statistic are reported in brackets. ***, ** indicate significance at the 1% and 5% level of significance respectively. The optimal lag length is determined by the general to specific method suggested by Ng and Perron (1995) andfollowing Lumsdaine and Papell (1997) and Ben-David et al. (2003) for annual data Kmax is assumed to be equal to eight.
To test the robustness of the results from the Zivot and Andrews (1992) and Lumsdaine and Papell (1997) unit root tests, the LM unit root tests with one and two breaks proposed by Lee and Strazicich (2003;2004) are also applied. The results, presented in tables 5 and 6, reveal that the stock prices still follow a random walk, whether allowing for one or two breaks.
Table-5. The results of the Lee and Strazicich one break unit root test

Notes: The coefficient of S{1} tests for the unit-root. The critical values for the unit-root test are tabulated in Lee and Strazicich (2004). The T-statistic are reported in brackets. ***, ** indicate significance at the 1% and 5% level of significance respectively.
The results of Lee and Strazicich one break test reveal that the two models, A and C, endogenously captured significant break in 2011.
According to the results of Lee and Strazicich two breaks test, the endogenously captured breaks occurred in 2011 and 2016. Worth noting that the two breakpoints are insignificant in model A, while they exerted a significant change in trend only in model C.
Table-6. The results of Lee and Strazicich two break unit root test
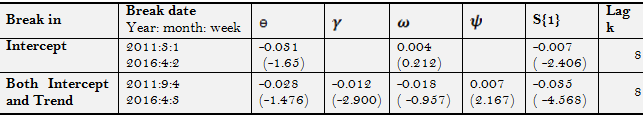
Notes: The coefficient of S {1} tests for the unit-root. The critical values for the unit-root test are tabulated in Lee and Strazicich (2003). The T-statistic are reported in brackets. ***, ** indicate significance at the 1% and 5% level of significance respectively.
Based on all the tests applied, one can draw the conclusion that stock prices on the Damascus Securities Exchange (DSE) follow a random walk process, which implies that the DSE is efficient in the weak form.
Coming back to the breaks that were noticed in the data, it is not surprising to note that the significant structural breaks in the majority of models tested occurred in 2011, which coincides with the debut of the Syrian crisis.
4. CONCLUSION
This study examines the random walks hypothesis in the Damascus Securities Exchange (DSE) using weekly data during the period from January 2010 to Mars 2017. In addition to the ADF test, the study utilizes unit root tests that allow for endogenous structural breaks in the data, this includes the Zivot and Andrews one structural break, the Lumsdaine and Papell two structural breaks and the Lee and Strazicich one and two structural breaks tests. The findings of the study confirm that the random walk model holds on the DSE, which implies that stock prices completely reflect the information contained in the data, and consequently it is unlikely to make abnormal profits using past price movements. The findings also reveal that the political instability that erupted in 2011 in Syria caused a structural break in the stock price series. Worth noting that the results of the unit root tests were not sensitive to the recognition of breaks in the data as allowing for more structural breaks did not lead to a reversal of the inference regarding the randomness of the series studied.
| Funding: This study received no specific financial support. |
| Competing Interests: The author declares that there are no conflicts of interests regarding the publication of this paper. |
REFERENCES
Abbas, G., 2014. Testing random walk behavior in the damascus securities exchange. International Journal of Academic Research in Accounting, Finance and Management Sciences, 4(4): 317-325. View at Google Scholar | View at Publisher
Al-Ahmad, Z., 2012. Testing the weak form efficiency of the damascus securities exchange. International Research Journal of Finance and Economics, 85: 154-165. View at Google Scholar
Al-Ahmad, Z. and M. Al-Saleh, 2016. Testing the random walk model on the stock returns of firms listed in the damascus securities exchange. Journal Al-Baath, 38(3): 20-44.
Al-Jafari, M. and H. Abdulkadhim, 2012. Variance ratio test and weak-form efficiency of Bahrain Bourse. International Research Journal of Finance and Economics, 88: 92-101.View at Google Scholar
Al-Jafari, M. and A. Altaee, 2011. Testing the random walk behavior and efficiency of the Egyptian equity market. Journal of Money, Investment and Banking, 22: 132-146. View at Google Scholar
Aslan, A., 2010. The validity of PPP: Evidence from Lagrange multiplier unit root tests for ASEAN countries. Economics Bulletin, 30(2): 1433-1443.View at Google Scholar
Ben-David, D., R. Lumsdaine and D.H. Papell, 2003. Unit root, postwar slowdowns and long-run growth: Evidence from two structural breaks. Empirical Economics, 28(2): 303-319.View at Google Scholar | View at Publisher
Chancharat, S., A. Kamalian and A. Valadkhani, 2009. Random walk and multiple structural breaks in Thai stock market. Munich Personal RePEc Archive No. 50395.
Chancharat, S. and A. Valadkhani, 2007. Testing for the random walk hypothesis and structural breaks in international stock prices. Working Paper No. 07-15, Department of Economics, University of Wollongong.
Chaudhuri, K. and Y. Wu, 2003. Random walk versus breaking trend in stock prices: Evidence from emerging markets. Journal of Banking and Finance, 27(4): 575–592. View at Google Scholar | View at Publisher
Fama, E.F., 1970. Efficient capital markets: A review of theory and empirical work. Journal of Finance, 25(2): 383–417. View at Google Scholar | View at Publisher
Glynn, J., N. Perera and R. Verma, 2007. Unit root tests and structural breaks: A survey with applications. Journal of Quantitative Methods for Economics and Business Administration, 3(1): 63-79. View at Google Scholar
Hiremath, G. and B. Kamaiah, 2012. Variance ratios, structural breaks and non-random walk behavior in the Indian stock returns. Journal of Business and Economic Studies, 2(18): 62-81. View at Google Scholar
Kwiatkowski, D., P. Phillips, P. Schmidt and Y. Shin, 1992. Testing the null hypothesis of stationarity against the alternative of a unit root. Journal of Econometrics, 54(1-3): 159-178. View at Google Scholar | View at Publisher
Lee, J. and M.C. Strazicich, 2003. Minimum lagrange multiplier unit root test with two structural breaks. Review of Economics and Statistics, 85(4): 1082-1089. View at Google Scholar | View at Publisher
Lee, J. and M.C. Strazicich, 2004. Minimum LM unit root test with one structural break. Working Paper, Department of Economics, Appalachain State University.
Lumsdaine, R. and D. Papell, 1997. Multiple trend breaks and the unit-root hypothesis. Review of Economics and Statistics, 79(2): 212-218. View at Google Scholar | View at Publisher
Maghyereh, A., 2003. The random walk hypothesis and the evidence from the Amman stock exchange. Zagreb International Review of Economics and Business, 6(1-2): 29-34.View at Google Scholar
Marasheh, H. and M. Shrestha, 2008. Efficiency in emerging markets-evidence from the Emirates securities market. European Journal of Economics, Finance, and Administrative Science, 12: 143-150.View at Google Scholar
Mishra, V. and R. Smyth, 2017. The random-walk hypothesis on the small and medium capitalized segment of the Indian stock market. Qasir Munir and Sook Ching Kok (Eds), Information Efficiency and Anomalies in Asian Equity Markets. London: Routledge.
Narayan, K.P. and R. Smyth, 2004. Is South Korea's stock market efficient? Applied Economic Letters, 11(11): 707-710. View at Google Scholar | View at Publisher
Narayan, K.P. and R. Smyth, 2007. Mean reversion versus random walk in G7 stock prices: Evidence from multiple trend break unit root tests. Journal of International Financial Markets, Institutions and Money, 17(2): 152–166. View at Google Scholar | View at Publisher
Ng, S. and P. Perron, 1995. Unit root tests in ARMA models with data dependent methods for the selection of the truncation lag. Journal of the American Statistical Association, 90(429): 268-281. View at Google Scholar | View at Publisher
Perron, P., 1989. The great crash, the oil price shock, and the unit root hypothesis. Econometrica, 57(6): 1361-1401. View at Google Scholar | View at Publisher
Phillips, P. and P. Perron, 1988. Testing for unit root in time series regression. Biometrika, 75(2): 335-346. View at Google Scholar | View at Publisher
Saeedi, A., S. Miraskari and S.A. Mehrdad, 2014. The investigation of the efficient mmrket hypothesis: Evidence from an emerging market. Taylor's Business Review, 4(2): 121-134. View at Publisher
Salameh, H.M., A.E. Twairesh, M.K. Al-Jafari and H.H. Altaee, 2011. Are Arab stock exchanges efficient at the weak-form level? Evidence from twelve Arab stock markets. European Journal of Economics, Finance, and Administrative Science, 39: 18-31. View at Google Scholar
Tiwari, A.K. and P. Kyophilavong, 2014. New evidence from the random walk hypothesis for BRICS stock indices: A wavelet unit root test approach. Economic Modelling, 43(C): 38–41.View at Google Scholar | View at Publisher
Valadkhani, A., A.P. Layton and M. Pahlavani, 2005. Multiple structural breaks in Australia‟s macroeconomic data: An application of the Lumsdaine and Papell test. Working Paper No. 05-17. University of Wollongong.
Waheed, M., S. Ghauri and T. Alam, 2006. Structural breaks and unit root: Evidence from Pakistani macroeconomic time series. MPRA Paper No. 1797.
Zivot, E. and D.W.K. Andrews, 1992. Further evidence on the great crash, oil price shock and the unit root hypothesis. Journal of Business and Economic Statistics, 10(3): 251-270.View at Publisher
Views and opinions expressed in this article are the views and opinions of the author(s), Asian Economic and Financial Review shall not be responsible or answerable for any loss, damage or liability etc. caused in relation to/arising out of the use of the content. |
Footnotes:
2. The data was collected from the official web site of the DSE (www.dse.com).