


WILLINGNESS TO PAY FOR INDEX BASED CROP INSURANCE IN GHANA

Department of Agricultural Economics, Faculty of Agricultural and Environmental Sciences, McGill University, Quebec, Canada
ABSTRACT
The study uses a dichotomous contingent valuation method to elicit the willingness to pay for crop insurance among cereal farmers in the Eastern region of Ghana. A sequential decision was considered. An initial decision regarding the willingness to purchase and a subsequent decision on the willingness to pay amount conditional on a positive initial decision was determined. The study employed descriptive statistical techniques to analyse primary data obtained from 208 sampled farmers in the region. Out of the sampled farmers, 52.9% expressed interest in crop insurance. The Probit model was used to estimate the mean willingness to pay (WTP) for crop insurance. The results revealed that farmers were willing to pay approximately GHc 66.2 per cropping season. A Heckman two stage approach was employed to estimate the factors influencing the WTP for crop insurance. The empirical results of the Probit model revealed that marital status, education, crop type, access to extension service, borrowing, savings and awareness of crop insurance influenced farmers’ willingness to purchase insurance. Farmers WTP amount estimated with the Ordinary Least Square regression model was shown to be influenced by variables such as marital status, other occupation, access to credit, borrowing and savings. The study recommends that with adequate and detailed information and affordable premiums, farmers will be willing to purchase insurance. Appropriate distribution channels are also recommended to incite demand for crop insurance.
© 2017 AESS Publications. All Rights Reserved.
Keywords: Crop insurance, Contingent valuation, Ghana, Heckman two stage analysis, Smallholder farmers, Willingness to pay
Article History: Received: 27 March 2017, Revised: 20 April 2017, Accepted: 24 May 2017, Published: 19 June 2017
Contribution/ Originality: The study contributes to existing literature by (i) by employing an estimation method that considers and deals with the possible existence of sample selection bias (ii) distinguishing between the determinants of a decision to purchase and the actual amount farmers are willing to pay for insurance.
1. INTRODUCTION
Agricultural risks are common in both developed and developing countries. Although, the predominant sources and consequences may differ between countries they are generally experienced by most farmers in most countries. Agriculture in sub-Saharan Africa (SSA) is an important sector of the economy serving as a stimulus for growth, assisting in poverty reduction and the provision of food security. Yet, food insecurity and poverty are critical issues for most developing countries in SSA. Among the numerous reasons, one cause of this problem could be attributed to agriculture’s susceptibility to production, price and policy risks which impact farmers’ income and welfare (Cervantes-Godoy et al., 2013).
In Ghana, agriculture produces approximately 22 percent of GDP (Ghana Statistical Service, 2014) and provides 51% of the employment in the country (Stutley, 2010). It also provides 75% of foreign exchange earnings (Armah et al., 2011) with crop production making up approximately two-thirds of the sector. Ghana’s agriculture is risky as it is mainly rain fed and prone to a number of climatic, natural and biological hazards and most of these risks can’t be controlled by the farmers themselves (Baquet et al., 1997).
Production risks put a constraint on their income generation and loan acquisition due to the resulting high risk profile. Farmers have dealt with production risk and individual specific shocks through self-insurance and by adopting informal coping strategies. These coping strategies may not be adequate to manage large levels of risk (Kurukulasuriya et al., 2006). As a result, risk and risk management strategies of smallholder farmers in developing countries might in fact push them into poverty. There are projections suggesting that changes in climate will result in increasing global temperatures in addition to frequent and extreme weather events (IPCC, 2007) with Ghana in particular predicted to experience rainfall reductions and higher temperatures (Stutley, 2010). The development of a risk management tool which will enable poor vulnerable farmers adapt to these changes is therefore essential. One adaptation mechanism that has the potential to enable smallholder farmers to manage climate related risks in developing countries is agricultural (crop) insurance (Kwadzo et al., 2013; Sundar and Ramakrishnan, 2013).
Ex-ante micro insurance has gained attention over the years with various developing countries exploiting the market due to unpredictable climate conditions and frequency of production risks that impose significant challenges for sustainable production (Gulseven, 2014; Lui et al., 2015). Ghana has recently introduced its first crop insurance scheme to enable poor, and thus vulnerable, farmers to have access to a market-based risk management strategy in order to deal with risks that are beyond their control (Stutley, 2010). Crop insurance aids in protecting farmers against uncertainties and cushions them from shocks when there is a bad year, improving their risk bearing capacity. These benefits suggest that crop insurance is a tool that can reduce the impact of production risk.
Realizing this situation, the government of Ghana and other stakeholders in the agricultural and insurance sectors developed, piloted and implemented a crop insurance scheme in 2011. This was an attempt to enable poor, and thus vulnerable, farmers to have access to a market-based risk management strategy in order to deal with risks that are beyond their control (Stutley, 2010; Ghana Agricultural Insurance Programme, 2013). Nevertheless, improving the risk coping strategies adopted by farmers is heavily dependent on farmers’ willingness to adopt these strategies. The risk portfolio of farmers and their demand options need to be studied and understood with emphasis on the characteristics that influence producers’ decision to join or otherwise. Crop insurance is new to farmers in Ghana and attempts being made to increase its adoption therefore, necessitating research to investigate its demand. The crop insurance scheme that is available in Ghana at the present time, and thus is the insurance under consideration for this research project, is the weather index insurance primarily designed for maize and three other crops.
The study therefore seeks to assess the demand for crop insurance by cereal farmers in Ghana and specifically addressed two research questions. Firstly, are farmers interested in the crop insurance scheme and which of them will be early entrants into the insurance market? Secondly, how much are farmers willing to pay for the insurance scheme and what are the factors influencing these amounts? This study provides an understanding of farm households’ need for insurance, aiding the enhancement of the product and the search for the best ways to protect farmers’ livelihood from risk. It can be vital for policy action and the design of insurance contracts by providing information on the demand for insurance, the prospective farmers and locations to target as well as the various risks farmers desire to protect themselves against.
1.1. Overview of Agricultural Insurance
Adams (1995) defined insurance as a signed contract between two parties involving an exchange in the form of a premium from one party to another party who is responsible for paying a fixed amount to the other party when an unpredicted event occurs. Agricultural insurance generally lowers risk faced by farmers by compensating them for damages, thus allowing them to increase the level of investment and income (Nahvi et al., 2014). Crop insurance can be categorized into two major groups namely the indemnity based insurance and the index based insurance. The indemnity based insurance is made up of the multi-peril crop insurance, named peril and yield insurance. The index based insurance is made up of the area yield index, area revenue and indirect index insurance.
Crop insurance schemes can be provided at three different levels which are the micro, intermediate and macro levels. At the farm level, the index insurance provides protection financially against unfavorable weather variability that affects farmers’ production. At the intermediate level, banks package loans with an index insurance together with an interest rate that includes the premium paid for by the bank to the insurer. In the event of a drought, the farmer pays a portion of the loan due which reduces default. Lastly at the macro level, a nationwide production index for the country could serve as the base for an index insurance policy (Hess and Syroka, 2005).
Agricultural insurance, by serving as a source of collateral for farmers, enhances a farmer’s access to credit (Ajieh, 2010) as observed in countries like India and the Philippines (Stutley, 2010) which is useful not only for financing production costs but to satisfy other monetary constraints.
1.2. Index Based Insurance
Index insurance is basically dependent on using triggers as referees for actual crop loss and loss assessments. A trigger is an index threshold below or above, which payments start (Cole et al., 2012). Triggers can be made in various ways either by using data on rainfall amounts as in Malawi or by using crop yield data in a locality or district as in Peru or the level of vegetation and or livestock mortality rate as in Mongolia (ILO, 2011). Payment of claims is not based on actual individual farm losses as in the case for the traditional multi-peril schemes but on deviations from the index such as rain or humidity. Indirect index insurance on the other hand uses external indices such as weather derivatives, satellite or vegetation. Weather index based contracts are designed for specific perils such as drought, flood or windstorms which are usually recorded at local weather stations. Loss assessments are dependent mainly on data gathered from weather stations. Payouts are made when the index, such as rainfall amounts, falls below or rises above a defined threshold expected to result in crop loss. The amount insured by the contract is estimated using the potential crop revenue, production cost as in Ghana or the difference between the two. Weather indices often used are daily average or cumulative annual temperature, precipitation, wind, and cooling and heating degree days (Goovaerts and Dhaene, 1998).
Index based contracts are uniformly structured (International Finance Corporation, 2011) and easy to administer with less administration and operating cost. It can easily be bundled with other financial services such as credit. One major challenge with index based insurance is that the farmer may face a loss on his farm but may not receive payments depending on the point at which the index falls. There may be losses but no payouts or payouts are made when there are no losses. This problem is referred to as the basis risk and it depends on how the farmer’s yield co-varies with the index. This is attributable to little or no correlation between the individual loss and the insurance trigger causing the indemnity payout to vary (ILO, 2011).
1.3. Willingness to Pay (WTP) for Agricultural Insurance
Employing the Probit model, Ali (2013) identified household income, land and asset holdings, type of crop produced, access to credit and extension services as the factors influencing the WTP for index insurance in Pakistan. These variables were found to have a positive and significant effect on farmers’ willingness to pay. The index based insurance was also found to have an impact on food and cash crop acreage since farmers’ willingness to increase these crop acreages were significantly positive.
Long et al. (2013) pointed out that households’ total value of assets, size of field and ability to borrow had positive correlations with farmers’ willingness to buy insurance. Results from the Ordinary Least Square (OLS) estimation in the Heckman procedure showed a negative correlation between households’ expenditure per capita as well as coping strategies and their willingness to participate and pay for insurance. Gulseven (2014) performed a twofold empirical analysis, first using the logit model to determine farmers’ demand for insurance and a contingent valuation open ended and take it or leave it type questions to derive farmers’ WTP amounts. Education and farm income were shown to have positive and significant effects on farmers WTP but household size and union membership were not found to be statistically significant. The authors found strong evidence that, demand is downward sloping with farmers’ willingness to pay declining sharply with lower coverage levels. Falola et al. (2013) examined the willingness of cocoa farmers to take agricultural insurance in Nigeria. Out of the sampled farmers, 39% of the sample with knowledge of the product were willing to participate. Age, farm income, education and access to extension services were revealed to influence the willingness to take agricultural insurance according to the explanatory model developed using the probit model.
Abdullah et al. (2014) examined the willingness of paddy farmers in Malaysia to pay for crop insurance by applying the bidding game elicitation technique to estimate farmers’ mean willingness to pay. Farmers were willing to pay about 8% of the total coverage per crop season. Results from the logit regression model revealed that farmers’ WTP is affected positively by attendance to paddy production courses, farming experience and farm size but negatively by age. Kwadzo et al. (2013) reported the WTP for crop insurance among farmers in the Kintampo north municipality of Ghana who were predominantly male, married with more than 50% having no formal education. Educated farmers were assumed to have exposure to more sophisticated risk management practices since they were not observed to have interest in the scheme. Moreover, farmers with large families above the mean average of 4.6 persons were likely to purchase insurance since with a large number of people depending on the farm, the responsibility to reduce potential losses is high.
Nimoh et al. (2011) revealed that most farmers (67%) were willing to pay less than 11% of their annual incomes as premiums. Reasons indicated by farmers as influencing their desire to insure were protection against uncertainties and to serve as a buffer. The lack of awareness and income were found to deter farmers from insuring their crops. Though insurance companies indicated their interest in farm insurance, only 30% were willing to carry it out due to the high risk involved. This outcome is likely to be a barrier to agricultural insurance establishment and expansion in Ghana. Ramasubramanian (2012) made a clear distinction between the willingness to join and the willingness to pay for rainfall index insurance among farmers in India The study employed a Heckman selection model for analyses with a first stage ordered probit and a second stage interval regression. A higher percentage of farmers were observed to be willing to join the micro insurance scheme and this was highly dependent on wealth. Using an open ended interactive bidding process, the amount farmers’ were willing to pay was found to be driven by the availability of other coping mechanisms, acres planted and risk attitudes.
1.4. Crop Insurance in Ghana
To deal with the threatening influence of climate change on agriculture in Ghana a project was implemented in December 2009 by German International Co- Operation (GIZ). The goal of the project was to assist Ghana tackle climate risk by developing an insurance product which is economically sustainable and demanded by farmers. GAIP provided the first agricultural insurance during the pilot stages and is currently the only agency providing crop insurance to farmers in Ghana since it was launched in June 2011. The type of scheme that was provided and currently being provided is the weather index insurance specifically the drought index insurance (GAIP, 2013). Insurance is offered to farmers who are able to purchase directly from GAIP to protect them against weather variability. It is not bundled with any other product such as credit or farm inputs such as seeds or fertilizer.
The weather (drought) index insurance covers only crop loss resulting from the lack of rainfall. The contract usually covers one complete crop cycle. The scheme is dependent on automated weather stations that record climatic data on rainfall, temperature, wind and relative humidity. Data on rainfall amount are used to determine what occurs on the farm and to determine claim payments. If recorded rainfall falls below a specified level, it signifies an expected crop loss on the field and payouts are made. The scheme works by farmers paying one tenth of the cost of their farm production to GAIP (local agents) at the beginning of the farming season and receive a payout when there is no rain (less than 2.5mm of rain) for 12 consecutive dry days. On average farmers pay 10% of whatever amount is spent on an acre of land which is calculated for each crop. Payouts are made within 30 days after the cropping season to insured farmers within 20km radius of a selected weather station. Farmers have access to insurance through local agents who come to the villages at the beginning of the cropping season to create awareness and register farmers willing to insure their crops.
2. MATERIALS AND METHODS
2.1. Data Description
A rural survey data was used to estimate the willingness of farmers to pay for crop insurance in Ghana. The study area was selected through a multistage sampling technique with priority given to the Eastern region due to it susceptibility to drought and also because it is a major cereal producing region. Steps were taken to purposively sample five (5) districts and twenty-one (21) communities for the survey. Data were obtained by using a structured questionnaire designed specifically to gather information through personal face-to-face interviews with cereal farmers. The questionnaire includes modules on household demographics, income, assets and details on farm characteristics. Farmers’ willingness to purchase insurance and the amount they were willing to pay were also investigated. The total sample size for this study is 208 cereal farmers in the Eastern region.
2.2. Utility Framework1
The utility maximization assumption is the basis for the adoption of a technology. The expected utility of adopting a technology should be larger than non-adoption for a farmer to adopt a technology. Assuming a farmer’s initial level of welfare yielded the indirect utility function expressed as  .
.  is income,
  is the price vector for the goods vector
  without insurance and
  is vector of socio-economic and demographic characteristics. Goods in this model represent the different risk management strategies already utilized by the farmer. A farmer is willing to pay to obtain
  with insurance if
 (1)
(1)
has one more good than which is insurance, the price remains the same since insurance is paid by  . Therefore a farmer will prefer to subscribe and pay for crop insurance when the utility derived from insurance is greater than without insurance and vice versa, i.e.
  ≥ V.
≥ V.
The utility of not purchasing insurance is represented by  where
where  is a vector for an individual farmer’s characteristics and
  denotes income. This can be written as
 is a constant term,
  and
and  are unknown coefficients and
  is the stochastic term. If
  is a random term representing farmer i’s WTP for premium then the utility for purchasing crop insurance
  is shown as

for the farmer can be expressed as
Where βX is the difference between the deterministic part of utilities representing a farmer’s decision to purchase crop insurance or not. With the assumption that  represents the true WTP for farmer i,

 =
= and assumed not to depend on x while
  is a mean zero constant variance error term.
2.3. Willingness to Pay (WTP) Technique Employed in the Study
A farm household survey was used to elicit farmers’ willingness to pay for crop insurance after a detailed description of how a weather index insurance contract works was presented to them. The basic principle was communicated to farmers as an insurance guaranteeing a minimum payout for a specific peril over a predetermined period of time in exchange for a charge known as the premium. The product description is that of the crop insurance (weather index insurance) package provided by GAIP. The premium rate for this product is charged at 10% of the total production cost of the farmer, which has been estimated for maize and rice farmers as GHc 57.40 and GHc 180.00 respectively.
By employing the contingent valuation dichotomous choice technique, farmers were asked if they were interested in the product after which questions on farmers’ willingness to pay for different amounts for the contract were presented only to farmers who indicated their interest in the insurance scheme. Farmers responded to their willingness to pay for these bids (amounts) with a Yes or No indicating their willingness or lack of willingness to pay for insurance.
All farmers were asked if they were willing to pay a 10% premium rate (since this is the current premium rate used by GAIP), a follow up question depending on their response to the initial bid. If they answered Yes a higher bid was again offered to the farmer while if they responded No, a lower one was offered to the farmer. The maximum bid with a positive response is taken as the amount the farmer was willing to pay. Three consecutive bids were therefore presented to farmers with the third bid contingent on the second bid and that bid being contingent on the first bid. The initial bid was set at GHc 57.40 and GHc 180.00 (i.e. 10% premium rate) for maize and rice respectively per Ha for a maximum pay-out of GHc 574.00 and GHc 1,800.00 per Ha for the respective crops. The follow up lower and upper bids are shown in the table below as well as the possible responses of the bidding game
Table-1. Bid Design
| Bid levels | Premium rate | Maize | Rice |
| 2nd Lower bid | 2% | 11.48 | 36.00 |
| 1st Lower bid | 5% | 28.70 | 90.00 |
| Initial bid (GAIP rate) | 10% | 54.40 | 180.00 |
| 1st Higher bid | 12% | 68.88 | 216.80 |
| 2nd Higher bid | 15% | 86.10 | 270.00 |
Source: Munkaila (2015)
2.4. Econometric Framework
Farmers’ WTP for index based crop insurance was modeled using the discrete model framework in this study. A two-stage model was employed with the assumption that the farmers’ decision to purchase insurance and the amount they are willing to pay are two different and sequential decisions. An important consideration in the empirical analysis is that, it is expected that not all households will be interested in crop insurance leading to biased estimates if unwilling households are excluded (Long et al., 2013). Farmers who are willing to pay for insurance are a subset of the total number of sampled farmers leading to a non-randomly selected sample from the entire set of farmers. Sample selection issues come about when observations selected are not independent of the outcome variable and may lead to biased inferences. Ruling out farmers who are not willing to pay, the data becomes censored and the sum of residuals is no longer zero as expected.
To draw conclusions on the entire population of farmers as well as the sub population of farmers from which WTP amounts were solicited, the Heckman two-stage procedure for a continuous decision variable is used. The model assumes that both decisions are made concurrently and therefore the assumption that the error terms of the two equations could be correlated is made. The model was applied to deal with the problem of sample selection bias following Kuoame and Komenan (2012).
The Heckman two-stage model is specified as;
Selection equation
z * (unobserved) = γ'w+u u ~ N(0,1) Equation 1 (1st stage)
z = 1 if z* > 0 z = 0 if z* ≤ 0
Regression/ Observation equation
y = β' x+e e ~ N(0,σ2 ) Equation 2 (2nd stage)
y observed only if z is equal to 1. The variance of u is normalized to 1 because z* is not observed but only z is observed. u and e are the error terms and are assumed to be bivariate and normally distributed with the γ and β as parameter vectors. Equation (1) is the participating function where w represents the factors influencing WTP for insurance or not. The Mills ratio is determined from this function and used in the second stage as a parameter estimate, regressed on y. Equation (2) represents the factors influencing the amount farmers are willing to pay (percentage of total income they are willing to spend on insurance) which is determined by the significance of β. y is WTP amount, x represents the explanatory variables.
The Heckman two-stage model first estimates the impact of several characteristics on the probability of purchasing crop insurance and additionally analyses the factors influencing the amount farmers are willing to pay. A binary choice probit model was used in estimating the first stage of the model (selection equation), the dependent latent variable is 1 if the farmer is willing to purchase crop insurance and 0 if otherwise. A normal distribution of ε, mean of zero and a variance of is assumed with the use of the probit model (Greene, 2002). The model was chosen due to the binary nature of the dependent variable. In the second stage the model analyzed the factors influencing the percentage of income farmers were willing to spend on insurance (WTP amount) using the Ordinary Least Square regression model.
Sample selection bias is controlled by the Heckman two-stage model and accounted for with the inverse Mills ratio (estimated expected error) which was generated from parameter estimates in the first equation. The inverse Mills ratio (IMR) indicates the selectivity problem and is incorporated into the second stage of the model as an additional explanatory variable. It is a procedure to identify and eliminate the selection bias problem by removing the part of the error term that correlates with the explanatory variable.
2.5. Probit Model
The general Probit model is expressed as follows:
Where Yi is the dichotomous dependent variable expressed as
Yi = 1, if farmer is willing to purchase crop insurance, Yi = 0, if farmer is not willing to purchase crop insurance, βo = is the intercept, ßi = the regression coefficients, Xi = independent variables, μi = the stochastic error term.
To interpret the relationship in terms of the willingness to purchase or not, the marginal effects were used. The marginal effect for the estimated coefficients is expressed as;
After the marginal effects have been estimated following the probit estimation, the next step is to estimate the mills ratio which is incorporated into the OLS model.
Where 𝜆𝑖 = Mills ratio variable, 𝑋𝑖 = the vector of the factors that influence the willingness to participate, 𝛷 = the density function of a standard normal variable, 𝜑 = the cumulative distribution function of a standard normal distribution, δ, ρ are parameters of explanatory variables.
2.6. Ordinary Least Square Analysis
The Ordinary Least Square regression was used to estimate the factors influencing the percentage of income farmers were willing to spend on crop insurance denoted by  . This analysis was focused only on farmers who were willing to purchase crop insurance. The regression model for this analysis could be specified as Muhammad et al. (2015).

The dependent variable, , is represented by the amount farmers are willing to pay for insurance as a percentage of their total household income. Some of the independent variables incorporated into the regression model include Age, marital status, farm experience, farm size, risk factor, coping strategies and others. The dependent variable in the regression model is a continuous variable and therefore the Ordinary Least Square serves as an appropriate estimation model.
3. RESULT AND DISCUSSION
A total of 208 respondents were interviewed for the study, out of this sample 110 (52.9%) were willing to purchase crop insurance while 98 (47.1%) were not willing to purchase crop insurance. Of the total respondents, 74.0% were males while 26.0% were females. The majority of the survey respondents, 161 were married. The majority of the widowed respondents (94.1%) were not willing to purchase insurance. 91 of the respondents had only basic education, 57 had further education and 60 had no formal education. Educated respondents were more willing to purchase insurance compared to uneducated respondents (Table 2). The mean ages for those willing to purchase insurance and not willing to purchase insurance was 45.7 and 47.7 years, respectively. Most of the farmers, 148 of the 208 respondents, have been producing cereals for at least 10 years with the majority of them having 10 to 20 years of farming experience. More than 60.0% of farmers with less than 5 farming experience were willing to pay for insurance. The survey results indicate that a majority of the farmers had monthly income below 500GH cedis; approximately 52.9% of the survey sample. Approximately, 45.5% of the farmers with incomes less than 500GH cedi were willing to purchase insurance (Table 2).
Table-2. Difference in characteristics of those willing and not willing to pay for insurance
| Variable | Not Willing To Pay | Willing to Pay | ||||
| Number of Respondents | Number of Respondents | (%) | Number of Respondents | (%) | ||
| Gender | Male | 154 | 62 | 40.3 | 92 | 59.7 |
| Female | 54 | 36 | 66.7 | 18 | 33.3 | |
| Marital Status | Single | 14 | 3 | 21.4 | 11 | 78.6 |
| Married | 161 | 71 | 44.1 | 90 | 55.9 | |
| Divorced | 9 | 2 | 22.2 | 7 | 77.8 | |
| Widower | 17 | 16 | 94.1 | 1 | 5.9 | |
| Other | 7 | 6 | 85.7 | 1 | 14.3 | |
| Education | No formal education | 60 | 42 | 70.0 | 18 | 30.0 |
| Basic education | 91 | 41 | 45.1 | 50 | 54.9 | |
| Secondary education | 40 | 11 | 27.5 | 29 | 72.5 | |
| Tertiary education | 17 | 4 | 23.5 | 13 | 76.5 | |
| Age | ≤ 30 | 9 | 2 | 22.2 | 7 | 77.8 |
| < 31- 50 | 118 | 57 | 48.3 | 61 | 51.7 | |
| >51 | 81 | 39 | 48.2 | 42 | 51.9 | |
| Household Size | 0 - 3 | 37 | 14 | 37.8 | 23 | 62.2 |
| 4 - 6 | 115 | 57 | 49.6 | 58 | 50.4 | |
| 7 - 10 | 50 | 25 | 50.0 | 25 | 50.0 | |
| 11 - 15 | 6 | 4 | 66.7 | 2 | 33.3 | |
| Farming Experience | < 5 | 5 | 2 | 40.0 | 3 | 60.0 |
| 5 – 10 | 55 | 23 | 41.8 | 32 | 58.2 | |
| 11 – 15 | 60 | 27 | 45.0 | 33 | 55.0 | |
| 16 – 20 | 40 | 24 | 60.0 | 16 | 40.0 | |
| 21 -30 | 40 | 17 | 42.5 | 23 | 57.5 | |
| >30 | 8 | 5 | 62.5 | 3 | 37.5 | |
| Income | < 500 | 110 | 60 | 54.5 | 50 | 45.5 |
| 500 – 1000 | 55 | 23 | 41.8 | 32 | 58.2 | |
| 1000 - 2000 | 19 | 8 | 42.1 | 11 | 57.9 | |
| 2000 - 3000 | 11 | 2 | 18.2 | 9 | 81.8 | |
| >3000 | 13 | 5 | 38.5 | 8 | 61.5 | |
Source: Field Survey data, 2015
53.9% of respondents who engaged in agriculture as their major occupation were willing to purchase insurance. Of the small size farm owners, 50.0% were willing to purchase crop insurance. Of the sampled farmers, 108 respondents had contact with extension agents. When one had a visit from an extension agent, 61.1% of the respondents were willing to purchase insurance, while if there was no visit only 44.0% were willing to purchase insurance. 59.3% of the respondents who had access to credit were willing to purchase insurance while 48.8% of the farmers without credit were willing to purchase insurance (Table 3).
Table-3. Distribution of household heads farm and institutional characteristics according to the willingness to purchase insurance
| Variable | Not Willing to Pay | Willing to Pay | ||||
| Number of Respondents | Number of Respondents | (%) | Number of Respondents | (%) | ||
| Farm Size | Small Size | 169 | 84 | 50.0 | 85 | 50.0 |
| Medium Size | 26 | 11 | 42.0 | 15 | 58.0 | |
| Large Size | 13 | 3 | 23.0 | 10 | 77.0 | |
| Crop Type | Maize | 166 | 82 | 49.0 | 84 | 51.0 |
| Rice | 42 | 16 | 38.0 | 26 | 62.0 | |
| Extension visit from agent | No | 100 | 56 | 56.0 | 44 | 44.0 |
| Yes | 108 | 42 | 38.9 | 66 | 61.1 | |
| Access to credit | No | 127 | 65 | 51.8 | 62 | 48.8 |
| Yes | 81 | 33 | 40.7 | 48 | 59.3 | |
Source: Field survey data 2015
3.1. Insurance Participation Decision
The term crop insurance is not new to farmers because 111 of the respondents had knowledge of it as opposed to 97 who were not aware of it. Of the total respondents, 51.4% were aware of the Ghana Agricultural Insurance Program (GAIP) while 48.6% had no knowledge of GAIP. The respondents who were aware of GAIP obtained the information through the media (50.5%), from banks or financial institution (20.6%) and FBO, NGO and other institution (11.2%). Approximately 8.4% indicated they had heard about it from friends/relatives, 5.6% indicated that they obtained the information from GAIP officials while 3.7% heard of GAIP through extension agents (Figure 1).
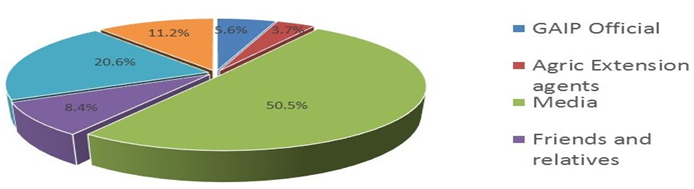
Figure-1. Distribution of farmers and their sources of information
Source: Author Computation
More than 70.0% of the females were not aware of crop insurance and GAIP compared to 38.0% of the males who were not aware of the insurance and GAIP. 60.0% of the educated farmers were aware of the insurance, 72.0% of the farmers with no education were not aware of crop insurance and the GAIP.
Approximately 58.0% and 55.9% of farmers who owned a radio were aware of crop insurance and GAIP, respectively. Of the total number of farmers who did not own a radio, 90.0% were not aware of crop insurance and GAIP. There was a statistically significant relation between radio ownership and willingness to pay; i.e. a p–value of 0.031 (< 0.5) was obtained from the Chi-square test. This suggests that the ownership of a radio plays a significant role in farmers’ access to information on crop insurance and their willingness to purchase it. 67.3% of the respondents who were aware of GAIP were willing to pay insurance. On the other hand, 62.9% of the total number of farmers who were not aware of insurance were not willing to insure their crops.
3.2. Perception of Farmers with Regards to Crop Insurance
Some of the respondents had some knowledge about crop insurance and GAIP, and were asked about their perception of crop insurance. 46.7% of the farmers who responded to this question were of the view that the crop insurance offered by GAIP satisfied only the needs of large sized farm owners while 32.7% indicated that it satisfied the needs of all groups of farmers (Figure 2). 1.9% of the farmers stated that it satisfied only the needs of small sized farm owners, 6.5% indicated that it did not apply to any of the farmer categories, and 12.1% did not have any idea which farmer groups’ needs were satisfied by crop insurance.
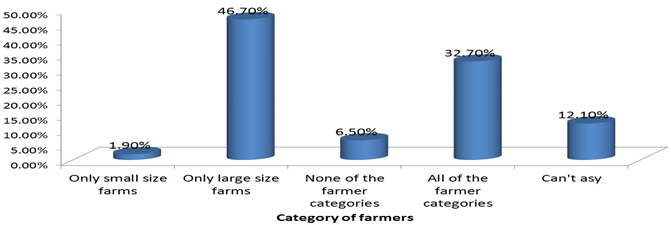
Figure-2. Perception about crop insurance
Source: Author Computation
According to 54.2% of the farmers, crop insurance did not cover any risks (Figure 3). This suggests that the farmers did not have adequate knowledge about crop insurance even if they were aware of it. The media could play a tremendous role in providing information about GAIP but currently farmers do not seem to obtain detail and accurate information from this source. For example, 53.7% of the farmers who received information from the media were of the opinion that insurance covered no risks while 25.9% of these farmers thought that it covered up to 50% of the risks. The majority of the respondents who received information from friends and NGOs were also of the opinion that insurance covered no risks.
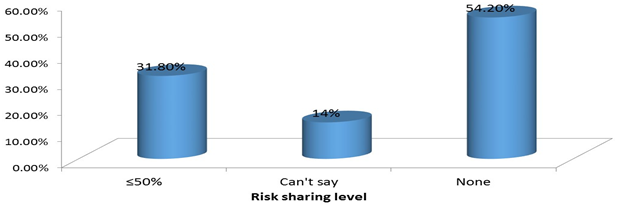
Figure-3. Perception about risk sharing level
Source: Author Computation
On the other hand, 54.5% of the farmers who received information from financial institutions thought that insurance covered up to 50% of the risk. Contrary to expectation, most of the farmers who received information from GAIP officials (66.7%) and all those who received information from extension agents believed that insurance covered no risks. Approximately half of the educated farmers thought that insurance covered no risks. 27.3% of the large size farm owners thought that insurance covered up to 50% risks compared to 34.1% of the small size farm owners. Farmers who were willing to purchase insurance were made up of 30.6% of individuals who thought that insurance did not cover any risks, 56.9% of those who were of the view that it covered up to 50% of the risk and 12.5% of those who had no opinion on the percentage of risk that was covered by crop insurance.
3.3. Willingness to Pay Analysis
GAIP’s current premium rate was offered to farmers as the initial bid after which a follow up bid which was either higher or lower than the initial bid was proposed to farmers depending on the response to the initial bid. The proposed bid which the farmer agreed to as the amount he/she was willing to pay was taken as the maximum WTP amount. A high percentage (52.9%) of the farmers indicated their interest and willingness to pay for crop insurance which shows that a majority of the farmers were interested in insuring their crops from production risks and uncertainties. Another 47.1% of the respondents were unwilling to accept and pay for crop insurance.
Approximately 52.0% of the farmers who were not willing to purchase crop insurance offered a number of reasons for their decision. A large number of farmers (23.1%), indicated that they did not have enough information about the GAIP’s insurance program. 8.7% indicated that they did not have the funds to purchase insurance, 9.7% mentioned high premium rates, 3.4% were of the opinion that the compensation time might be delayed and 6.7% of the farmers signaled that they needed time to decide. A number of these reasons were similar to those observed by Nimoh et al. (2011) who reported that 9% and 2% of the sampled farmers were not willing to insure due to a lack of income and inadequate knowledge respectively.
Table 4 presents a description of the number and percentage of farmers who accepted to pay for each bid or premium rate. Of the total number of maize farmers who were willing to purchase insurance, 19.0% of them were willing to pay at the current premium rate of 10% of production costs. 76.2% were willing to pay below the current GAIP premium rate and only 4.8% were willing to pay above this rate. The number of farmers willing to purchase insurance decreased as the premium rate increased. The distributions observed for maize farmers was not different from those observed for rice farmers. The majority of the rice farmers (65.4%) were willing to pay lower bids than the current premium rate of 10% while 23.1% were willing to pay the current premium. Generally, farmers who were willing to purchase crop insurance were willing to pay premium rates lower than the current premium rate offered by GAIP. It can be inferred that the insurance premium charged by GAIP may be out of reach for the sampled farmers since on average most of them were willing to pay lower bids. For both crop farmers, less than 5% were willing to pay the highest bid or premium (15%). Only approximately 20% were willing to purchase insurance at the current premium values of 10% of the cost of production.
Table-4. Distribution of farmers according to their maximum WTP amount
|
||||||||||||||||||||||||||||||||||||||||||||||||||||||||||||||||
Source: Field survey data 2015.
Maize and rice farmers are presented with the same premium rates as a percentage of the cost of production, however, the absolute values differ because the cost of production for each crop differs. The cost of production for rice is substantially higher than for maize.
3.4. Estimating Average WTP from Household Monthly Income
The percentage of income farmer’s were willing to spend on crop insurance was estimated. This was done based on information on household income and the different amounts farmers were willing to pay as a premium (Table 5). The first column shows the monthly income intervals of farmers. The second column is the estimated percentage of income farmers were willing to spend on premium payments. This calculation was made for farmers within each income group with respect to the bid amounts they were willing to pay. The third column provides the percentage of farmers in each income group who were willing to pay the specified premium rates. The rest of the columns provide this information for different premium rates. Therefore for the first row, it can be observed that 73.0% of maize farmers with monthly income lower than 500 GH cedi were willing to purchase insurance at the 2% premium rate i.e. 2% of their cost of production. This premium rate corresponds to an amount of 11.48 GH cedi and therefore it was estimated that the percentage of this amount out of 500 GH cedi was 2.3. The results indicate that lower income farmers who earned less than or equal to 500 GH cedi per month who agreed to purchase insurance at the 2% premium rate were willing to spend at least 2.3% of their income on crop insurance.
Similarly, 95.0% of farmers with income between 500 and 1,000 GH cedi were willing to pay for insurance at the 5% premium rate. These farmers were thus willing to pay 28.7 GH cedi for insurance which is between 3% and 6% of their monthly income. Hence, the results show that farmers in this income group who were willing to purchase insurance with a 5% premium rate were willing to spend at most 6% of their income on crop insurance (Table 5).
Table-5. Percentage of farmers willing to pay each premium rate stratified by monthly income
|
||||||||||||||||||||||||||||||||||||||||||||||||||||||||||||||||||||||||||||||||||||||||||||||||||||||||||||||||||||||||||||||||||||||||||||||||||||||||||||||||||||||||||||||||||||||
Source: Field survey data 2015. Note: 2% premium is 2% of cost of production
The results show that the majority of the farmers with lower incomes were willing to pay for crop insurance at a lower premium rate. Maize farmers who were willing to pay the current rate offered by GAIP had income levels above 1,000 GH cedis while rice farmers who were willing to pay this amount had income levels between less than 500 GH cedis to 3,000 GH cedis. The bid amounts both groups of farmers were willing to pay increased with income. A majority of the farmers were willing to spend on average, less than or equal to 5% of their monthly income on crop insurance.
Generally, rice farmers were willing to spend a higher percentage of their income on insurance than maize farmers. Farmers with lower incomes were found to spend a higher percentage of their incomes on insurance though they opted mostly for lower bids. Maize farmers with incomes above 5,000 GH cedis were willing to spend at least 1.7% of their income on crop insurance while rice farmers with incomes between 3,000 GH cedis and 5,000 GH cedis were willing to spend a minimum of 5.4% of their income on insurance.
3.5. Econometric Results of the Heckman Two-Stage Model
The estimated outcome of the Probit selection used to analyze farmers’ willingness to purchase crop insurance contracts is presented in Table 5 below. The analytical statistics showed that the estimated model has a good fit with a chi-square value statistically significant at the 1% level. Another measure of good fit is the Pseudo R2 value of 0.2108 which indicates that 21.08% of the variations in the farmer’s decision to purchase insurance was explained by the explanatory variables in the model. This is quite reasonable considering that the data for the study were obtained from a cross sectional survey of selected farmers in the study area.
3.6. Individual and Farm Characteristics
Marital status was found to be significant at the 1% significance level and positively correlated with farmers’ willingness to purchase insurance. This conformed to the a-prior expectation and is also consistent with other studies (Danso-Abbeam et al., 2014). Marital status is represented by the variables single which was measured as 1 if the farmer was single and 0 if otherwise, i.e. if the respondent was married, divorced or widowed. The married variable was measured as 1 if the respondent had a spouse and 0 if the farmer was single, widowed or divorced.
Married farmers have the responsibility of reducing their household’s vulnerability to risks and the resulting negative impacts and are therefore more likely to purchase a crop insurance policy. Farmers who are single were also observed to be willing to purchase insurance which could be due to the fact that with limited responsibility of catering for other individuals, these farmers are more likely to set aside money to purchase insurance. This was consistent with the findings of Munkaila (2015) among cereal farmers in Ghana. The coefficient for education was positive and statistically significant at the 5% significance level and was also in line with previous studies by Ali (2013). The positive effect on the willingness to purchase insurance implies that better educated farmers are more likely to receive and understand the insurance policy and are thereby more willing to purchase insurance compared to those with lower educational levels. Income had a negative and insignificant relationship with farmers’ willingness to purchase insurance. This was contrary to a-prior expectation. This implies that farmers with higher household incomes are probably less vulnerable to production risks and its effects on their welfare and therefore have a lower willingness to purchase insurance.
The relationship between crop type and the willingness to purchase crop insurance was observed to be negative and statistically significant at the 10% significance level. Though both crops require moisture (rainfall/irrigation) to thrive, rice crops require more water and thus are likely to have a higher negative impact in the event of a drought. Thus rice farmers will be more likely to purchase crop insurance especially since the scheme that was presented to farmers is a weather index insurance scheme.
3.7. Institutions
Access to agricultural extension services was significant at the 1% significance level and positively affected farmers’ willingness to purchase insurance. Extension services provide farmers with important information concerning modern technologies and management strategies and thereby influence their purchasing decision positively. In accord with a prior expectation, the more farmers had access to these services, the higher the probability of engaging in crop insurance.
Table-6. Probit regression estimates of farmers' willingness to purchase crop insurance
| Variable | Coefficients | P-Value |
| Constant | -1.42 (0.75) |
0.06 |
| Individual/Farm Factors | ||
| Single | 1.31*** (0.47) |
0.01 |
| Married | 0.87*** (0.30) |
0.00 |
| Education | 0.05** (0.02) |
0.02 |
| Income | -0.03 (0.06) |
0.60 |
| Crop type | -0.44* (0.25) |
0.08 |
| Medium size | -0.02 (0.30) |
0.94 |
| Large size | 0.21 (0.47) |
0.65 |
| Farm experience | 0.17 (0.22) |
0.44 |
| Major occupation | 0.06 (0.21) |
0.76 |
| Institutions | ||
| Extension service | 0.54** (0.27) |
0.04 |
| Access to credit | -0.27 (0.27) |
0.32 |
| Risk/Coping Strategy | ||
| Weather Variation | 0.24 (0.20) |
0.24 |
| Borrowing | -0.87*** (0.27) |
0.00 |
| Savings | -0.46* (0.27) |
0.09 |
| Marketing contracts | 0.04 (0.53) |
0.95 |
| Awareness/Information | ||
| Aware of crop insurance | 0.56** (0.22) |
0.01 |
| Number of Obs. | = 208 | Wald Chi2 (17) |
| Pseudo R2 | = 0.21 | Prob > chi2 |
| Log likelihood | = -113.51 |
Note: Robust standard errors. ***, ** and * indicate significance level at 1%, 5% and 10% respectively.
3.8. Risk and Coping Strategy
In line with a prior expectation, farmers’ adoption of various risk management strategies particularly borrowing and savings had a significant and inverse relationship with the willingness to purchase insurance. From the results, borrowing and savings were found to be significant at the 1% and 10% significance levels respectively. Thus, individuals who borrowed or used savings were less willing to insure their crops. Farmers who use borrowing as a risk management strategy may have a lower ability to pay for insurance premiums while farmers who use savings may be obtaining security from this strategy thereby decreasing the likelihood of purchasing insurance as a risk management strategy. There was consistency between this results and findings by Ramasubramanian (2012) who evaluated the effects of savings and borrowing on farmers’ insurance purchasing decision.
3.9. Awareness/Information
Farmers who had knowledge about GAIP and the crop insurance scheme that was being offered had a higher probability of purchasing insurance compared to their counterparts who didn’t have any information. This was in line with findings obtained by Munkaila (2015) who observed a positive correlation between awareness of insurance and willingness to purchase.
3.10. Percentage of Income Farmers Were Willing to Spend on Insurance
The Ordinary Least Square model was employed in the second stage Heckman model to assess the factors influencing the percentage of income farmers were willing to spend on insurance conditional on a positive decision to purchase insurance. The estimated results are shown in Table 6. The inverse mills ratio (IMR) was statistically significant at 1% implying that employing the two stage procedure was appropriate and justifies the use of the Heckman model (Chen and Hamori, 2008). This indicates that the sample selection problem (dependence of error term on outcome models) is evident in the model and thus estimating the determinants of the income percentages farmers were willing to spend using an ordinary OLS model would be inaccurate and have yielded biased estimates. From the regression estimates, it can be observed that the coefficient of the Inverse Mills Ratio is negative and shows that the selection problem would have provided a downward biased estimates (Irfan, 2011). This was in line with a number of studies authored by (Chantarat et al., 2009; Mfungwe, 2012; Ramasubramanian, 2012).
3.11. Individual and Farm Characteristics
The percentage of income farmers were willing to spend on insurance was significantly higher for married individuals which conformed to the first stage results on farmers’ decision to purchase. This suggest that married farmers were willing to spend a pay a higher percentage of their income on insurance probably because they have their household depends on the earnings from farm production and therefore it is necessary to manage risks.
Farmers with higher education were more willing to spend a lower percentage of their income on insurance contracts which was demonstrated by the negatively significant relationship between education and WTP income percentages. Educated farmers are likely to have other risk management strategies or have opportunity to engage in a secondary occupation which provides them with additional income. This reduces the incentive to pay for crop insurance as a risk management strategy and was consistent with work done by Aidoo et al. (2014).
Household income negatively and significantly influenced the percentage of income farmers were willing to spend to insure their crops. Though higher income farmers were more willing to pay a higher amount to insure their crops compared with lower incomes farmers, the percentage they are willing to pay is lower. It can be argued that these farmers usually have higher incomes and though they accept to pay higher bids, the bid amount is only a small proportion of their income. Hence, it can be concluded that though lower income farmers would be willing to purchase insurance to better manage risk, and secure their welfare, they would have to spend a higher percentage of their income in purchasing insurance (Table 7).
It was observed that farm experience was statistically significant and had a negative relationship with the percentage of income farmers were willing to spend on insurance. Cereal farmers with more experience were less willing to spend much on insurance compared to those with much less experience.
Table-7. Ordinary Least Square regression results of the factors influencing the percentage of income farmers are willing to spend on insurance.
| Variable | Coeff | P>z |
| Constant | 3.21 (1.20) |
0.01 |
| Individual/Farm factors | ||
| Age | -0.197 (0.32) |
0.55 |
| Education | -0.40*** (0.12) |
0.00 |
| Marital status | 0.65*** (0.22) |
0.00 |
| Income | -0.42*** (0.29) |
0.00 |
| Other Occupation | 0.10 (0.20) |
0.64 |
| Farm experience | -0.04** (0.02) |
0.01 |
| Medium scale | -0.02 (0.12) |
0.88 |
| Large scale | -0.04 (0.21) |
0.83 |
| Institutions | ||
| Extension service | -0.60*** (0.22) |
0.01 |
| Access to Credit | 0.45*** (0.18) |
0.01 |
| Risk/Coping Strategy | ||
| Weather variation | -0.24 (0.18) |
0.18 |
| Savings | 0.68*** (0.24) |
0.01 |
| Borrowing | 1.38*** (0.34) |
0.00 |
| Marketing contracts | -0.01 (0.49) |
0.98 |
| Awareness/Information | ||
| Aware of GAIP | -0.93*** (0.20) |
0.00 |
| Inverse mills ratio | -2.15*** (0.57) |
0.00 |
| Number of Obs. | = 110 | R-squared |
| Root MSE | = 0.71 | Prob > F |
Note: Robust standard errors. ***, ** and * indicate significance level at 1%, 5% and 10% respectively.
Individuals with more experience in farming may tend to rely on their experience in managing risks over the years and therefore will be less willing to spend a higher amount to adopt a new risk management strategy (Table 7).
3.12. Institutions
Unlike the Probit results, a negative and significant relation was observed between WTP income percentages and extension services. Farmers who had received extension services were less willing to spend much to insure their crops since they are more likely to have information on different types of risk management strategies and therefore are exposed to a number of options in managing risk. Famers who had access to credit were willing to spend higher percentage of their income on insurance because insurance serves as a guarantee that they can be able to pay back at least part of their loans when there is any risk.
3.13. Risk and Risk Management Strategies
Farmers who used savings as a coping strategy were likely to spend a higher percentage of their income on insurance. This is in line with findings by Aidoo et al. (2014) who observed that farmers who had savings were willing pay a higher amount on insurance. Premium payments will be made either with current or saved income and therefore farmers who save are more capable of obtaining funds to purchase insurance. Adopting borrowing as a risk management tool was also found to have a positive correlation with farmers WTP income percentages. Farmers who borrowed were expected to be willing to spend less on insurance especially because of inadequate income. However, it can be argued that the farmers were aware of the negative effect of borrowing and thus were more likely to spend more for an alternative risk management strategy. Ramasubramanian (2012) observed that farmers who had adopted other coping strategies were willing to pay less for insurance but this study concludes otherwise.
3.14. Awareness/Information
Having information about GAIP (Ghana Agricultural Insurance Program) had a negative and significant relationship with the percentage of income the farmer was willing to spend on insurance. Awareness of insurance and GAIP which was mostly from the media may have served as an incentive to influence farmers’ willingness to purchase insurance but it didn’t seem to be enough motivation for farmers to spend more on crop insurance. This could be due to the quality of information obtained from this source and also the credibility of the various sources from which farmers obtained information about GAIP and the crop insurance scheme that was being offered.
3.15. Mean Willingness to Pay
Employing the Probit model, the mean WTP was calculated by regressing the initial bid on the dependent dummy variable. Mean WTP results from the single bounded contingent valuation approach are illustrated below and presented in Table 8 the standard error and confidence interval for the mean are arrived at using the robust approach.
Table-8. Mean WTP
Single bounded contingent valuation response
| Particulars | Coef. | Std. Error. | z | P>z | [95% Conf. Interval] |
| WTP | 72.05705 | 10.07277 | 7.15 | 0.000 | 52.31479 |
Double bounded contingent valuation response
| Particulars | Coef. | Std. Error | z | P>z | [95% Conf. Interval] |
| WTP | 66.23328 | 4.608442 | 14.37 | 0.000 | 57.20089 |
Source: Author Computation
The mean WTP is calculated from the single bounded dichotomous choice format where farmers respond yes or no to the initial bid. Mean WTP from this format shows that farmers are willing to pay 72.1 GH cedi on average. The study also calculated the mean WTP from the double bounded multiple choice responses (López-Feldman, 2013b) and observed that farmers were willing to pay averagely 66.23 GH cedi. This was observed to be lower than the mean value from the single bounded model. This implies that farmers are willing to pay lower amounts for insurance compared to the initial bids. Cereal farmers in the Eastern region were willing to pay a premium of approximately 66.23 GH cedi for protection coverage for each cropping season. This is relatively low compared with the study by Kwadzo et al. (2013) who reported that food crop farmers in the Kintampo North Municipal of Ghana were willing to pay a maximum of GHc 80.00 as a premium for crop insurance.
4. CONCLUSION
The study established that the crop insurance scheme offered by GAIP; which is a weather index insurance scheme, will be an appropriate alternative risk management strategy for cereal farmers in the Eastern region. This is because majority of the farmers stated drought and weather variation as the major risks faced in the study area. The results indicated that there was a considerably high demand for crop insurance because 52.9% of the farmers were willing to purchase insurance. Generally, cereal farmers who were willing to purchase and spend a higher percentage of their income on insurance were married, had access to credit, had savings or adopted borrowing as a risk management strategy. The factors identified to affect demand for insurance were education, access to extension services and awareness of insurance. Education is key because knowledge about insurance and the ability to understand the concept of insurance plays an important role in farmers’ participation in the insurance program. Further, past experiences with innovations and the limited desire to experiment with new products could be a negative factor with respect to farmers’ decision to participate and fully involve themselves in the crop insurance program.
Crop insurance was less attractive to low income farmers as the premium rate increased to 10% of the cost of production, although low income farmers were more willing to purchase crop insurance at lower premium rates. This study distinguishes between the decision to purchase and the percentage of income farmers are willing to spend on crop insurance. This information bridges the gap between the hypothetical and actual case. Though households are more likely to participate in the insurance program, this does not always translate into real purchases. For instance, educated farmers were more willing to purchase crop insurance but had a higher probability of spending a lower percentage of their income on it.
4.1. Policy Implications
If the crop insurance program is expensive and unpopular, it may not be sustainable. The study thus proposes the following recommendations. Development policies should aim at increasing income of households particularly low income smallholder farmers. Furthermore, the WTP analysis revealed that maize and rice farmers were willing to pay an average of 66.23 GH cedi for insurance, 73.6% of both crop farmers were willing to pay for insurance at a lower premium rate relative to the 10% premium rate charged by GAIP. Government subsidies should also be considered to assist farmers with premium payments. To enhance farmers demand for insurance, awareness campaigns through extension services and different Medias as well as the content of information on crop insurance and its mode of presentation to farmers should be of high importance in the implementation of crop insurance in Ghana. It is essential for GAIP in collaboration with the government and other stakeholders to formulate a strategic plan to convince farmers of the credibility of the insurance program and the insurance provider.
4.2. Future Research Areas
Further studies should investigate the appropriate percentage of total production cost farmers should pay as the crop insurance premium which would either confirm GAIP’s approach or provide insight on a more feasible method of estimating insurance premiums. Other types of insurance programs apart from the current program which pays the producers their cost of production when the risk occurs should be investigated to determine their feasibility and acceptability by farmers. It is further recommended that an impact analysis should be undertaken to assess the effectiveness and constraints of the crop insurance scheme after an appreciable number of years.
| Funding: This study received no specific financial support. |
| Competing Interests: The author declares that there are no conflicts of interests regarding the publication of this paper. |
| Contributors/Acknowledgement: The author gratefully appreciates Munkaila Faisal for willing granting permission for data collected by him with the supervision of Prof Daniel Bruce Sarpong at the University of Ghana to be used for this particular study. The useful comments from the academic staff of the Department of Agricultural Economics, McGill University and particularly Prof. Benjamin Simpson are gratefully acknowledged. |
REFERENCES
Abdullah, M.A., A.G. Auwal, S. Darham and A. Radam, 2014. Farmers willingness to pay for crop insurance in North West Selangor irrigated agricultural development area (IADA), Malaysia. International Society for Southeast Asian Agricultural Science, 20(2): 19-30. View at Google Scholar
Adams, A., 1995. Banking and finance series investment. London: Kluwer Law International.
Aidoo, R., J.O. Mensah, P. Wie and D. Awunyo-Vitor, 2014. Prospect of crop insurance as a risk management tool among arable crop farmers in Ghana. Asian Economic and Financial Review, 4(3): 341-354. View at Google Scholar
Ajieh, C.P., 2010. Poultry farmers’ response to agricultural insurance in Delta State, Nigeria. Journal of Agricultural Science, 1(1): 43-47. View at Google Scholar
Ali, A., 2013. Farmers’ willingness to pay for index based crop insurance in Pakistan: A case study on food and cash crops of rain-fed areas. Agricultural Economics Research Review, 26(2): 241-248. View at Google Scholar
Armah, A.F., J.O. Odoi, G.T. Yengoh, S. Obiri, D.O. Yawson and E.K.A. Afrifa, 2011. Food security and climate change in drought-sensitive savanna zones of Ghana. Mitigation and Adaptation Strategies for Global Change, 16(3): 291–306. View at Google Scholar | View at Publisher
Baquet, A., R. Hambleton and D. Jose, 1997. Introduction to risk management. Washington DC: USA: US Department of Agriculture, Risk Management Agency, USDA.
Cervantes-Godoy, D., S. Kimura and J. Antón, 2013. Smallholder risk management in developing countries. OECD Food, Agriculture and Fisheries Papers, No. 61, OECD Publishing.
Chantarat, S., A.G. Mude and C.B. Barette, 2009. Willingness to pay for index based livestock insurance: Results from a field experiment in Northern Kenya. Working Paper, Department of Applied Economics and Management, Cornell University.
Chen, G. and S. Hamori, 2008. An empirical analysis of gender wage differentials in urban China. Kobe University Economic Review, 54: 25- 34. View at Google Scholar
Cole, S., G.G. Bastian, S. Vyas, C. Wendel and D. Stein, 2012. The effectiveness of index-based micro-insurance in helping smallholders manage weather-related risks. London: EPPI-Centre, Social Science Research Unit, Institute of Education, University of London.
Danso-Abbeam, G., K.N. Addai and D. Ehiakpor, 2014. Willingness to pay for farm insurance by smallholder cocoa farmers in Ghana. Journal of Social Science for Policy Implications, 2(1): 163-183. View at Google Scholar
Falola, A., A.E. Ayinde and B.O. Agboola, 2013. Willingness to take agricultural insurance by cocoa farmers in Nigeria. International Journal of Food and Agricultural Economics, 1(1): 97-107. View at Google Scholar
Ghana Agricultural Insurance Programme, 2013. Developing sustainable financial solutions to the challenge of climate change. Accra, Ghana: GAIP.
Ghana Statistical Service, 2014. Poverty profile in Ghana (2005-2013). Ghana Living Standards Survey, Sixth Round Report (GLSS 6). Accra, Ghana.
Goovaerts, M.J. and J. Dhaene, 1998. On the characterization of Wang’s class of premium principles. Transactions of the 26th International Congress of Actuaries, 4: 121-134.
Greene, H.W., 2002. Econometric analysis. 5th Edn., Upper Saddle River, NJ: Prentice Hall, New York University.
Gulseven, O., 2014. Estimating the demand factors and willingness to pay for agricultural insurance. Middle East Technical University, Turkey. Australian Journal of Engineering Research, 1(4): 13-18.
Hess, U. and J. Syroka, 2005. Weather-based insurance in Southern Africa: The case of Malawi. Agriculture and Rural Development Discussion Paper No. 13. Washington, D.C: World Bank.
ILO, 2011. Social protection floor for a fair and inclusive globalization. Report of the Social Protection Floor Advisory Group. International Labor Office, Geneva.
International Finance Corporation, 2011. Weather index insurance for maize production in Eastern Indonesia; A feasibility study. Indonesia: IFC, World Bank Group.
IPCC, 2007. Climate change 2007: Impacts, adaptation and vulnerability. Contribution of Working Group II to the Fourth Assessment Report of the Intergovernmental Panel on Climate Change, M.L. Parry, O.F. Canziani, J.P. Palutikof, P.J. van der Linden and C.E. Hanson, Eds., Cambridge University Press, Cambridge, UK.
Irfan, S., 2011. Modeling wages of females in the UK. International Journal of Business and Social Science, 2(11): 195-202. View at Google Scholar
Kuoame, B.H.E. and A.N. Komenan, 2012. Risk preference and demand for insurance under price uncertainty: An experimental approach for cocoa farmers in Cote D’Ivoire. Research Paper No.13. Geneva: Micro Insurance Innovation Facility, International Labor Office.
Kurukulasuriya, P., R. Mendelsohn, R. Hassan, J. Benhin, M. Diop, M.H. Eid, Y.K. Fosu, G. Gbetibouo, S. Jain, A. Mahamadou, S. El-Marsafawy, S. Ouda, M. Ouedraogo, I. Sène, D. Maddision, N. Seo and A. Dinar, 2006. Will African agriculture survive climate change? World Bank Economic Review, 20(3): 367–388. View at Google Scholar | View at Publisher
Kwadzo, T.M.G., J.K.M. Kuwornu and I.S.B. Amadu, 2013. Food crop farmers’ willingness to participate in market-based crop insurance scheme: Evidence from Ghana. Research in Applied Economics, 5(1): 1-21. View at Google Scholar | View at Publisher
Long, Q.T., T.B. Minh, C.N. Manh and T.V. Thanh, 2013. Farm households’ willingness to pay for crop (Micro) insurance in rural Vietnam: An investigation using contingent valuation method. East Asian Development Network (EADN) Working Paper No. 64.
López-Feldman, 2013b. Introduction to contingent valuation using stata. Munich Personal RePEc Archive (MPRA) Paper, No. 41018. Retrieved from http://mpra.ub.uni-muenchen.de/41018/.
Lui, X., Y. Tang and M.J. Miranda, 2015. Does past experience in natural disasters affect willingness-to-pay for weather index insurance? Evidence from China. Selected Paper prepared for presentation at the Agricultural & Applied Economics Association San Francisco, CA.
Mfungwe, L., 2012. Assessing the impact and adoption of agroforestry food security programmes on the rural livelihoods: Evidence form Southern Malawi. Master Thesis. University of Malawi.
Muhammad, S., E. Fathelrahman and T.U.R. Ullahc, 2015. Factors affecting consumers’ willingness to pay for certified organic food products in United Arab Emirates. Journal of Food Distribution Research, 46(1): 37-45. View at Google Scholar
Munkaila, H.F., 2015. Cereal farmers willingness to pay for weather- based index insurance (WII) product as a risk management tool in the Eastern Region of Ghana. Master Thesis. Department of Agricultural Economics and Agribusiness, University of Ghana.
Nahvi, A., M.R. Kohansal, M. Ghorbani and N. Shahnoushi, 2014. Factors affecting rice farmers to participate in agricultural insurance. Journal of Applied Science and Agriculture, 9(4): 1525-1529. View at Google Scholar
Nimoh, F., K. Baah and E.K. Tham-Agyekum, 2011. Investigating the interest of farmers and insurance companies in farm insurance: The case of cocoa farmers in Sekyere West Municipal of Ghana. Journal of Agricultural Science, 3(4): 126-135. View at Google Scholar | View at Publisher
Ramasubramanian, A.J., 2012. Willingness to pay for index based crop microinsurance in India. USA: NEUDC, Darmouth College.
Stutley, C., 2010. Crop insurance feasibility study. Ghana: Innovative Insurance Products for the Adaptation to Climate Change Project Ghana (IIPACC).
Sundar, J. and L. Ramakrishnan, 2013. A study on farmers’ awareness, perception and willing to join and pay for crop insurance. International Journal of Business and Management Invention, 2(1): 48-54. View at Google Scholar
Wan, W., 2014. Farmers’ willingness to pay for breeding sow insurance: Evidence from China’s Hubei Province. Theses and Dissertations--Agricultural Economics Paper No. 22. Retrieved from http://uknowledge.uky.edu/agecon_etds/22.
| Views and opinions expressed in this article are the views and opinions of the author(s), Asian Economic and Financial Review shall not be responsible or answerable for any loss, damage or liability etc. caused in relation to/arising out of the use of the content. |
The theoretical framework was suggested by Long, Minh, Manh and Thanh (2013). and Wan, (2014).↩