


MOMENTUM DECOMPOSITION: EVIDENCE FROM EMERGING MARKETS

1,2School of Economics and Management, University of the Chinese Academy of Sciences, Beijing, China
ABSTRACT
To explain the reason why momentum effect in emerging markets is much weaker than that in developed markets. We divide the traditional momentum returns into intra-style momentum and inter-style momentum effect on the basis of style investing. According to the result, intra-style momentum effect spreads widely in all of the twelve emerging markets, as the primary driving factor for the overall momentum effect. Besides, the inter-style momentum strategy has distinct property in all kinds of markets, leading to the poor performance of momentum strategy in some markets. It is also discovered in the cross-section regression that in emerging markets, the style-adjusted firm-specific return is in evidently positive correlation with the future stock return, but the relationship between the style return and future stock return is uncertain.
© 2017 AESS Publications. All Rights Reserved.
Keywords: Momentum effect, Style investing, Firm-specific momentum, Stock returns, Emerging market, Return decomposition.
JEL Classification: G12, G14, G15.
Received: 16 September 2016/ Revised: 5 October 2016/ Accepted: 26 October 2016/ Published: 5 November 2016
Contribution/ Originality
This study uses new decomposition methodology to analyze the poor performance of the momentum effect in emerging markets. While there is a significant intra-style momentum effect in all of the twelve emerging markets, the different properties of inter-style momentum capture the variation of momentum effect in these markets.
1. INTRODUCTION
Emerging markets are now playing an increasingly important role in the international stock investment. Momentum effect, as a market anomaly that can achieve evidently excessive profits, has been widely studied by scholars (Fama and French, 2012; Asness et al., 2013). However, due to the limits of samples and data quality, studies on the momentum of emerging markets are insufficient in the depth when compared with developed markets.
Most of previous studies on the momentum effect of emerging markets insisted that the momentum effect of stock return in emerging markets is evidently weaker than the developed market (Rouwenhorst, 1999; Chui et al., 2010). According to Hameed and Kusnadi (2002) the disappearance of momentum profit may be caused by the high volatility of emerging markets. Chui et al. (2003) presented a theory that unique legal systems and corporate ownership structures suppress momentum in the Asian capital market. However, previous studies almost focus on the relationship between the momentum profits and one of the market characteristic, without analyzing the source and the composition of momentum effects. Combining the style investing, we provide a new decomposition approach to study the composition of the momentum effect in emerging markets and the reason why it is weaker than that in developed markets.
Style investing refers that investors would classify and analyze the stocks in the market according to the characteristics. Barberis and Shleifer (2003) insisted that style momentum is the result of positive feedback trading at the style level. Froot and Teo (2008) discovered that the capital flow and style returns can predict the future stock return positively, according to studies on the capital flow of institutional investors. Compared with developed markets, retail investors in emerging markets hold a great proportion. As they are less mature in securities analysis, they prefer making investment decision assisted by the style classification. Therefore, the momentum studies in emerging markets can benefit from the perspective of style investing.
In this paper, studies have been conducted for the short-term and middle-term momentum strategies of all the twelve emerging markets. By decomposing the stock return into the firm-specific return and style return, the traditional momentum effect is also decomposed to the intra-style momentum effect and inter-style momentum effect. Although some emerging markets fail to show the profitability of traditional momentum strategy, all the emerging markets have displayed significantly positive intra-style momentum effect. Furthermore, the intra-style momentum effect is the main composition and driven factor of the stock return momentums in emerging markets.
Meanwhile, the inter-style momentum effect reflects the characteristics of investing at the style level, and there are great differences in each country. In most of the markets, the returns are negative, which offset the positive return of the intra-style momentum and lead to the loss of traditional momentum profitability in emerging markets. The result is not consistent with the US style momentum effect caused by the positive-feedback style investing (Barberis and Shleifer, 2003; Chao et al., 2012) indicating that the style investors in emerging markets behave differently from those in developed markets. The style momentum is also not a widespread effect in emerging markets.
Furthermore, according to the subsequent cross-section analysis, it is discovered that firm-specific return in all markets predict the future return evidently—the previous high firm-specific return meant high future stock return. However, the conclusion of the impact of style return on the future stock return is mixed. The result further affirms our previous findings, namely the intra-style firm-specific return is the primary driving force of the momentum profits of emerging markets, but for most emerging markets, there is not an evident correlation between the style return and future stock return.
The reminder of this paper is organized as follows. Section 2 introduces the methodology of the momentum decomposition, data applied in studies and the empirical result of momentum decomposition; Section 3 further studies the impact of firm-specific return and style return on the future stock return through Fama-Macbeth cross-sectional regression; Section 4 presents robustness tests of our results, and Section 5 concludes.
2. MOMENTUM DECOMPOSITION
2.1. Methodology
At the start of each month, our momentum portfolio are constructed based on the accumulative return of the past six months. We omitting the most recent month’s return to avoid the short-term reversal, which is related to the liquidity providing and market microstructure. Followed by Lo and MacKinlay (1990) the weight of security i depends on its past return ( ) relative to the return of the equal-weighted market portfolio (
 ):
):
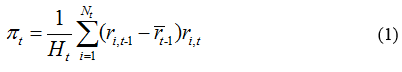
where  denotes the number of securities at time t, and
 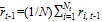 is the equal-weighted market return during the formation period. Scaling factor
 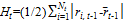 makes our momentum portfolio a zero-cost strategy with one dollar in each position. We hold our momentum position for K months, namely the 6-K strategy. For the sake of brevity, we focus on the short-term momentum (K=1) and the medium-term momentum (K=6).
To decompose the momentum returns, we needed to pair each security with its style. At each month constructing our momentum portfolios, we sort all the stocks into three portfolios based on their previous month’s market value. The breakpoints were determined by equally spaced percentiles. Each portfolio is subdivided into another three portfolios based on their ranked values of B/M. Thus, we obtained  double-sorted size-B/M portfolios with their stock numbers basically equal.
Our decomposition method is similar to Da et al. (2011) and Hameed and Mian (2015). At time t, the number of stocks in each portfolio is roughly  . We define the portfolio that stock i belongs to as m, m=1,…, 9. The traditional momentum profits can be expressed as:
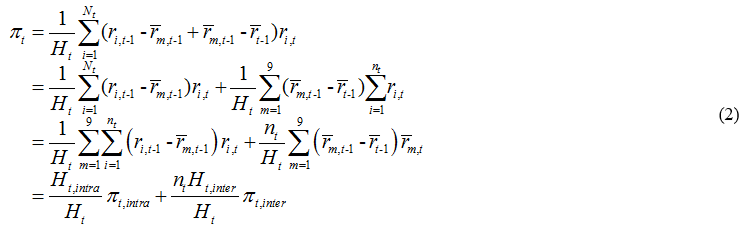
where 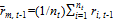 and
and  denote the return of style m during the formation and holding periods, respectively. The intra-style momentum and inter-style momentum profits are:
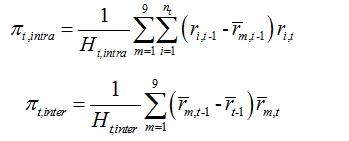
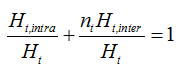
Parameters 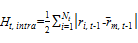 and
and 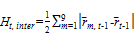 scale investments in these portfolios to one dollar long and one dollar short. Proportionality factors
  and
and  satisfy:
As the nine portfolios allowed us to measure style investing returns in the market (Wahal and Yavuz, 2013) the traditional momentum returns can be decomposed to the linear combination of intra-style and inter-style momentum profits. Therefore, after controlling for the style component of the stock returns, the intra-style momentum level reflects variation patterns of firm-specific returns, while the inter-style profits exhibit features of style return momentum.
2.2. Data
Previous studies on the international momentum effect usually deemed several markets as a whole according to their territories. Such market integration hypothesis is proper for developed markets, such as America, Canada, EU members. However, for emerging markets, their capital market usually has a low degree of openness, and lacks powerful institutional investors in the inter-market investment. Consequently, the financial assets in emerging markets are priced locally, rather than globally (Cakici et al., 2013; Hanauer and Linhart, 2015). Twelve emerging markets which have a relatively large stock market are selected for researching, including eight from Asia: namely China, Taiwan, South Korea, Malaysia, the Philippines, Thailand, Indonesia and India, and two from Europe, namely Poland and Russia, one from Africa, namely South Africa, one from America, namely Brazil.
The data in China’s stock market comes from WIND database, the data of other emerging markets are extracted from Compustat Global, and one-month U.S. Treasury bill rate comes from CRSP. Some literatures indicate that the quality of stock market data in the emerging markets is not as good as the data from CRSP (Hong et al., 2003). We exclude stocks whose share price is less than one or market capitalization is below the 2th percentile of all the stocks within each market in each month. We include stock returns only with values within the 2 percentile and the 98 percentile of the return distribution in each month for each market. Furthermore, at the start of each month, we excluded stocks without 12 months of past returns to eliminate suspension and IPO effects.
Since all markets are of distinct scale and development degree, there should be differences in the sample period. In particular, we require each market to have at least 90 stocks at the beginning of the sample period to meet our stock selection criteria and all the sample period end in December 2015. The Table 1 lists the descriptive statistics of the twelve stock markets.
Table-1. Descriptive statistics
| Market | Start | Stocks/month | Market value | Equal- weighted |
Value- weighted |
|||||||
| Min | Mean | Max | Min | Mean | Max | |||||||
| Brazil | 200602 | 90 | 127 | 154 | 2.12E+06 | 1.51E+11 | 4.76E+13 | 0.59% | -0.18% | |||
| China | 199412 | 93 | 803 | 1519 | 2.31E+08 | 1.02E+10 | 4.62E+12 | 1.65% | 1.00% | |||
| India | 200106 | 83 | 891 | 1816 | 1.65E+07 | 2.98E+10 | 5.36E+12 | 1.73% | 1.34% | |||
| Indonesia | 199905 | 100 | 165 | 299 | 3.78E+09 | 6.65E+12 | 4.74E+14 | 1.02% | 0.81% | |||
| Korea | 199608 | 111 | 462 | 991 | 1.38E+08 | 8.82E+11 | 2.27E+14 | 0.45% | 0.60% | |||
| Malaysia | 199609 | 59 | 142 | 202 | 2.04E+07 | 2.33E+09 | 9.23E+10 | -0.12% | 0.02% | |||
| Philippines | 201007 | 87 | 107 | 125 | 5.33E+07 | 5.21E+10 | 7.45E+11 | 0.31% | 0.70% | |||
| Poland | 200602 | 90 | 203 | 282 | 4.78E+06 | 1.53E+09 | 8.05E+10 | -0.33% | -0.20% | |||
| Russia | 201102 | 94 | 112 | 141 | 4.77E+07 | 1.30E+11 | 5.49E+12 | -2.00% | -0.20% | |||
| South Africa | 199805 | 83 | 142 | 180 | 1.32E+07 | 1.22E+10 | 4.41E+12 | 0.61% | 0.69% | |||
| Taiwan | 200202 | 90 | 587 | 958 | 1.06E+08 | 1.96E+10 | 3.90E+12 | 0.51% | -1.03% | |||
| Thailand | 199905 | 132 | 308 | 543 | 4.20E+07 | 2.27E+10 | 1.17E+12 | 0.51% | 0.42% | |||
Source: The data in China’s stock market comes from WIND database, the data of other emerging markets are extracted from Compustat Global.
According to Table 1, excluding the Philippines and Russia, the sample period of each market is above 9 years. Benefited from the rapid development of emerging markets, the number of stocks in the sample period grows rapidly. The average stock number of all markets is above 100, which guarantee that with more than 10 stocks in each of the nine styles divided. Thus, we could diversify the idiosyncratic risk within styles, and separate the firm-specific return from style return effectively. In the twelve emerging markets, the country with the highest equal-weighted return is India, about 1.73% per month, and the lowest is Russia, about -2.00%; the country with the highest value-weighted return is India, about 1.34%, while the lowest is Taiwan, about -1.03%.
2.3. Empirical Result of Momentum Decomposition
In the empirical study, we focus on the short-term and middle-term momentum strategy which has one or six month holding period and constructed basing on the previous six-month cumulative returns. Table 2 presents the result of momentum decomposition of each market. The Initial, Intra-style and Inter-style denote the traditional momentum, intra-style momentum and inter-style momentum profits ( ,
,  and
and  in equation 2), respectively.
According to the above table, all the twelve emerging markets can be divided into three types for discussion. The first type includes Brazil, the Philippines, Russia and South Africa. The intra-style and inter-style momentum profit of the four markets is remarkably positive, leading their combinations—traditional momentum effect significantly positive. The second includes India, Indonesia, Poland, and Thailand, in which, the intra-style momentum effect of the four markets is also remarkably positive, but the inter-style momentum effect is mostly negative and insignificant.
Table-2. Empirical Result of Momentum Decomposition
| Market | K=1 | K=6 | ||||||
| Initial | Intra-style | Inter-style | Initial | Intra-style | Inter-style | |||
| Brazil | 0.0093 (3.29) |
0.0068 (2.93) |
0.0025 (2.39) |
0.0317 (1.57) |
0.0257 (1.54) |
0.0060 (1.12) |
||
| China | 0.0006 (0.28) |
0.0028 (1.61) |
-0.0021 (-2.08) |
0.0240 (1.98) |
0.0252 (2.69) |
-0.0012 (-0.25) |
||
| India | 0.0056 (1.70) |
0.0079 (3.45) |
-0.0023 (-1.28) |
0.0483 (2.36) |
0.0491 (2.77) |
-0.0008 (-0.12) |
||
| Indonesia | 0.0070 (1.99) |
0.0070 (2.80) |
-0.0001 (-0.03) |
0.0432 (1.95) |
0.0383 (2.08) |
0.0049 (0.86) |
||
| Korea | -0.0013 (-0.41) |
-0.0005 (-0.19) |
-0.0008 (-0.62) |
0.0152 (0.85) |
0.0239 (2.04) |
-0.0087 (-0.84) |
||
| Malaysia | 0.0044 (1.47) |
0.0046 (2.22) |
-0.0001 (-0.09) |
0.0044 (0.39) |
0.0137 (1.64) |
-0.0092 (-1.67) |
||
| Philippines | 0.0087 (2.42) |
0.0058 (1.94) |
0.0029 (1.67) |
0.0468 (2.24) |
0.0350 (2.17) |
0.0118 (1.45) |
||
| Poland | 0.0098 (2.90) |
0.0100 (3.91) |
-0.0002 (-0.17) |
0.0417 (1.48) |
0.0419 (2.10) |
-0.0002 (-0.02) |
||
| Russia | 0.0094 (1.75) |
0.0069 (1.45) |
0.0025 (1.44) |
0.0525 (2.64) |
0.0387 (2.62) |
0.0138 (2.21) |
||
| South Africa | 0.0089 (3.87) |
0.0080 (4.22) |
0.0009 (1.22) |
0.0474 (3.39) |
0.0407 (3.47) |
0.0067 (1.96) |
||
| Taiwan | 0.0024 (0.83) |
0.0048 (1.83) |
-0.0024 (-2.74) |
0.0160 (1.24) |
0.0233 (2.13) |
-0.0073 (-1.68) |
||
| Thailand | 0.0070 (2.29) |
0.0071 (2.68) |
-0.0001 (-0.16) |
0.0227 (1.50) |
0.0244 (1.81) |
-0.0016 (-0.40) |
||
Notes: The average return and Newey-West adjusted t-statistic with K-1 lags (in parentheses) are presented in this table.
As a result, the inter-style momentum effect dilutes the profits gained from intra-style momentum effect, and weakens the overall momentum effect of the market. The third type includes China, South Korea, Malaysia and Taiwan, which has significantly positive intra-style momentum effect and significantly negative inter-style momentum effect, which may offset mutually, and result in the disappearance of either momentum or reversals of the market.
Generally, although the traditional momentum strategy cannot obtain significant excess profits in some emerging markets, almost all of the twelve emerging markets have a significantly positive intra-style momentum effect, suggesting that the intra-style momentum effect is the primary driven factor of the return momentum in emerging markets. Meanwhile, there are great differences in the inter-style momentum effect of all countries, and most of the earnings are negative, which offsets the positive earnings of intra-style momentum effect to some extent.
3. FAMA-MACBETH CROSS-SECTIONAL REGRESSION
Previously-stated momentum decomposition method shows that the firm-specific return momentum is the primary driven factor of the momentum effect of emerging markets. But the source of momentum profits may come from the return persistence, negative cross-autocorrelation of individual security returns, and cross-sectional variance of expected returns (Lo and MacKinlay, 1990). Therefore, analysis will be further carried out for studying the impact of firm-specific return and style return on the future stock return.
When controlled the risk proxies and stock ratios that may impact the stock returns, cross-section regression allows us to analyze the relationship between the style return, firm-specific return and stock return in holding period. If the intra-style firm-specific return drives momentum effect in emerging markets, while the style returns has a small impact on the future stock return, it can be seen from the regression that only the firm-specific return in the observation period has a significant positive impact on the future stock returns. The following test is conducted for the cumulative stock return in the holding period with the Fama and MacBeth (1973) regressions.
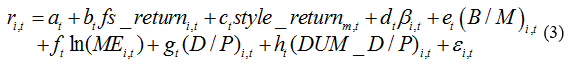
Where i=1,…, , m=1,…,9. At time t constructing our momentum portfolios, the dependent variable >
 is the return of security i during the holding period, the independent variables
  denotes the firm-specific return of security i in the formation period, and
  denotes the style return which the stock belongs to in forming period. The control variable
  is the the stock beta estimated from 12 months of rolling regressions of excess returns on value-weighted market returns,
 is the book-to-market value of security i,
  is measured by the market value of equity in time t; Followed by Campbell and Shiller (1988) we also controlled the dividend yield for its predictive ability of stock returns.
  is the dividend yield of security i, and
  is a dummy variable that equals one when
  and equals zeros other else.
Table-3. Fama-MacBeth Cross-sectional Regressions
| Market | fs_return | style_return | ||||
| K=1 | K=6 | K=1 | K=6 | |||
| Brazil | 0.0210 (3.06) |
0.0953 (1.92) |
0.0322 (2.21) |
0.2094 (2.22) |
||
| China | 0.0096 (2.07) |
0.0822 (2.89) |
0.0119 (0.75) |
0.1680 (1.11) |
||
| India | 0.0155 (3.35) |
0.0883 (2.44) |
0.0059 (0.45) |
0.0388 (0.47) |
||
| Indonesia | 0.0150 (3.07) |
0.0766 (2.70) |
0.0053 (0.40) |
0.0811 (1.45) |
||
| Korea | 0.0046 (0.89) |
0.0664 (2.65) |
-0.0063 (-0.45) |
-0.0547 (-0.82) |
||
| Malaysia | 0.0136 (2.02) |
0.0564 (1.98) |
-0.0018 (-0.12) |
0.0502 (0.89) |
||
| Philippines | 0.0173 (2.61) |
0.1137 (2.48) |
0.0182 (0.78) |
0.0104 (0.11) |
||
| Poland | 0.0233 (4.35) |
0.1032 (2.58) |
0.0059 (0.41) |
0.1126 (1.52) |
||
| Russia | 0.0263 (2.33) |
0.1141 (2.34) |
0.0289 (0.87) |
0.0958 (1.34) |
||
| South Africa | 0.0224 (4.23) |
0.1325 (3.70) |
0.0278 (2.03) |
0.1513 (2.22) |
||
| Taiwan | 0.0118 (2.28) |
0.0416 (1.96) |
-0.0222 (-1.38) |
-0.1830 (-1.83) |
||
| Thailand | 0.0186 (3.53) |
0.0789 (2.44) |
0.0388 (2.93) |
0.1612 (2.53) |
||
Notes: Reported are the coefficient estimates and Newey-West adjusted t-statistics with K-1 lags (in parentheses) of the Fama-MacBeth cross-sectional regressions.
Table 3 reports the coefficient estimated by the Fama-Macbeth cross-sectional regression. In all emerging markets, excluding the short-term of South Korea, all fs_return coefficients are significantly positive, showing that after controlling of stock characteristics, the style-adjusted firm-specific return lead to the persistence and momentum effect in the stock returns. According to the gradual-information-diffusion hypothesis (Barberis et al., 1998; Daniel et al., 1998) that information is diffused gradually among investors, our intra-style momentum consists with Hong and Stein (1999): firm-specific information diffuses gradually across the investment public, and the persistence of firm-specific returns further generates momentum.
On the other hand, in all of the emerging markets excluding Brazil, South Africa, Taiwan and Thailand, the relationship between the style return and stock return in the future holding period is not significant. In Brazil, South Africa and Thailand, the coefficient of style_return is significantly positive. But for Taiwan market, the style_return coefficient is not significant in the short-term, but significantly negative in the middle-term. The result is not consistent with the result of Teo and Woo (2004) — they had found out in the studies on American market that style return has a positive but insignificant effect on the future short-term and middle-term returns. Our cross-section regression result also shows that there are great differences in the influence of style investing on stock return in every emerging markets. Comprehensively, the result of Fama-MacBeth cross-sectional regression further confirms the previous result of momentum return decomposition. According to our decomposition method, the stock return in formation period is the sum of style return and firm-specific return. Although there is a consistent positive relation between the firm-specific return and future stock return, there are still great differences in the relationship between the cumulative historical return and future return in all markets due to the great differences in the influence of style return on future stock returns.
Table-4. Momentum Decomposition with Variation in Style Definitions
| Market | K=1 | K=6 | |||||||||||
| Intra-style | Inter-style | Intra-style | Inter-style | ||||||||||
| Size | B/M | Size | B/M | Size | B/M | Size | B/M | ||||||
| Brazil | 0.0081 (3.41) |
0.0074 (2.87) |
0.0013 (1.17) |
0.0020 (2.54) |
0.0312 (1.74) |
0.0242 (1.33) |
0.0005 (0.09) |
0.0076 (2.04) |
|||||
| China | 0.0024 (1.24) |
0.0023 (1.16) |
-0.0018 (-2.45) |
-0.0017 (-1.92) |
0.0241 (2.24) |
0.0265 (2.57) |
-0.0001 (-0.04) |
-0.0024 (-0.53) |
|||||
| India | 0.0081 (3.20) |
0.0078 (3.26) |
-0.0025 (-1.63) |
-0.0022 (-1.42) |
0.0482 (2.50) |
0.0493 (2.74) |
0.0001 (0.02) |
-0.0010 (-0.17) |
|||||
| Indonesia | 0.0073 (2.66) |
0.0080 (3.05) |
-0.0003 (-0.20) |
-0.0010 (-0.64) |
0.0418 (2.00) |
0.0431 (2.31) |
0.0014 (0.32) |
0.0001 (0.02) |
|||||
| Korea | -0.0006 (-0.21) |
0.0011 (0.42) |
-0.0007 (-0.75) |
-0.0025 (-2.13) |
0.0164 (1.21) |
0.0257 (2.06) |
-0.0013 (-0.19) |
-0.0105 (-1.24) |
|||||
| Malaysia | 0.0035 (1.57) |
0.0053 (2.15) |
0.0010 (0.54) |
-0.0008 (-1.06) |
0.0101 (1.21) |
0.0078 (0.78) |
-0.0056 (-1.01) |
-0.0033 (-1.28) |
|||||
| Philippines | 0.0049 (1.59) |
0.0071 (2.13) |
0.0038 (2.28) |
0.0016 (1.73) |
0.0299 (1.96) |
0.0453 (2.23) |
0.0169 (2.11) |
0.0015 (0.38) |
|||||
| Poland | 0.0095 (3.10) |
0.0100 (3.96) |
0.0003 (0.38) |
-0.0002 (-0.13) |
0.0393 (1.60) |
0.0451 (2.20) |
0.0024 (0.53) |
-0.0034 (-0.33) |
|||||
| Russia | 0.0060 (1.30) |
0.0092 (1.80) |
0.0034 (1.88) |
0.0003 (0.32) |
0.0327 (2.39) |
0.0533 (2.68) |
0.0198 (2.61) |
-0.0008 (-0.33) |
|||||
| South Africa | 0.0081 (3.92) |
0.0078 (4.00) |
0.0008 (1.25) |
0.0011 (1.60) |
0.0422 (3.25) |
0.0414 (3.47) |
0.0052 (2.27) |
0.0060 (1.66) |
|||||
| Taiwan | 0.0028 (1.04) |
0.0058 (2.15) |
-0.0004 (-0.67) |
-0.0033 (-2.99) |
0.0178 (1.51) |
0.0233 (2.10) |
-0.0018 (-0.73) |
-0.0073 (-1.69) |
|||||
| Thailand | 0.0077 (2.75) |
0.0065 (2.31) |
-0.0007 (-0.75) |
0.0004 (0.64) |
0.0243 (1.67) |
0.0255 (1.83) |
-0.0016 (-0.55) |
-0.0028 (-0.82) |
|||||
Notes:
1.The size method is the first one that separates the intra-style component from the inter-style component based on nine size-sorted portfolios; The B/M method is used to divide all of the firms into 9 portfolios based on their B/M values.
2.Both the average returns and Newey-West adjusted t-statistics with K-1 lags (in parentheses) of intra-style momentum ( ) and inter-style reversal (
 ) are presented in the table.
4. ROBUSTNESS TEST
In the robustness test, twin style (Barberis and Shleifer, 2003) is considered to study the impact of decomposition method on the momentum effect decomposition. The so-called twin style refers to two types of substitutive stocks, and investors may decide whether to invest in the twin style according to the relative performance of one style. Previous studies discovered that when styles are considered as better substitute, continuity and reversal of style investing will also be strengthened (Teo and Woo, 2004). Therefore, if investors are indeed considering the relative performance both from the style investing and intra-style investing perspectives, better twin-style division method would make the intra-style return anomaly and inter-style return anomaly much more significant after the return decomposition.
In previous studies, the stock style is judged from the independent sorting by size and value. In this chapter, we consider two natural pairs of style classification respectively: small and large, and value and growth. Since the value-growth is a better twin style choice than the large-small for the twin styles (Teo and Woo, 2004; Kumar, 2009) the result according to the value-growth decomposition shall be much more significant than the result of large-small decomposition theoretically.
Stock size and B/M is selected as the style classification standard for the momentum return decomposition respectively. In order to be consistent with the previous text, stocks are respectively divided into nine portfolios according to their stock market cap and B/M. The momentum return decomposition is carried out according to equation 2. Table 4 presents the short-term and middle-term momentum return composition ( and ) obtained by constructing style portfolios according to two different methods.
According to our previous analysis, the intra-style momentum of all emerging markets is significantly positive, but the result of inter-style is quite distinct. In addition, the sum of inter-style and intra-style momentum returns obtained with two different decomposition methods is the same, the analysis for one of the returns can also reflect the other to a certain degree. Therefore, the comparative analysis of Table 4 mainly aims at the intra-style momentum for the convenience.
It can be seen from Table 4 that for short-term intra-style momentum (K=1), all markets, excluding Brazil, China and Thailand, the returns obtained from the value-growth decomposition is much more significant. In the middle term, excluding Brazil and Malaysia, the return obtained according to the value-growth decomposition is much more significant. Therefore, as a whole, the value-growth momentum decomposition provide a better way to separate the intra-style and inter-style composition in stock return momentum effect. It also suggests that when the styles are better substitutes, investors will prefer making investment decisions responding to their relative return, which may lead to the continuity or reversal of firm-specific return and style return. Meanwhile, the robustness result also further verifies that intra-style momentum spreads widely in all emerging markets, but there are great differences in the performance of inter-style momentum strategies in all markets.
5. CONCLUSION
Previous studies indicated that the momentum effect of emerging market is weaker than that of developed market. According to the momentum return decomposition in this paper, it is discovered that there is a significant intra-style momentum effect in the twelve emerging markets, and it is also the primary driven force of the traditional momentum effect. Meanwhile, profits of inter-style momentum strategy shows different properties in all markets, which may strengthen or weaken the impact of intra-style momentum effect on the stock return, leading to the weakening or disappearing of the overall momentum effect in some emerging markets.
Secondly, according to the cross-section regression, the positive-feedback transaction mechanism of style investing in Barberis and Shleifer (2003) model is not widespread in emerging markets. On the contrary, the style-adjusted firm-specific return is in significantly positive correlation with the future stock return, suggesting that investors tend to underreact to the firm-specific information within styles.
It is discovered that researches of momentum effect in emerging markets should be considered from the intra-style and inter-style perspectives. Different markets have certain generality, as well as certain differences. However, what factor drives the differences of inter-style momentum in different emerging countries remains to be further studied.
| Funding: This study received no specific financial support. |
| Competing Interests: The authors declare that they have no competing interests. |
| Contributors/Acknowledgement: All authors contributed equally to the conception and design of the study. |
REFERENCES
Asness, C.S., T.J. Moskowitz and L.H. Pedersen, 2013. Value and momentum everywhere. Journal of Finance, 68(3): 929-985. DOI 10.1111/jofi.12021.
Barberis, N. and A. Shleifer, 2003. Style investing. Journal of Financial Economics, 68(2): 161-199. DOI 10.1016/S0304-405X(03)00064-3.
Barberis, N., A. Shleifer and R. Vishny, 1998. A model of investor sentiment. Journal of Financial Economics, 49(3): 307-343. DOI 10.1016/S0304-405X(98)00027-0.
Cakici, N., F.J. Fabozzi and S. Tan, 2013. Size, value, and momentum in emerging market stock returns. Emerging Markets Review, 16: 46-65. DOI 10.1016/j.ememar.2013.03.001.
Campbell, J.Y. and R.J. Shiller, 1988. Stock prices, earnings, and expected dividends. Journal of Finance, 43(3): 661-676 DOI 10.1111/j.1540-6261.1988.tb04598.x.
Chao, H.Y., C. Collver and N. Limthanakom, 2012. Global style momentum. Journal of Empirical Finance, 19(3): 319-333. DOI 10.1016/j.jempfin.2012.02.001.
Chui, A.C., S. Titman and K.J. Wei, 2010. Individualism and momentum around the world. Journal of Finance, 65(1): 361-392. DOI 10.1111/j.1540-6261.2009.01532.x.
Chui, C.W., Andy, T. Sheridan and W.K.C. John, 2003. Momentum, legal systems and ownership structure: An analysis of asian stock markets. Available from SSRN 265848. DOI 10.2139/ssrn.265848.
Da, Z., Q. Liu and E. Schaumburg, 2011. Decomposing short-term return reversal. Retrieved from SSRN 1551025.
Daniel, K., D. Hirshleifer and A. Subrahmanyam, 1998. Investor psychology and security market under-and overreactions. Journal of Finance, 53(6): 1839-1885. DOI 10.1111/0022-1082.00077.
Fama, E.F. and K.R. French, 2012. Size, value, and momentum in international stock returns. Journal of Financial Economics, 105(3): 457-472. DOI 10.1016/j.jfineco.2012.05.011.
Fama, E.F. and J.D. MacBeth, 1973. Risk, return, and equilibrium: Empirical tests. Journal of Political Economy, 81(3): 607-636. DOI 10.1086/260061.
Froot, K. and M. Teo, 2008. Style investing and institutional investors Journal of Financial and Quantitative Analysis, 43(04): 883-906. DOI http://dx.doi.org/10.1017/S0022109000014381.
Hameed, A. and Y. Kusnadi, 2002. Momentum strategies: Evidence from pacific basin stock markets. Journal of Financial Research, 25(3): 383-397. DOI 10.1111/1475-6803.00025.
Hameed, A. and G.M. Mian, 2015. Industries and stock return reversals. Journal of Financial and Quantitative Analysis, 50(1-2): 89-117. DOI http://dx.doi.org/10.1017/S0022109014000404.
Hanauer, M.X. and M. Linhart, 2015. Size, value, and momentum in emerging market stock returns: Integrated or segmented pricing? Asia-pacific. Journal of Financial Studies, 44(2): 175-214. DOI 10.1111/ajfs.12086.
Hong, D., C. Lee and B. Swaminathan, 2003. Earnings momentum in international markets. Retrieved from SSRN 390107.
Hong, H. and J.C. Stein, 1999. A unified theory of underreaction, momentum trading, and overreaction in asset markets. Journal of Finance, 54(6): 2143-2184. DOI 10.1111/0022-1082.00184.
Kumar, A., 2009. Dynamic style preferences of individual investors and stock returns. Journal of Financial and Quantitative Analysis, 44(03): 607-640. DOI http://dx.doi.org/10.1017/S0022109009990020.
Lo, A.W. and A.C. MacKinlay, 1990. When are contrarian profits due to stock market overreaction? Review of Financial Studies, 3(2): 175-205. DOI 10.1093/rfs/3.2.175.
Rouwenhorst, K.G., 1999. Local return factors and turnover in emerging stock markets. Journal of Finance, 54(4): 1439-1464. DOI 10.1111/0022-1082.00151.
Teo, M. and S.J. Woo, 2004. Style effects in the cross-section of stock returns. Journal of Financial Economics, 74(2): 367-398. DOI 10.1016/j.jfineco.2003.10.003.
Wahal, S. and M.D. Yavuz, 2013. Style investing, comovement and return predictability. Journal of Financial Economics, 107(1): 136-154. DOI 10.1016/j.jfineco.2012.08.005.
| Views and opinions expressed in this article are the views and opinions of the author(s), Asian Economic and Financial Review shall not be responsible or answerable for any loss, damage or liability etc. caused in relation to/arising out of the use of the content. |