


DISCRIMINATION AND INEQUALITY IN AN INTEGRATED WALRASIAN-GENERAL-EQUILIBRIUM AND NEOCLASSICAL-GROWTH THEORY

1Ritsumeikan Asia Pacific University, Japan
ABSTRACT
The purpose of this study is to examine dynamicinterdependence between economic development, wealth and income distributions, and discrimination in an integrated Walrasian-general-equilibrium and neoclassical-growth theory. Webuild a dynamic economy with one consumer goods sector,one capital goods sector, and heterogeneous households. We build a model in which wealth accumulation, income and wealth distribution, time distribution and division of labor interact with each other under a fixed pattern of discrimination. For illustration, we simulate the motion of the economic system with three groups, called the discriminator, the neutral group (neither discriminating nor being discriminated), and the discriminated group. We identify the existence of a unique stable equilibrium point. Our comparative dynamic analyses with regard to different discrimination rates provide some insights. For instance, we show that when the discriminator strengthens its discrimination against the discriminated group and the discriminated group “positively” reacts the strengthened discrimination, we have the following effects: the national output, the national wealth, the total labor supply, and the output levels and the input factors of the two sectors are increased; the lump sum transfer from the discriminated group to the discriminator is increased; the discriminated group’s wage rate is augmented and the other two groups’ wage rates are slightly affected; the discriminator’s work time is reduced, the discriminated group’s work time is increased, and the neutral group’s work time is slightly affected; the discriminated group’s and the discriminator’s consumption and wealth levels are increased, and the neutral group’s consumption and wealth levels are slightly affected.
© 2017 AESS Publications. All Rights Reserved.
Keywords:Discrimination,Economic growth, Lump income transfer, Inequality, Walrasian general equilibrium theory, Neoclassical growth theory.
JEL Classification: O120, E130, J71.
Received: 13 August 2016/ Revised: 22September 2016/ Accepted: 17October 2016/ Published: 5November 2016
Contribution/ Originality
This study makes a unique approach to relationship between economic growth and discrimination in an integrated Walrasian general equilibrium and neoclassical growth theory. The general equilibrium dynamic approach makes it possible to examine all the effects of discrimination on different people over time.
1. INTRODUCTION
Discrimination is conducted against different people in different forms over human history in different parts of the world. For instance, slavery had been conducted over a long period in the United States. After the end of slavery, discrimination under the embracement of US legal system was continued for a long time in the form of stated-sponsored racial segregation in schools, transportation and public accommodations (Higgs, 1977; Feagin, 2000; Zhang, 2003). In modern times racial and gender discrimination is still conducted in different parts of the world (Coussey, 2002). As argued byArrow (1998), “Racial discrimination pervades every aspect of a society in which it is found. It is found above all in attitudes of both groups, but also in social relations, in intermarriage, in residential location, and, frequently, in legal barriers. It is also found in levels of economic accomplishment; that is, income, wages, prices paid, and credit extended. This economic dimension hardly appears in general treatments of economics, outside of the specialized literature devoted to it.” Although there are some studies about discrimination in economics (e.g., (Becker, 1957; Welch, 1967;1975; Bergmann, 1971; Phelps, 1972; Loury, 1977; Borjas, 1992; Whatley and Wright, 1994; Carneiro et al., 2005; Shi, 2006; Charles and Guryan, 2008; Gabriel and Schmitz, 2014)) it is argued that there are only a few formal economic models which explicitly deal with economic growth and distribution in income and wealth with discrimination. This study attempts to deal withdynamic interdependence between economic growth, economic structure, and discrimination. We are concerned with on the role of discrimination on interdependence between growth and income and wealth distributions.
To deal with economic effects of discrimination, it is necessary to make the analysis in a general framework with heterogeneous households. Nevertheless, traditional dynamic economic theories are poor at studying economic issues related to wealth and income distribution with endogenous saving between heterogeneous households. This study analyzes economic growth with discrimination by integrating the Walrasian general equilibrium theory and the neoclassical growth theory. The Walrasian general modelhas played the role of a key model of modern general equilibrium theory. Walras initially developed the model. The model has been further mathematically refined and developed by Arrow, Debreu and others (e.g., (Walras, 1874; Arrow and Debreu, 1954; Gale, 1955; Nikaido, 1956;1968; Debreu, 1959; McKenzie, 1959; Arrow and Hahn, 1971; Mas-Colell et al., 1995)). The general equilibrium theory is an important framework for economists to study interactions between production and consumption. The theory analyseseconomic exchanges among heterogeneous industries and households as an integrated whole. Nevertheless, irrespective of many efforts, economists have not been very successful in developing the theory to include endogenous capital and income and wealth distributions among heterogeneous households. Zhang(Zhang, 2014)has recently integrated Walrasian-general-equilibrium and neoclassical-growth theories in a unified framework. Zhang’s unique approach to household behavior is important as it enables us to build analytically tractable growth models with heterogeneous households and multiple economic sectors with microeconomic foundation. We introduce economic mechanisms of endogenous wealth accumulation with discrimination into Zhang’s analytical framework.
Walras attempted to include saving and capital accumulation in his general equilibrium theory. Nevertheless, he was not successful in introducing capital accumulation. Impicciatore et al. (2012) observe: “because of the absence of an explicit temporal indexation of the variables, the timeframe of Walras’ theory is left to the reader’s interpretation. In particular, it remains an open question whether the model is static (that is, a single-period model) or dynamic, and, in the latter case, if it pertains to the short run or long run.” Over years many economists have made great efforts to develop Walras’ capital accumulation theory (e.g., (Morishima, 1964;1977; Diewert, 1977; Eatwell, 1987; Dana et al., 1989; Montesano, 2008)). But these attempts failed to solve the problem of giving microeconomic foundation for wealth accumulation. It should be noted that some models have been proposed in the literature of economic growth, trying to synthesizing neoclassical growth theory and the general equilibrium theory (e.g.,Jensen and Larsen (2005)). As reviewed by Shoven and Whalley (1992) “Most contemporary applied general models are numerical analogs of traditional two-sector general equilibrium models popularized by James Meade, Harry Johnson, Arnold Harberger, and others in the 1950s and 1960s. Earlier analytical work with these models has examined the distortionary effects of taxes, tariffs, and other policies, along with functional incidence questions.” However, only a few formal dynamic models in the neoclassical growth theory are developed to deal with income and wealth among heterogeneous households (Solow, 1956; Burmeister and Dobell, 1970; Barro and Sala-I-Martin, 1995). Zhang (2012)applies an alternative approach to household behavior by Zhang (1993)to unify the neoclassical growth theories and the Walrasian general equilibrium within a and by using This study is to examine effects of discrimination on economic growth and inequality in income and wealth within the framework proposed by Zhang. The organization of the rest paper is as follows. In section we introduce the basic growth modelof economic distribution with endogenous wealth and income distributionbetween heterogeneous households. Insection 3 we examine dynamic properties of the model and simulate the three-groupmodel. In section 4 we conduct comparative dynamic analysis with regard to the discrimination rates. In section 5 we conclude the study.
2. THE BASIC MODEL
Following the traditional two-sector growth model in the neoclassical growth theory (Uzawa, 1961; Burmeister and Dobell, 1970; Azariadis, 1993; Barro and Sala-I-Martin, 1995)we consider that the economy has two sectors. Like in the Uzawa two-sector growth model, this study considers consumption and capital goods as different commodities. The two distinct sectors produce two different goods. The economic system has only one malleable capital good.The two sectors use capital good input factors. We use to stand for the constant depreciation rate of capital.The assets of the economy are owned by households. Householdsspend their incomes on consuming and saving. Only households make saving. Factors are inelastically supplied. We assume that the available factors are fully employed at every moment. All the firms’ earnings are distributed to factors of production, labor and capital ownership.The population is classified into  types of households. Households are identical within each group and people from different groups are different in human capital, preference and social status. A group’s social status is reflected in whether it is discriminated by some other groups, or discriminates some other groups, or has “neutral” relations with all the other groups. Each group has a fixed population,
  (
( ). It should be remarked that in the standard Walrasian general equilibrium theory,
  Wemeasure prices in terms of capital good.The price of capital good is unity. We use
  and
and  to stand for, respectively,the wage rate of worker of group
  .Let
.Let represent the total capital stock. The variable is fully employed by the two sectors. We denote capital goods and consumer goods sector with subscripts
  and
and  respectively. We use
  and
and  to represent the labor force and capital stocks employed by sector
 We use
  and
and  to represent thework time and leisure time of a typical worker in group
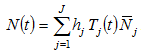
  The total qualified labor supply
  of the economy is the sum of labor inputs of all the groups
 (1)
(1)
We introduce
We assume that the labor force is fully employed. This assumption implies
 (2)
(2)
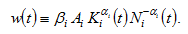
2.1. The Capital Goods Sector
We use the widely applied Cobb-Douglas production function in the literature of economic growth research (Kydland and Prescott, 1982; Lucas, 1988; Barro, 1990; Jones, 1995; Blanchard, 1997; Gollin, 2002; Hájková and Hurník, 2007) to describe economic production. The function  is specified as
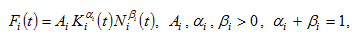 (3)
(3)
where the labor force is denoted by  physical capital by
  and
and 
 and
and  are parameters. The rate of interest and wage rate are determined by markets. Here, we assume thatthere is no discrimination in individual firms. Firms make decisions on the levels of factor inputs. It should be noted that
  and
and  are given for individual firms at each point in time. The marginal conditions of maximizing profits are given by
 (4)
(4)
where
2.2. Consumer Goods Sector
The production function of the consumer goods sector is
 (5)
(5)
The marginal conditions are
 (6)
(6)
where  is the price of consumer goods.
2.3. Consumer Behaviors and Wealth Dynamics
Zhang (1993)proposedan alternative approach to describe behavior of households. This study applies this approach. We assume that the economic effect of discrimination is transfer of money between groups. A simple case of income transfer between two types of households due to government taxation is modeled in Zhang (2005). This study is influenced by Zhang’s modeling of income transfers.
We consider that the preference for current and future consumption isdescribed by the consumer’s preference structure over leisure time, consumption and saving.Let per capita wealth of group  by denoted by
  We have
 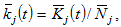 where
where  is the total wealth held by group
  Let
Let represent the lump sum transfer that group
  representative household receives from discrimination. If the group is discriminated, we have
  If the group discriminates other groups, we have
  We assume that discrimination is conducted against wage income, wealth, and consumer goods markets. For simplicity, we neglect possibilities of any discrimination against interest income from wealth. We also neglect possibilities that a group discriminates some other groups and at the same time is discriminated by some other groups. Per capita current disposable income from the interest payment
  the wage payment
  is given by
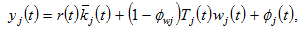
where  is the discrimination rate against group
  in wage income. If there is no discrimination against group
  in wage income, then
  otherwise
  We assume that the discrimination rates are constant during the study period. Similarly we introduce
  as the discrimination rate on wealth against group
  If there is no discrimination on wealth against group
  then
then  otherwise
  In this study, we omit possible discrimination on income from interest payments. It is straightforward to see that it is not difficult to include this kind of discrimination in our analytical framework. We define the per capita disposable income
 asthe sum of the current disposable income and the value of net wealth. We have
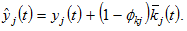 (7)
(7)
The disposable income is spent on saving and consuming. It is straightforward to see that we can treat the value,  (i.e.,
  with
with  ), in (7) as a flow variable. Ifone can sell wealth instantaneously without any transaction cost, the variable
 can be considered as the amount of the income that one gets at time
  by selling all of one’s wealth. The representative householdfrom group
  owns the income
  available to distribute between saving and consumption.
The representative household of group  would distributes the total available budget between saving
  and consumption of goods
  We represent the discrimination rate on group
  consumption by
 We have the following the budget constraint
 (8)
(8)
We use  to stand for the leisure time at time
  and
and  the (fixed) available time for work and leisure. The time constraint is given by
 (9)
(9)
Substituting (9) into (8) implies
 (10)
(10)
where

In our model, at each point in time, consumers have three variables to decide. We assume that utility level  that the consumer from group
  obtains is dependent on the leisure time,
  , the consumption level of consumption goods
  and the saving
  as follows
where we use  to denote the propensity to use leisure time,
  the propensity to consume consumption goods, and
  propensity to save. Although there are somegrowth models of heterogeneous households, the heterogeneity in most of these studies assumed to come from differences in initial endowments (e.g., (Chatterjee, 1994; Caselli and Ventura, 2000; Maliar and Maliar, 2001; Penalosa and Turnovsky, 2006; Turnovsky and Penalosa, 2006)). Households should be considered essentially homogeneous because theyall have the same preference utility function. Our studyconsiders that heterogeneous households have different utility functions.
Maximizing the utility subject to (10) yields
 (11)
(11)
where
There are models which explicitly address relationships between the labor-leisure choice and portfolio and consumption decisions (e.g., (Bodie, 1992; Dessing, 2002; Bodie et al., 2004; Farhi and Panageas, 2007; Heijdra and Romp, 2009; Martín, 2010; Kim et al., 2014)). Our model also determines a relationship between wealth and work time. We will discuss the relationship when simulating the model.
We now describe wealth dynamics. The change in wealth is equal to the saving minus dissaving. As the saving is  and dissaving is equal to
  the change in the household’s wealth is
 (12)
(12)
2.4. Demand and Supply
The demand for and supply of consumer goods are equal. We have
 . (13)
As the output of the capital goods sector equals the depreciation of capital stock and the net saving, we have
 (14)
(14)
where
2.5. Capital Being Fully Utilized
As is fully employed by the two sectors, we have
 (15)
(15)
2.6. The Balance in Transfers between the Groups Due To Discrimination
The total income from discrimination is the sum of the total income  from discrimination in wage incomes, the total income
  from discrimination in consumer goods market, and the total income
  from discrimination in wealth, where

The total income from discrimination is distributed between the discriminating groups
For simplicity, we assume that the per capita lump sum transfers are equal between the discriminating groups. We introduce
  if
if  is a discriminating group, and
  otherwise. We thus have

This assumption simplifies our analysis as if we consider that the lump sum transfers vary between groups, we need further distribution mechanisms for deciding distribution issues. From the definition, we have
 (16)
(16)
where
We completed the model. As far as economic structure and growth theory with endogenous capital are concerned, this is a very general model in the sense that it is based on some well-known models in economics. The Walrasian general equilibrium theory shows how to describe equilibrium of different economic forces for given capital. The Solow growth model and the Uzawa two-sector model show the ways to describe endogenous capital accumulation growth and economic structures over time. If the economic system has only two sectors, then the Walrasian general equilibrium theory (which treats capital exogenous) can be considered as a special case of our model with heterogeneous households with endogenous leisure time and wealth. It is straightforward to see that the Solow-one sector and the Uzawa two sector model are special cases of our model. As our model also includes labor supply, it is closely related with some other growth models in the literature of, for instance, labor economics. We now examine behavior of the economic system.
3. THE DYNAMICS OF THE ECONOMY AND THE DYNAMIC PROPERTIES
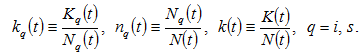
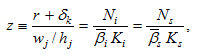
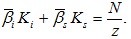
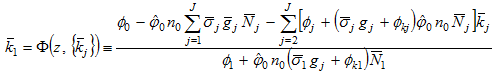
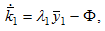
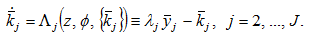
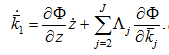
We built an economic system with any number of groups of the population. Each group may have any number of households. As the population of each group is homogenous and the propensities to save vary between groups, it is reasonable to expect that the dimension of the dynamic is equal to the number of groups. We confirm this by the following lemma. The lemma also provides a computational procedure for calculating all the variables at any point in time. Before representing our result, we use a new variable 
Lemma
The motion of the economic system is determined by  differential equations with
  and
and  where
where  as the variables
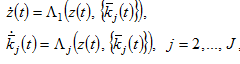 (17)
(17)
in which  are unique functions of
  and
and  defined in the appendix. At any point in time we determine the other variables as unique functions of
  and as follows:
  by (A21) →
  and
and  by (A3) →
  by (A20) →
  by (A4) →
  by (A13) →
  and
and  by (A15) →
  and
and  by (A1) →
  by (3) →
  by (5) →
  by (A8) →
 and
and  by (11) →
 →
→ 
This lemma is important as it is straightforward for us to apply the procedure to simulate the motion of the economic system. Calibration of general equilibrium is mathematically not easy as it often involves solving high-dimensional nonlinear equations. For instance, when studying behavior of the Walrasian general equilibrium the final stage of analysis is to find a price vector at which excess demand is zero (Judd, 1998). Different methods for calculating equilibria are developed in mathematical economics (e.g., (Scarf, 1967; Scarf and Hansen, 1973)). As our model is mathematically similar to the general equilibrium model at any point in time, it is possible for us to apply these traditional methods to find how the prices and other variables are related to the variables in the differential equations. We now simulate the model with 3 groupsof the population to illustrate properties of the system. We specify the values of parameters as follows
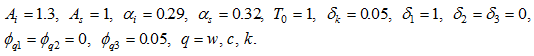
 (20)
(20)
The population of group  is largest, while the population of group
 is the next. The human capital level of group
  is highest, while the human capital level of group
  is lowest. The capital goods sector and consumer goods sector’s total productivities are respectively
  and
and  We specify the values of the parameters,
  in the Cobb-Douglas productions approximately equal to
  (e.g, (Miles and Scott, 2005; Abel et al., 2007)). Group (called discriminator) discriminates group
  (called discriminated group), while group
  (called neutral group) discriminates no group and is not discriminated. The depreciation rate of physical capital is specified at
  The discriminator’s propensity to save is
  and discriminated group’s propensity to save is
  The value of the neutral group’s propensity is between the other two groups. The discriminator’s discrimination rates against the discriminated group are mild. The discrimination rates on consumption, wage income and wealth are all fixed at
  percent. We specify the initial conditions as follows

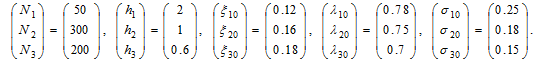
The motion of the variables is plotted in Figure 1. The output level of the capital goods sector rises over time and the output level of the consumer goods sector falls. The price of consumer goods changes slightly. The national output falls as the falling in the value of the capital goods sector’s output is larger than the rising in the value of the consumer goods sector’s output. The wage rates of the three groups vary slightly over time. The discriminator’s wage rate is higher than the neutral group’s, and the neutral group’s wage rate is higher than the discriminated group’s. The discriminator gets increasingly more money from discriminating. The discriminator works less hours and the discriminated group works more hours over time. The neutral group works more hours over time. The net impact on the total labor supply is that the labor supply falls over time. The consumer goods sector’s labor force is reduced, and the capital goods sector’slabor force is augmented slightly. The total capital and the capital input of the consumer goods sector are reduced slightly, and the capital input of the capital goods sector is increased. The rate of interest falls. The discriminator’s and discriminated group’s wealth levels are increased, the neutral group’s wealth is diminished. The discriminator’s and the discriminated group’s consumption levels are increased.The neutral group’s consumption level is diminished. It should be noted that there are empirical studies which find negative relationships between wealth and labor supply (for instance, (Holtz-Eakin et al., 1993; Cheng and French, 2000; Coronado and Perozek, 2003)). As demonstrated in our simulation, one findspositive relationship for some groups and negative for other groups. Another well-discussed issue is the relations between wealth and income distribution and growth. Kaldor (1956)argues that as income inequality is enlarged, growth should be encouraged as savings are promoted. Positive relations between income inequality and growth are identified in some studies (e.g., (Bourguignon, 1981; Forbes, 2000; Frank, 2009)), while negative relations by some other studies (e.g., (Solow, 1992; Galor and Zeira, 1993; Persson and Tabellini, 1994; Benabou, 2002; Galor and Moav, 2004)). From our simulation, we see that relations between inequality and economic growth are complicated in the sense that these relations are determined by many factors. For instance, as the economy experiences negative growth rate, the discriminator works less hours and the other two groups work more hours. As the wage rates are almost not affected, the wage incomes between the groups are either enlarged or reduced. We can also see different relations between wealth inequalities and economic growth.
Figure-1.The Motion of the Economic System
It is straightforward to confirm that the variables become stationary in the long term. We identify the following unique equilibrium


3.0.0.1 
3.0.0.2  (21)
(21)
We calculate the three eigenvalues as follows
We see that the system has a unique equilibrium with real negative eigenvalues. This result is important as we can effectively conduct comparative dynamic analysis.
4. COMPARATIVE DYNAMIC ANALYSIS
We plotted the motion of the economy with three groups and fixed discrimination rates. We now ask what will happen to the three groups if the discriminator changes its discrimination rates against the discriminated group. As the lemma in section 3 provides the computational procedure to calibrate the motion of all the variables, it is straightforward to examine effects of change in any parameter on transitory processes as well stationary states of all the variables. We introduce a variable  to represent the change rate of the variable,
  in percentage due to changes in the parameter value.
4.1. The Discrimination Rate on Wage Income Being Increased
First, we examine the case that the discriminator increases the discrimination rate on wage income in the following way:
 The simulation results are given in Figure
 As more wage income is transferred from the discriminated group to the discriminator, the lump sum transfer is increased. The wage rates, the price, and the rate of interest are slightly affected. The discriminator’s work time is reduced, while the other two groups’ work hours are slightly affected. The total labor supply, national wealth and national output are reduced. The levels of the capital goods sector’s two input factors are increased and the levels of the consumer goods sector’s two input factors are reduced. The discriminated group’s consumption and wealth levels are reduced, the discriminator’s consumption and wealth levels are increased, and the neutral group’s consumption and wealth levels are almost not changed. Although the effects on the discriminating and discriminated groups are expectable, the strengthened discrimination has almost no impact the neutral group.
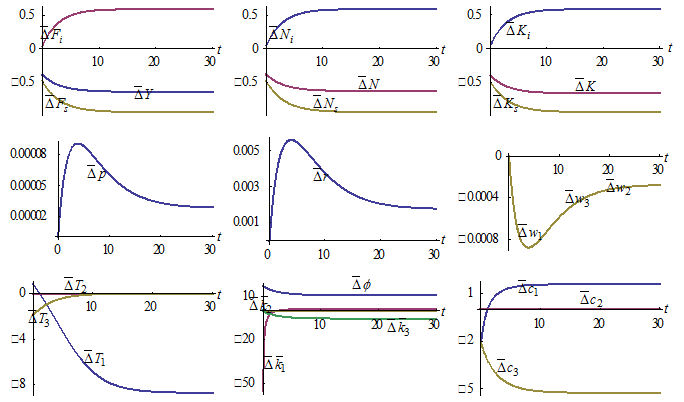
Figure-2.A Rise in the Discrimination Rate on Wage Income
4.2. The Discrimination Rate on Wealth Being Increased
We now study the case that the discriminator increases the discrimination rate on wealth as follows: The simulation results are given in Figure
  Like in the previous case, the lump sum transfer is increased. The wage rates are increased, while the price of consumer goods and the rate of interest are reduced. The discriminator’s work time is reduced, the discriminated group’s work time is increased, and the neutral group’s work time is slightly affected. The total labor supply, national wealth and national output are reduced. The levels of the capital goods sector’s two input factors are increased and the levels of the consumer goods sector’s two input factors are reduced. The output level of the capital goods sector is increased, while the output level of the consumer goods is reduced. The discriminated group’s consumption and wealth levels are reduced, the discriminator’s consumption and wealth levels are increased, and the neutral group’s consumption and wealth levels are slightly affected. Like in the previous case, the strengthened discrimination has almost no impact on the neutral group.
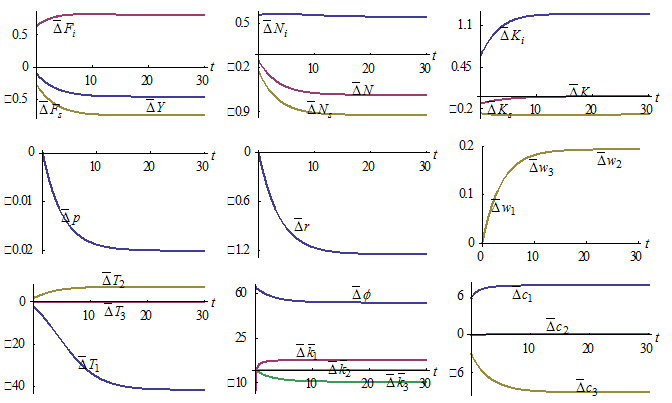
Figure-3.A Rise in the Discrimination Rate on Wealth
4.3. The Discrimination Rate on Consumption Being Increased
We now analyze what will happen to the economic system when the discriminator increases the discrimination rate on consumption in the following way.  The simulation results are given in Figure
  We see that the effects are similar to the effects of the strengthened discrimination in wealth or wage income. It should be noted that the strengthened discrimination on consumption has also almost no impact the neutral group.
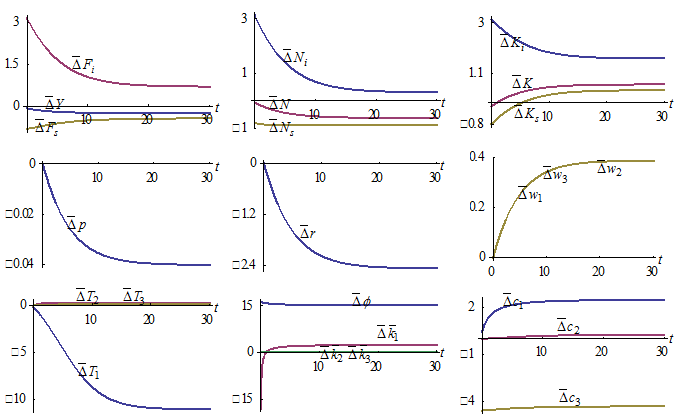
Figure-4.ARise in the Discrimination Rate on Consumption
4.4. Strengthened Discrimination Associated with Positive Reaction of the Discriminated
We analyzed the effects of changes in a single parameter on the economic system. However, it is possible that many exogenous conditions are varied at the same time. For instance, when discriminating groups change attitudes toward discriminated groups, the discriminated groups may change their behavior and preferences. For instance, it is possible that when a group is more strongly discriminated, it may make more investment in education and save more. We may also have the opposite reaction. We now examine what happens to the economic system when the discriminator strengthens its discrimination against the discriminated group and the discriminated group “positively” reacts the strengthened discrimination by reducing its propensity to use leisure time, increasing its propensity to save, and enhancing its human capital as follows

The discriminator increases its three discrimination rates. In reaction the discriminated group increases its human capital and propensity to save and reduces its propensity to enjoy leisure. The simulation results are given in Figure
 We see that the aggregated real variables are all increased. The national output, the national wealth, the total labor supply, and the output levels and the input factors of the two sectors are all increased. The lump sum transfer from the discriminated group to the discriminator is increased. The discriminated group’s wage rate is augmented and the other two groups’ wage rates are almost not affected. The price of consumer goods falls. The rate of interest is decreased. The discriminator’s work time is reduced, the discriminated group’s work time is increased, and the neutral group’s work time is slightly affected. The discriminated group’s and the discriminator’s consumption and wealth levels are increased, and the neutral group’s consumption and wealth levels are slightly affected. It should be emphasized that like in the previous cases the exogenous changes in discrimination have almost no impact on the neutral group’s wage rate, the work time, and per capita levels of consumption and wealth. It should be noted that we assume “positive” reaction against discrimination. In reality we perhaps find the opposite trends. If the discriminated people react negatively, we should expect more negative economic consequences of discrimination.
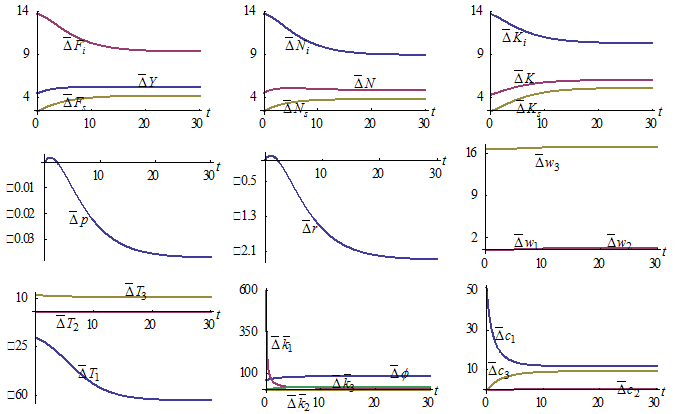
Figur-5.Strengthened Discrimination and “Positive” Reaction from the Discriminated
5. CONCLUDING REMARKS
This paper proposed a growth model of heterogeneous households with economic structure and discrimination. The Walrasian general equilibrium supplies us the framework to describe consumption decision and income and wealth distribution. The neoclassical growth theory shows the determinants of capital accumulation. It is also strongly affected by the general equilibrium models byZhang (2014). The main differences are that this study introduced discrimination, while in Zhang’s models there is no discrimination in the economic system. We were mainly concerned with the role of discrimination in economic growth, income and wealth distribution in an economy with endogenous wealth accumulation. The economy has two production sectors, one capital goods sector and another one consumer goods sector. The system has any number of groups of households. We built the model in which wealth accumulation, income and wealth distribution, time distribution and division of labor interact with each other under a fixed pattern of discrimination. We found the computational differential equations which describe the motion of the economic system. For illustration, we simulated the motion of the economic system with three groups of households, called the discriminator, the neutral group, and the discriminated group. The calibrated model has a unique stable equilibrium point. Comparative dynamic analysis was conducted to examine the impact of changes in different parameters on the transitory process and long-term equilibrium point. We discussed implications of discrimination for the relations between work time and wealth and the relations between wealth and income distribution and economic growth. For instance, we show that when the discriminator strengthens its discrimination against the discriminated group and the discriminated group “positively” reacts the strengthened discrimination by reducing its propensity to use leisure time, increasing its propensity to save, and enhancing its human capital, we have the following effects: the national output, the national wealth, the total labor supply, and the output levels and the input factors of the two sectors are all increased; the lump sum transfer from the discriminated group to the discriminator is increased; the discriminated group’s wage rate is augmented and the other two groups’ wage rates are almost not affected; the price of consumer goods and the rate of interest are lowered; the discriminator’s work time is reduced, the discriminated group’s work time is increased, and the neutral group’s work time is slightly affected; the discriminated group’s and the discriminator’s consumption and wealth levels are increased, and the neutral group’s consumption and wealth levels are slightly affected. Another interesting conclusion from the comparative dynamic analysis is that the exogenous changes in the discriminator’s discrimination against the discriminated group have almost no impact the neutral group’s wage rate, the work time, and per capita levels of consumption and wealth. This conclusion implies that as far as its economic self-interest is concerned, under certain conditions the neutral group has almost no incentive to join the discriminated group to be against the discriminator’s discrimination. It should be noted that our simulation are limited cases of actual complexity of discrimination. In reality people even from the same group may react quietly differently towards the same discrimination according to their psychological, economic, and social conditions. Another important issue is to make discrimination endogenous variables. Further studies on endogenous discrimination should provide more insights into complexity of interrelations of different races and groups over time.
Appendix:Proving the Lemma
From (4) and (6), we get
 (A1)
(A1)
in which  Insert (A1) in (2)
 (A2)
(A2)
Insert (A1) in (4)
 (A3)
(A3)
where
The rate of interest and the wage rates are presented as functions of  From (A3) and the definitions of
  we get
 (A4)
(A4)
where

Insert  in (13)
 (A5)
(A5)
Substituting (A4) in (A5) yields
 (A6)
(A6)
where
From (4) and (6), we solve
 (A7)
(A7)
Inserting (A1) in (A7), we have
 (A8)
(A8)
From (6), we have
 (A9)
(A9)
From (A9) and (A1), we have
 (A10)
(A10)
Insert (A10) in (A6)
 (A11)
(A11)
where
Using (1) and (9), we get
 (A12)
(A12)
in which we also use  Insert (A4) in (A12)
 (A13)
(A13)
where

From (15), we have
 (A14)
(A14)
From (A2) and (A14), we solve
 (A15)
(A15)
where  From (A3), we determine
  and
and as functions of Insert
  from (A15) in (A11)
 (A16)
(A16)
where
From (A16) we have
 (A17)
(A17)
where
in which 
From (16) we have
 (A18)
(A18)
Insert (11) in (A18)
 (A19)
(A19)
where  Substituting (A4) into (A19) yields
 (A20)
(A20)
where
Insert (A20) in (A17)
 (A21)
(A21)
It is straightforward to confirm that all the variables can be expressed as functions of  and
and by the following procedure:
  by (A21) →
  and
and  by (A3) →
  by (A20) →
  by (A4) →
  by (A13) →
  and
and  by (A15) →
  and
and  by (A1) →
  by (3) →
  by (5) →
  by (A8) →
 and
and  by (11) →
  →
→  by (15). From this procedure, (A21), and (12), we have
 (A22)
(A22)
 (A23)
(A23)
Taking derivatives of (A21) with respect to and combining with (A23) implies
 (A24)
(A24)
Equaling the right-hand sizes of equations (A24) and (A22), we get
 (A25)
(A25)
From (A23) and (A25) we determine the motion of and
| Funding: The author is grateful for the financial support from the Grants-in-Aid for Scientific Research (C), Project No. 25380246, Japan Society for the Promotion of Science. |
| Competing Interests: The author declares that there are no conflicts of interests regarding the publication of this paper. |
REFERENCES
Abel, A., B.S. Bernanke and D. Croushore, 2007. Macroeconomics. New Jersey: Prentice Hall.
Arrow, K.J., 1998. What has economics to say about racial discrimination? Journal of Economic Perspectives, 12(2): 91-100.
Arrow, K.J. and G. Debreu, 1954. Existence of an equilibrium for a competitive economy. Econometrica, 22(3): 265–290.
Arrow, K.J. and F.H. Hahn, 1971. General competitive analysis. San Francisco: Holden-Day, Inc.
Azariadis, C., 1993. Intertemporal macroeconomics. Oxford: Blackwell.
Barro, R.J., 1990. Government spending in a simple model of endogenous growth. Journal of Political Economy, 98(S5): S103–S125.
Barro, R.J. and X. Sala-I-Martin, 1995. Economic growth. New York: McGraw-Hill, Inc.
Becker, G., 1957. The economics of discrimination. Chicago: University of Chicago Press.
Benabou, R., 2002. Tax and education policy in a heterogeneous-agent economy: What levels of redistrbution maximize growth and efficiency? Econometrica, 70(2): 481-517.
Bergmann, B., 1971. The effects on white income of discrimination in employment. Journal of Political Economy, 792(2): 294-313.
Blanchard, O., 1997. The medium run. Brookings Papers on Economic Activity, 1997(2): 89–158.
Bodie, Z., 1992. Labor supply flexibility and Portfolio choice in a life cycle model. Journal of Economic Dynamics and Control, 16(3-4): 427 – 449.
Bodie, Z., S. Otruba and S. Walter, 2004. Optimal consumption–Portfolio choices and retirement planning. Journal of Economic Dynamics and Control, 28(6): 1115-1148.
Borjas, G., 1992. Ethnic capital and intergenerational income mobility. Quarterly Journal of Economics, 107(1): 123-150.
Bourguignon, F., 1981. Parento-superiority of unegalitarian equilibria in stiglitz’s model of wealth distribution with convex saving function. Econometrica, 49(6): 1469-1475.
Burmeister, E. and A.R. Dobell, 1970. Mathematical theories of economic growth. London: Collier Macmillan Publishers.
Carneiro, P., J.J. Heckman and D.V. Masterov, 2005. Labor market discrimination and racial differences in premarket factors. Journal of Law and Economics, 48(1): 1-39.
Caselli, F. and J. Ventura, 2000. A representative consumer theory of distribution. American Economic Review, 90(4): 909–926.
Charles, K.K. and J. Guryan, 2008. Prejudice and wages: An empirical assessment of Becker's the economics of discrimination. Journal of Political Economy, 116(5): 773-809.
Chatterjee, S., 1994. Transitional dynamics and the distribution of wealth in a neoclassical growth model. Journal of Public Economics, 54(1): 97–119.
Cheng, I.H. and E. French, 2000. The effect of the run-up in the stock market on labor supply. Federal Reserve Bank of Chicago Economic Perspectives, 24(4): 48–65.
Coronado, J.L. and M. Perozek, 2003. Wealth effects and the consumption of leisure: Retirement decisions during the stock market boom of the 1990s. Board of Governors of the Federal Reserve System, Finance and Economics Discussion Series No. 2003-20.
Coussey, M., 2002. Tackling racial equality: International comparisons. London: Home Office Research, Development and Statistics Directorate.
Dana, R.A., M. Florenzano and D. Levy, 1989. Production prices and general equilibrium prices: A long-run property of a leontief economy. Journal of Mathematical Economics, 18(3): 263–280.
Debreu, G., 1959. Theory of value. New York: Wiley.
Dessing, M., 2002. Labor supply, the family and poverty: The s-shaped labor supply curve. Journal of Economic Behavior & Organization, 49(4): 433 – 458.
Diewert, W., 1977. Walras’ theory of capital formation and the existence of a temporary equilibrium. In: Schwödiauer, G. (Ed.), Equilibrium and disequilibrium in economic theory. Dordrecht: Reidel.
Eatwell, J., 1987. Walras’ theory of capital. In: Eatwell, J., Milgate, M., and Newmann, P. (Eds.), The new Palgrave dictionary of political economy. London: MacMillan.
Farhi, E. and S. Panageas, 2007. Saving and investing for early retirement: A theoretical analysis. Journal of Financial Economics, 83(1): 87-121.
Feagin, J.R., 2000. Racist America: Roots, current realities, and future reparations. New York: Routledge.
Forbes, K., 2000. A reassessment of the relationship between inequality and growth. American Economic Review, 90(4): 869-870.
Frank, M.W., 2009. Inequality and growth in the United States: Evidence from a new state-level panel of income inequality measures. Economic Inquiry, 47(1): 55-68.
Gabriel, P.E. and S. Schmitz, 2014. A longitudinal examination of racial differences in occupational distributions among prime-aged males in the United States. Economics Bulletin, 34(1): 106-114.
Gale, D., 1955. The law of supply and demand. Mathematica Scandinavica, 3(1): 33-44.
Galor, O. and O. Moav, 2004. From physical to human capital accumulation: Inequality in the process of development. Review of Economic Studies, 71(4): 1001-1026.
Galor, O. and J. Zeira, 1993. Income distribution and macroeconomics. Review of Economic Studies, 60(1): 35-52.
Gollin, D., 2002. Getting income shares right. Journal of Political Economy, 110(2): 458 - 474.
Hájková, D. and J. Hurník, 2007. Cobb-douglas production function: The case of a converging economy. Czech Journal of Economics and Finance, 57(9-10): 465-476.
Heijdra, B.J. and W.E. Romp, 2009. Retirement, pensions, and ageing. Journal of Public Economics, 93(3-4): 586–604.
Higgs, R., 1977. Competition and coercion: Blacks in the American economy 1865-1914. New York: Columbia University Press.
Holtz-Eakin, D., D. Joulfaian and H.S. Rosen, 1993. The Carnegie conjecture: Some empirical evidence. Quarterly Journal of Economics, 108(2): 413–435.
Impicciatore, G., L. Panaccione and F. Ruscitti, 2012. Walras’s theory of capital formation: An intertemporal equilibrium reformation. Journal of Economic Theory, 106(2): 99-118.
Jensen, B.S. and M.E. Larsen, 2005. General equilibrium dynamics of multi-sector growth models. Journal of Economics, 10(Suppl.): 17-56.
Jones, C., 1995. R&D based models of economic growth. Journal of Political Economy, 103(4): 759–784.
Judd, K.L., 1998. Numerical methods in economics. Mass, Cambridge: MIT Press.
Kaldor, N., 1956. Alternative theories of distribution. Review of Economic Studies, 23(2): 83–100.
Kim, W.C., F. J., F.J. Fabozzi, P. Cheridito and C. Fox, 2014. Controlling Portfolio skewness and kurtosis without directly optimizing third and fourth moments. Economics Letters, 122(2): 154-158.
Kydland, F.E. and E.C. Prescott, 1982. Time to build and aggregate fluctuations. Econometrica, 50(6): 1345–1370.
Loury, G., 1977. A dynamic theory of racial income differences. In Wallace, P. A. and Mund, A. Le. (Eds.), Women, minorities, and employment discrimination. Lexington, MA: Lexington Books.
Lucas, R.E., 1988. On the mechanics of economic development. Journal of Monetary Economics, 22(1): 3-42.
Maliar, L. and S. Maliar, 2001. Heterogeneity in capital and skills in a neoclassical stochastic growth model. Journal of Economic Dynamics and Control, 38(9): 635–654.
Martín, A.R., 2010. Endogenous retirement and public pension system reform in Spain. Economic Modelling, 27(1): 336-349.
Mas-Colell, A., M.D. Whinston and J.R. Green, 1995. Microeconomic theory. New York: Oxford University Press.
McKenzie, L.W., 1959. On the existence of general equilibrium for a competitive market. Econometrica, 27(1): 54–71.
Miles, D. and A. Scott, 2005. Macroeconomics – understanding the wealth o nations. Chichester: John Wiley & Sons, Ltd.
Montesano, A., 2008. A restatement of Walras’ theory of capitalization and money. History of Economics Review, 47(1): 86–109.
Morishima, M., 1964. Equilibrium, stability and growth. Oxford: Oxford University Press.
Morishima, M., 1977. Walras’ economics. Cambridge: Cambridge University Press.
Nikaido, H., 1956. On the classical multilateral exchange problem. Metroeconomica, 8(3): 135–145.
Nikaido, H., 1968. Convex structures and economic theory. New York: Academic Press.
Penalosa, C.G. and S.J. Turnovsky, 2006. Growth and income inequality: A canonical model. Economic Theory, 28(2): 25-49.
Persson, T. and G.E. Tabellini, 1994. Is inequality harmful for growth? Theory and evidence. American Economic Review, 84(3): 600–621.
Phelps, E.S., 1972. The statistical theory of racism and sexism. American Economic Review, 62(4): 659-661.
Scarf, H.E., 1967. The approximation of fixed points of a continuous mapping. SIAM Journal of Applied Mathematics, 15(5): 1328-1343.
Scarf, H.E. and T. Hansen, 1973. The computation of economic equilibria. Yale: Yale University Press.
Shi, S.Y., 2006. Wage differentials, discrimination and efficiency. European Economic Review, 50: 849-875.
Shoven, J.B. and J. Whalley, 1992. Applying general equilibrium. Cambridge: Cambridge University Press.
Solow, R., 1956. A contribution to the theory of economic growth. Quarterly Journal of Economics, 70(1): 65-94.
Solow, R.M., 1992. Growth with equity through investment in human capital. The George Seltzer Distinguished Lecture Industrial Relations Center. University of Minnesota.
Turnovsky, S.J. and C.G. Penalosa, 2006. Distributional dynamics in a neoclassical growth model: The role of elastic labor supply. Journal of Economic Dynamics & Control, 32(5): 1399-1431.
Uzawa, H., 1961. On a two-sector model of economic growth. Review of Economic Studies, 29(1): 47-70.
Walras, L., 1874. Elements of pure economics, translated from the French by W. Jaffé, 1954. London: Allen and Unwin.
Welch, F., 1967. Labor market discrimination: An interpretation of income differences in the rural South. Journal of Political Economy, 75: 225-240.
Welch, F., 1975. Human capital theory: Education, discrimination, and life cycles. American Economic Review, 65(2): 63-73.
Whatley, W. and G. Wright, 1994. Race, human capital, and labour markets in American history. In George Grantham, G. and MacKinnon, M. (Eds), Labour market evolution. London and New York: Routledge.
Zhang, W.B., 1993. Woman’s labor participation and economic growth - creativity, knowledge utilization and family preference. Economics Letters, 42(1): 105-110.
Zhang, W.B., 2003. The American civilization portrayed by ancient confucianism. New York: Algora Publisher.
Zhang, W.B., 2005. Economic growth theory. Hampshire: Ashgate.
Zhang, W.B., 2012. International trade and global growth with capital accumulation, heterogeneous households and elastic labor supply. International Journal of Society Systems Science, 4(2): 1129-1149.
Zhang, W.B., 2014. A study of the role of government in income and wealth distribution by integrating the Walrasian general equilibrium and neoclassical growth theories. Interdisciplinary Description of Complex Systems, 12(1): 28-45.
| Views and opinions expressed in this article are the views and opinions of the author(s), Asian Journal of Economic Modellingshall not be responsible or answerable for any loss, damage or liability etc. caused in relation to/arising out of the use of the content. |