


THE INTERACTIVE AND CAUSAL RELATIONSHIP BETWEEN PRODUCTIVITY AND PROFITABILITY OF VIETNAM’S FORMAL MICROFINANCE INSTITUTIONS

Doctor of Philosophy, Postgraduate Training Institute, Hong Bang International University, Ho Chi Minh City, Vietnam.
ABSTRACT
Productivity and profitability are the most complex areas of financial decision making due to their interrelationship with other financial decision variables. At the same time, productivity and profitability are factors affecting the operations and goals of formal microfinance institutions (MFIs) in Vietnam. This study’s purpose was to discover the interaction and causal relationship between productivity and profitability and to examine factors that affect the productivity and profitability of formal MFIs. After regression analysis on a set of panel data from 2010 to 2018 of all formal MFIs in Vietnam, it appeared that profitability and debt-to-equity ratio have positive relationships with productivity and that the number of branches and deposits have negative relationships with productivity. Productivity has a positive relationship with profitability and both the debt-to-equity ratio and equity have negative impacts on profitability. The study found bidirectional interactions and a causal relationship between productivity and profitability. Based on the findings the study proposes policy measures that could be implemented by the managers of formal MFIs to increase productivity and ensure a more efficient distribution of economic resources. This study also helps managers of formal MFIs understand the key determinants for better management of formal MFIs.
Keywords: Formal microfinance, Institutions, Microfinance, Microfinance institution, Productivity, Profitability.
JEL Classification: D02; D24; G19; G21; G29.
ARTICLE HISTORY: Received:29 July 2019Revised:2 September 2019Accepted:4 October 2019 Published: 19 November 2019.
Contribution/ Originality:This study is one of very few studies which have investigated panel data on the interactive and causal relationship between productivity and profitability of Vietnam’s Formal Microfinance Institutions and the results could serve as a valuable reference for other developing countries.
1. INTRODUCTION
Increasing the ability to provide financial services is one of the important goals targeted by many MFIs.
In Vietnam, the State Bank of Vietnam has started to establish formal MFIsand MFIs now exist in 28 provinces and cities with 113 branches and transaction offices. Formal MFIs in Vietnam have made an important contribution to expanding the scale of the financial service provision, especially in providing financial services to the poor and those earning low incomes and contributing to ensuring social security. Formal MFIs expand the scale of the service provision and need to ensure a balance of social, income and operational sustainability goals. However, the productivity and profitability of many formal MFIs in Vietnam has fluctuated over the years, affecting the ability to expand financial service provision. There has been some research on formal MFIs’ operations in Vietnam but, there has been no research on the interactive relationship between productivity and profitability.
This study’s purpose was to discover the interaction and causal relationship between productivity and profitability and to examine the factors that affect formal MFIs’ productivity and profitability. By studying this aspect of Vietnam, the research results will contribute to the theoretical and experimental research on the interaction and causal relationship between formal MFIs’ productivity and profitability. The study contributes to the knowledge gap in the literature on formal MFIs’ productivity and profitability. At the same time, the study is expected to change the decision-makers’ perception of formal MFIs, so they can develop an effective suitable MFI management strategy. Therefore, the study of formal MFIs’ productivity and profitability is urgently required to increase their productivity and profitability. In particular, this study is helpful to decision-makers and other stakeholders of formal MFIs in Vietnam.
2. LITERATURE REVIEW
Microfinance institution refers to a type of credit institution with banking operations to meet the needs of low-income individuals, households and small enterprises.
In Vietnam, MFIs may be established as limited liability companies with the operations of:
(i) Taking deposits in Vietnamese dong as compulsory savings under their regulations, and deposits of organizations and individuals including voluntary deposits of microfinance clients except those for payment purposes.
(ii) Borrowing loans from domestic and overseas individuals, credit institutions, MFIs, and other organizations.
(iii) Extending credit in Vietnamese dong only by lending As the credit extension of MFIs may only be guaranteed with compulsory deposits or guarantee of a group of savings depositors or loan borrowers.
(iv) Other operations of MFIs such as entrusted lending and receiving entrustment of lending, providing financial consultancy services in the microfinance sector, providing collection and payment and money transfer services for microfinance clients and, acting as insurance service agents (National Assembly, 2010![]() ).
).
The formal MFIs play an important role in the economy and social development, contributing to the strengthening and expanding of the formal financial systems. In particular, the formal MFIs offer financial services to the poor who have no access to the traditional financial sector. At the same time, formal MFIs attract capital from savings mobilization to serve the needs of investment, production, and exchange of goods, thereby contributing to poverty reduction and income improvement for customers. To play this important role, formal MFIs must increase their productivity and profitability.
2.1. Productivity
Productivity is an essential performance indicator that shows how well an organization is streamlining its operations by reflecting the amount of output per each unit of input. According to Rashid and Twaha (2013![]() ) in microfinance the numbers of borrowers per staff number is used as a measure of productivity. In microfinance, this is measured in terms of the work load of loan officers (Basharat et al., 2014
) in microfinance the numbers of borrowers per staff number is used as a measure of productivity. In microfinance, this is measured in terms of the work load of loan officers (Basharat et al., 2014![]() ) . At the same time, traditionally, the microfinance community has used the ratio of clients per credit officer to measure productivity (MicroRate, 2014
) . At the same time, traditionally, the microfinance community has used the ratio of clients per credit officer to measure productivity (MicroRate, 2014![]() ) . It is a staff productivity ratio.
) . It is a staff productivity ratio.
This ratio is computed by expressing the total number of borrowers in terms of the total number of staff members in a given MFI. It provides a clue of the number of staff required to produce a given level of output measured by borrowers. A higher ratio is more desirable as it implies that fewer staff members are actually needed to produce a given number of borrowers. This ratio captures the productivity of the loan officers and the higher the ratio the more productive the institution. It is the appropriate measure of productivity given the fact that MFIs often have a large number of borrowers accessing very many small loans. The productivity associated with all MFIs operations is influenced by many factors, including the following:
Firstly, number of branches: The way to close the absurd gap between demand and supply in microfinance is for MFIs to mobilize savings, to raise lending, and to service clients through extensive branch networks. The scale of the microfinance services can be increased by leveraging the branch networks to provide microcredit to a large number of customers (World Bank, 2004![]() ) . However, the study of Rashid and Twaha (2013
) . However, the study of Rashid and Twaha (2013![]() ) investigated the determinants of productivity of MFIs and found that the number of branches negatively affected the productivity of MFIs. According to Rajaonera and Rakotomanana (2017
) investigated the determinants of productivity of MFIs and found that the number of branches negatively affected the productivity of MFIs. According to Rajaonera and Rakotomanana (2017![]() ) productivity factors differ by branch of activity due to price structure, cost structure, nature of products, and concurrence level.
) productivity factors differ by branch of activity due to price structure, cost structure, nature of products, and concurrence level.
H1.1: There is a positive or negative relationship between the number of branches and the productivity of formal MFIs.
Secondly, debt-to-equity ratio: The social goal of MFIs is mainly financed by other institutions. According to Abdulai and Tewari (2017![]() ) the debt-to-equity ratio is a good indicator in assessing the extent of utilization of commercial funds by MFIs and is used as the capital structure variable. The availability and use of debts by MFIs helps to expand their capital base and outreach. Thus, the debt-to-equity ratio also propels MFIs towards achieving many borrowers.
) the debt-to-equity ratio is a good indicator in assessing the extent of utilization of commercial funds by MFIs and is used as the capital structure variable. The availability and use of debts by MFIs helps to expand their capital base and outreach. Thus, the debt-to-equity ratio also propels MFIs towards achieving many borrowers.
H1.2: There is a positive relationship between the debt-to-equity ratio and the productivity of formal MFIs.
Thirdly, deposit-to-loan ratio: This ratio shows the ability of the mobilization deposits to meet the lending needs of MFIs. Many customers can be served more by lending from the mobilization deposits. The deposits mobilization has become a strong driving force for improving the operations of MFIs (Fiebig et al., 1999![]() ) . On the other hand, the study of Pal and Mitra (2017
) . On the other hand, the study of Pal and Mitra (2017![]() ) showed that a change in the deposit-to-loan ratio would impact the asset quality of an microfinance institution only to a limited extent. Thefore, the deposit-to-loan ratio has a positive impact on the productivity of MFIs.
) showed that a change in the deposit-to-loan ratio would impact the asset quality of an microfinance institution only to a limited extent. Thefore, the deposit-to-loan ratio has a positive impact on the productivity of MFIs.
H1.3: There is a positive relationship between the deposit-to-loan ratio and the productivity of formal MFIs.
Fourth, deposit: The deposit account serves as a proxy that captures the level of savings amongst microfinance clients and increases in the number of savings accounts would help MFIs expand outreach, especially outreach breadth and microfinance clients (Churchill and Marr, 2017![]() ) . Thefore, the deposit has a positive impact on the productivity of MFIs.
) . Thefore, the deposit has a positive impact on the productivity of MFIs.
H1.4: There is a positive relationship between the deposit and the productivity of formal MFIs.
Fifthly,profitability: The study of Kipesha and Zhang (2013![]() ) concluded that there were trade-offs between financial performance and outreach to the poor and found negative impacts of a focus on profitability on the outreach to the poor. This implies that focusing on profitability results in declining outreach to the poor hence the existence of tradeoffs. The tradeoffs between outreach and profitability were also observed under borrowers per staff. The study of Adhikary and Papachristou (2014
) concluded that there were trade-offs between financial performance and outreach to the poor and found negative impacts of a focus on profitability on the outreach to the poor. This implies that focusing on profitability results in declining outreach to the poor hence the existence of tradeoffs. The tradeoffs between outreach and profitability were also observed under borrowers per staff. The study of Adhikary and Papachristou (2014![]() ) examined the relationship between the financial performance and the outreach of MFIs and this study found that profitability was positively associated with the breadth of outreach. Therefore, the return on assets has a positive impact on the productivity of MFIs. In other words, profitability has a positive impact on the productivity of MFIs. On the other hand, the study of Abrar and Javaid (2016
) examined the relationship between the financial performance and the outreach of MFIs and this study found that profitability was positively associated with the breadth of outreach. Therefore, the return on assets has a positive impact on the productivity of MFIs. In other words, profitability has a positive impact on the productivity of MFIs. On the other hand, the study of Abrar and Javaid (2016![]() ) showed that if a MFI was not profitable, the quality of the loan-portfolio depreciates, which further signals a lack of efficiency and low productivity at MFIs.
) showed that if a MFI was not profitable, the quality of the loan-portfolio depreciates, which further signals a lack of efficiency and low productivity at MFIs.
H1.5: There is a positive or negative relationship between the profitability and the productivity of formal MFIs.
2.2. Profitability
The definition of profitability usually depends on the objective of the analysis. The profitability theory focuses on how well a MFI uses its assets to generate returns. The return on assets indicates how well a MFI is managing its assets to optimize its profitability. The ratio includes not only the return on the portfolio, but also all other revenue generated from investments and other operating activities and this ratio can be used to forecast earnings in future periods. The return on assets measures profitability regardless of the institution’s underlying funding structure; it does not discriminate against MFIs that are funded primarily through equity. Therefore, the return on assets is a good measurement for profitability of MFIs (Bruett et al., 2005![]() ). The profitability is associated with all MFIs operations and is influenced by many factors, including:
). The profitability is associated with all MFIs operations and is influenced by many factors, including:
Firstly, productivity: The result of Berguiga et al. (2017![]() ) found that staff productivity was one of the determinants of return on assets and that the effect of staff productivity on return on assets was very significant for MFIs. According to Wassie et al. (2019
) found that staff productivity was one of the determinants of return on assets and that the effect of staff productivity on return on assets was very significant for MFIs. According to Wassie et al. (2019![]() ) the number of loan officers, loan officer productivity, and personnel productivity have a positive and significant impact on the financial performance of MFIs. In other words, productivity has a positive impact on the profitability of MFIs.
) the number of loan officers, loan officer productivity, and personnel productivity have a positive and significant impact on the financial performance of MFIs. In other words, productivity has a positive impact on the profitability of MFIs.
H2.1: There is a positive relationship between formal MFIs’ productivity and profitability.
Secondly, the debt-to-equity ratio: The debt-to-equity ratio is a measure of capital adequacy as this ratio measures the overall leverage of MFIs. The debt-to-equity ratio is of particular interest because it indicates the MFI’s level of operational safety . If the debt-to-equity ratio increases rapidly, it will affect the level of safety in a MFI’s operations and the rapid increase in debt financing will put pressure on profitability (MicroRate, 2014![]() ) . On the other hand, the debt-to-equity ratio is a good indicator in assessing the extent of commercial funds use by MFIs and is used as the capital structure variable. The availability and use of debts by MFIs helps to expand their capital base, outreach and debts also propel MFIs towards achieving efficiency (Abdulai and Tewari, 2017
) . On the other hand, the debt-to-equity ratio is a good indicator in assessing the extent of commercial funds use by MFIs and is used as the capital structure variable. The availability and use of debts by MFIs helps to expand their capital base, outreach and debts also propel MFIs towards achieving efficiency (Abdulai and Tewari, 2017![]() ) . Therefore, the debt-to-equity ratio impacts the profitability of MFIs.
) . Therefore, the debt-to-equity ratio impacts the profitability of MFIs.
H2.2: There is a positive or negative relationship between the debt-to-equity ratio and the profitability of formal MFIs.
Thirdly, equity: According to Forghani et al. (2013![]() ) financing relates to three kinds of decisions: decisions about capital structure, decisions about capital budgeting and decisions about capital management and the results obtained from their study showed a relationship between capital management and performance. Capital management is one of the most important decisions in financial management. The ability of a institution to act in the long term depends on how financial managers can optimally manage the institution’s capital and the study of Pai and Banda (2014
) financing relates to three kinds of decisions: decisions about capital structure, decisions about capital budgeting and decisions about capital management and the results obtained from their study showed a relationship between capital management and performance. Capital management is one of the most important decisions in financial management. The ability of a institution to act in the long term depends on how financial managers can optimally manage the institution’s capital and the study of Pai and Banda (2014![]() ) found out that the working capital management was the most important decision because it affected the profitability and liquidity of institutions. Therefore, there is a positive relationship between the equity and profitability of financial institutions. On the other hand, the study of Abrar and Javaid (2016
) found out that the working capital management was the most important decision because it affected the profitability and liquidity of institutions. Therefore, there is a positive relationship between the equity and profitability of financial institutions. On the other hand, the study of Abrar and Javaid (2016![]() ) found that a combination of equity and debt was optimal for an ensured profitability of the microfinancing firms and the results noted that highly leveraged MFIs enjoyed a higher profitability relative to the less leveraged MFIs.
) found that a combination of equity and debt was optimal for an ensured profitability of the microfinancing firms and the results noted that highly leveraged MFIs enjoyed a higher profitability relative to the less leveraged MFIs.
H2.3: There is a positive or negative relationship between the equity and profitability of formal MFIs.
Fourth, financial self-sustainability: According to Abrar and Javaid (2016![]() ) when it comes to MFIs, sustainability is perhaps the key derivate of profitability itself. Therefore, financial self-sustainability helps to increase the profitability of MFIs.
) when it comes to MFIs, sustainability is perhaps the key derivate of profitability itself. Therefore, financial self-sustainability helps to increase the profitability of MFIs.
H2.4: There is a positive relationship between financial self-sustainability and the profitability of formal MFIs.
Fifthly, loan-to-deposit ratio: This ratio is used to assess the liquidity of MFIs, and there is a correlation between the loan-to-deposit ratio and net income (Monyi, 2017![]() ) . However, liquid assets usually have lower rates of return and higher liquidity (lower loan-to-deposit ratio) would signal lower profitability and vice versa (Adusei, 2015
) . However, liquid assets usually have lower rates of return and higher liquidity (lower loan-to-deposit ratio) would signal lower profitability and vice versa (Adusei, 2015![]() ) . Therefore, a higher loan-to-deposit ratio would signal higher profitability for MFIs.
) . Therefore, a higher loan-to-deposit ratio would signal higher profitability for MFIs.
H2.5: There is a positive relationship between the loan-to-deposit ratio and the profitability of formal MFIs.
3. METHODOLOGY
The study used both primary and secondary data. Secondary sources of data were gathered from international journals, books, etc. Primary data were collected from the MIX Market website, and the annual reports and financial reports of all the formal MFIs that were licensed by the State Bank of Vietnam from 2010 to 2018. The analysis model of the relationship between the productivity and profitability of all the formal MFIs in Vietnam was established as follows:
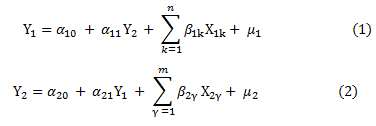
Where,
Y1 is a variable that measures productivity, determined by numbers of borrowers per staff number. Y2 is a variable that measures profitability, determined by return on assets. X1k, X2γ are the independent variables that can affect profitability and sustainability in Equation 1 and Equation 2, respectively.
The coefficient αand coefficient β are the correlation coefficients of the independent variables with the dependent variables, which are the error terms of the model. For simplicity, indicator i represents the number of observations and indicator t represents the number observed year.
This study used Stata 15.0 software with the variables described briefly and the definitions of the variables and their expected signs are presented in Table 1.
Table-1 . Summary of the research model variables.
| Variables and symbols | Definition | Expected sign and hypotheses |
| Factors affecting productivity | ||
| Dependent variable | ||
| Productivity: Numbers of borrowers on number of staff ratio (BSR) | Numbers of borrowers / Number of staff | |
| Independent variables | ||
| Number of branches (BRA) | Number of branches | H1.1: +/- (high BRA, high or low BSR) |
| Debt-to-equity ratio (DER) | Total liabilities / Total equity | H1.2: + (high DER, high BSR) |
| Deposit-to-loan-ratio (DLR) | Total deposit / Gross loan | H1.3: + (high DLR, high BSR) |
| Deposit (DEP) | Total deposit | H1.4: + (high DEP, high BSR) |
| Profitability: Return on assets (ROA) | (Net operating income -Taxes) / Average assets | H1.5: + (high ROA, high BSR) |
| Factors affecting profitability | ||
| Dependent variable | ||
| Profitability: Return on assets (ROA) | (Net operating income -Taxes) / Average Assets | |
| Independent variable | ||
| Productivity: Numbers of borrowers on number of staff ratio (BSR) | Numbers of borrowers / Number of staff | H2.1: + (high BRS, high ROA) |
| Debt-to-equity ratio (DER) | Total liabilities / Total equity | H2.2: +/- (high DER, high/low ROA) |
| Equity (EQU) | Total equity | H2.3: +/- (high EQU, high/low ROA) |
| Financial self - sustainability (FSS) | Operating income / (Operating expenses + financing costs + provision for loan losses + Cost of capital) | H2.4: + (high FSS, high ROA) |
| Loan-to-deposit ratio (LDR) | Gross loan / Total deposit | H2.5: + (High LDR, high ROA) |
The model and estimation method details in term of equations and theory were as follows:
The equations of factors affecting productivity:
BSR = α10 + β11 BRA + β12 DER+ β13 DLR + β14 DEP + β15 ROA + μ1
The equations of factors affecting profitability:
ROA = α20 + β21BSR + β22 DER+ β23 EQU + β24 FSS + β25 LDR + μ2
The study used the descriptive statistical method to evaluate the fluctuations of variables in the research model, performed the correlation analysis to assess the degree of multicollinearity and performed the regression according to the fixed effects model (FEM), random effects model (REM) and compared them with the pooled ordinary least square model (OLS) to determine the influencing factors for each model. Through the results of the regression steps, this study found the factors affecting productivity, profitability and the relationships between formal MFIs’ productivity and profitability.
4. RESEARCH RESULTS
4.1. Descriptive Statistics
Descriptive statistics of both dependent and independent variables are presented in Table 2. The results found that the BRA, BSR, DLR, FSS, LDR, ROA variables had smaller standard deviations than the average. The DER, DEP, EQU variables have fluctuations, due to the large difference in the debt-to-asset equity ratio, deposit and equity between the formal MFIs of Vietnam from 2010 to 2018.
Table-2 . Descriptive statistics for factors affecting profitability
Variable |
Mean |
Std. dev. |
Min |
Max |
BRA |
25.69444 |
21.52582 |
4 |
71 |
BSR |
260.5581 |
169.268 |
6.36 |
566.55 |
DER |
5.133889 |
5.823978 |
1.16 |
24.26 |
DEP |
386.81 |
471.1465 |
4 |
2007 |
DLR |
58.08056 |
23.12572 |
23.76 |
111.72 |
EQU |
219.5703 |
297.1398 |
6.71 |
1173 |
FSS |
103.4697 |
14.88413 |
71.74 |
129 |
LDR |
2.108611 |
.9157172 |
.89 |
5.25 |
ROA |
4.137222 |
1.950659 |
.42 |
7.8 |
4.2. Correlation Analysis
The analysis results of the correlation between variables in the model indicated a very low degree of correlation among the variables so the presence of any multicollinearity was neglected Table 3.
Correlation matrix for factors affecting productivity |
||||||
Factors |
BSR |
BRA |
DER |
DEP |
DLR |
ROA |
BSR |
1.0000 |
|||||
BRA |
0.3117 |
1.0000 |
||||
DER |
-0.3049 |
-0.3627 |
1.0000 |
|||
DEP |
0.6810 |
0.5180 |
-0.2188 |
1.0000 |
||
DLR |
-0.4884 |
-0.2833 |
0.2664 |
-0.0757 |
1.0000 |
|
ROA |
0.6645 |
0.3759 |
-0.5047 |
0.3464 |
-0.4584 |
1.0000 |
Correlation matrix for factors affecting profitability |
||||||
Factors |
ROA |
BSR |
DER |
EQU |
FSS |
LDR |
ROA |
1.0000 |
|||||
BSR |
0.6645 |
1.0000 |
||||
DER |
-0.5047 |
-0.3049 |
1.0000 |
|||
EQU |
0.4796 |
0.8434 |
-0.3320 |
1.0000 |
||
FSS |
0.4037 |
0.6571 |
-0.0476 |
0.7579 |
1.0000 |
|
LDR |
0.1216 |
0.0996 |
-0.3449 |
0.0449 |
-0.0868 |
1.0000 |
4.3. Regression Results
Regression was carried out using FEM and REM and compared with OLS between the BSR dependent variable and BRA, DER, DEP, DLR, ROA independent variables.
According to the results of REM and FEM, both P-values were less than the significance level of 5% (P-value = 0.000), so the regression models were statistically significant at the significance level of 5 %. In REM, the variables DEP and ROA had positive impacts on the variable BSR at the significance level of 1% and 1%, the variables BRA and DLR had negative impacts on the variable BSR at the significance level of 10% and 1%, and the variable DER had a positive impacts on the variable BSR, but was not statistically significant. In FEM, the variables DEP and ROA had positive impacts on the variable BSR at the significance level of 1% and 5%, the variable BRA had a negative impact on the variable BSR at the significance level of 10%,the variable DLR had a negative impact on the variable BSR, and the variable DER had a positive impact on the variable BSR, but both these last two variables were not statistically significant as can be seen in Table 4.
The Hausman test was performed to select the appropriate model and the Hausman test result obtained a P-value of 0.6806, greater than the significance level of 5 %, so the REM was more suitable than FEM. In comparison with the OLS Pooled model, REM was more suitable than the OLS Pooled model. Therefore, the study used the REM regression results in order to analyze and test the next steps. The multicollinearity test of the model had a result of Mean VIF = 2.65, VIF of variables from 1.42 to 4.71. This result showed no serious multicollinearity in this model.
In the test for variance change of the model, the P-value = 1.0000 and was greater than 0.05, therefore, this model did not have the variance change phenomenon. When checking the autocorrelation of the model, P-value = 0.1684 was greater than 0.05 so this model did not have serial correlation.
Table-4. Regression results for factors affecting productivity.
Independent variables |
Dependent variable (BSR) |
|
REM |
FEM |
|
BRA |
-2.078* (-2.50) |
-2.175* (-2.47) |
DER |
1.008 (0.35) |
4.055 (0.96) |
DEP |
0.238*** (6.50) |
0.300*** (4.49) |
DLR |
-2.496*** (-3.51) |
-1.240 (-1.11) |
ROA |
34.32*** (3.57) |
40.22** (3.40) |
_cons |
219.6** (2.91) |
85.19 (0.73) |
P-value |
0.0000 |
0.0000 |
t statistics in parentheses * p<0.05, ** p<0.01, *** p<0.001
Regression was carried out using FEM, REM) and compared with OLS between the ROA dependent variable and the BSR, DER, EQU, FSS, LDR independent variables. According to the results of REM and FEM, both P-values were less than the significance level of 5% (P-value = 0.000), so the regression models were statistically significant at the significance level of 5 %. In REM, the variable BSR had a positive impacts on the variable ROA at the significance level of 1%, the variables DER, and EQU had negative impacts on the variable ROA at the significance level of 1% and 10%, the variable FSS had a positive impact on the variable ROA, the variable LDR had a negative impacts on the variable ROA, but both these last two variables were not statistically significant. In FEM, the variable FSS had a positive impact on the variable ROA at the significance level of 10%, the variables BSR and EQU had positive impacts on the variable ROA, the variables DER and LDR had negative impacts on the variable ROA, but these last four variables were not statistically significant as can be seen in Table 5. The study performed the Hausman test to select the appropriate model and the Hausman test result had a P-value of 0.2545, which wasgreater than the significance level of 5 %, so the REM was more suitable than FEM. In comparison with the OLS Pooled model, REM was more suitable than the OLS Pooled model. Therefore, the study used the REM regression results in order to analyze and test the next steps. The multicollinearity test of the model was Mean VIF = 3.33, VIF of variables from 1.18 to 5.45. This result showed no serious multicollinearity in this model.
In the test for variance change of the model, P-value = 1.0000 was greater than 0.05, therefore, this model did not have the variance change phenomenon. When checking the autocorrelation of the model, the P-value = 0.7911 was greater than 0.05 so this model did not have serial correlation.
Table-5 . Regression results for factors affecting operational sustainability.
Independent variables |
Dependent variable (ROA) |
|
REM |
FEM |
|
BSR |
0.00993*** (4.03) |
0.00438 (1.36) |
DER |
-0.150*** (-3.33) |
-0.0579 (-1.07) |
EQU |
-0.00384* (-2.27) |
0.000106 (0.05) |
FSS |
0.0332 (1.36) |
0.0577* (2.29) |
LDR |
-0.150 (-0.58) |
-0.923 (-2.02) |
_cons |
0.0495 (0.02) |
-0.751 (-0.32) |
P-value |
0.0000 |
0.0000 |
t statistics in parentheses * p<0.05, ** p<0.01, *** p<0.001
5. DISCUSSIONS
5.1. Discussions of Factors Affecting Productivity
The results of REM in Table 4 show that the variable BRA had a negative impact on BSR with coefficient -2.078 with the significance level of 10%, indicating that BRA has an impact on productity. This result agreed with the analysis results of Rashid and Twaha (2013![]() ) and disagreed with the analysis results of WB (2004
) and disagreed with the analysis results of WB (2004![]() ) . Some formal MFIs reorganized operations and reduced branch numbers, but still maintained and increased the number of borrowers over the years.
) . Some formal MFIs reorganized operations and reduced branch numbers, but still maintained and increased the number of borrowers over the years.
The variable DEP had a positive impact on BSR with coefficient 0.238 with the significance level of 1%, indicating that DEP has a very strong impact on productity. This result agreed with the expected sign and hypothesesandagreed with the analysis results of Churchill and Marr (2017![]() ) . Many formal MFIs increase their mobilization operation, leading to increases in the deposit, attracting more clients to deposit and many borrowers. Thereby, the deposit has contributed to increasing the number of borrowers per staff from 2010 to 2018.
) . Many formal MFIs increase their mobilization operation, leading to increases in the deposit, attracting more clients to deposit and many borrowers. Thereby, the deposit has contributed to increasing the number of borrowers per staff from 2010 to 2018.
The variable DLR had a negative impact on BSR with coefficient -2.496 with the significance level of 1%, indicating that DLR has a very strong impact on productity. This result contrasted with the expected sign and hypotheses and disagreed with the analysis results of Fiebig et al. (1999![]() ) . Many formal MFIs increased their loan size to larger than their deposit mobilization scale, attracting more borrowers, resulting in an increase in the number of borrowers per employee and an increase in their productivity.
) . Many formal MFIs increased their loan size to larger than their deposit mobilization scale, attracting more borrowers, resulting in an increase in the number of borrowers per employee and an increase in their productivity.
The variable ROA had a positive impact on BSR with coefficient 34.32 with the significance level of 1%, indicating that the ROA has a very strong impact on productity. This result agreed with the expected sign and hypothesesand with the analysis results of Adhikary and Papachristou (2014![]() ) and disagreed with the analysis results of Kipesha and Zhang (2013
) and disagreed with the analysis results of Kipesha and Zhang (2013![]() ) . In addition to operational sustainability goals, profitability contributes to increasing MFIs’ productivity. Formal MFIs’ profitability has a positive impact on productivity and this study result showed that there was no negative relationship between the profitability and productivity of formal MFIs.
) . In addition to operational sustainability goals, profitability contributes to increasing MFIs’ productivity. Formal MFIs’ profitability has a positive impact on productivity and this study result showed that there was no negative relationship between the profitability and productivity of formal MFIs.
5.2. Discussions of Factors Affecting Profitability
The results of REM in Table 5 showed that the variable BSR had a posttive impact on ROA with the coefficient 0.00993 with the significance level of 1%, indicating that BSR has a very strong impact on profitability. This result agreed with the expected sign and hypotheses andwith the analysis results of Berguiga et al. (2017![]() ) ; Wassie et al. (2019
) ; Wassie et al. (2019![]() ) . Increasing the number of borrowers leads to increasing the productivity of formal MFIs.
) . Increasing the number of borrowers leads to increasing the productivity of formal MFIs.
The variable DER had a negative impact on ROA with coefficient -0.150 with the significance level of 1%, indicating that DER has a very strong impact on profitability. This result agreed with the analysis results of MicroRate (2014![]() ) and disagreed with the analysis results of Abdulai and Tewari (2017
) and disagreed with the analysis results of Abdulai and Tewari (2017![]() ) . Many formal MFIs use funding sources for lending and and the rapid increase in debt financing will put pressure on profitability over the years.
) . Many formal MFIs use funding sources for lending and and the rapid increase in debt financing will put pressure on profitability over the years.
The variable EQU had a negative impact on ROA with coefficient -0.00384 with the significance level of 10%, indicating that EQU has an impact on profitability. This result agreed with the analysis results of Abrar and Javaid (2016![]() ) and disagreed with the analysis results of Pai and Banda (2014
) and disagreed with the analysis results of Pai and Banda (2014![]() ) . Most MFIs have low equity and formal MFIs are institutions that provide loans mainly from mobilized capital, so in the past few years, formal MFIs have always increased capital mobilization to meet the needs of expanding their operations. Therefore, there was a negative relationship between the equity and profitability of formal MFIs.
) . Most MFIs have low equity and formal MFIs are institutions that provide loans mainly from mobilized capital, so in the past few years, formal MFIs have always increased capital mobilization to meet the needs of expanding their operations. Therefore, there was a negative relationship between the equity and profitability of formal MFIs.
6. CONCLUSIONS AND RECOMMENDATIONS
This paper studied the causal relationships between formal MFIs’ productivity and profitability in Vietnam. Multiple regression analysis was used in this study to find out the potential factors that affect formal MFIs’ productivity and profitability. Based on prior research, two prominent models were identified and these research results were accurate according to the characteristics of formal MFIs and the development history of formal MFIs in Vietnam from 2010 to 2018.
The results of the study showed that the two factors that had positive relationships with productivity were profitability and the deposit. The two factors that had negative relationships with productivity were the number of branches and the deposit-to-loan ratio. The debt-to-equity ratio had an insignificant relationship with productivity of formal MFIs. The factors that had the highest impact on productivity were the profitability, deposit and deposit-to-loan ratio.
This study also showed that the one factor that had a positive relationship with profitabilitywas productivity. The two factors that had negative relationships with profitability were the debt-to-equity ratio and equity. Financial self-sustainability and the loan-to-deposit ratio had insignificant relationships with profitability. On the other hand, the factors that had the highest impact on profitability were productivity and the debt-to-equity ratio.
The study found relationships between formal MFIs’ productivity and profitability. The study found positive bidirectional interactions and causal relationships between productivity and profitability.
Nowadays, MFIs are becoming a significant investment prospect in many regions of the country. This study will help researchers and managers develop their expertise on key factors of productivity and profitability and the relationship between the two. Based on the research results, the article recommends the following to increase productivity and profitability:
Firstly, this study found positive bidirectional causal interactions between productivity and profitability, so that the immediate policy recommendation is for MFIs to focus more on productivity and profitability.
Secondly, formal MFIs are credit institutions that are allowed to mobilize the deposits to lend to borrowers. Therefore, to ensure productivity and profitability, formal MFIs should focus on deposit mobilization, creating the capital source to meet the needs of many borrowers.
Thirdly, formal MFIs should focus more on restructuring branch operations that contribute to productivity and supplement their equity, and gradually reduce the debt-to-equity ratio, thereby contributing to increased profitability.
Fourthly, formal MFIs need to balance sufficient resources to ensure their operational objectivesand create solutions that incorporate the productivity and profitability goals.
This study assessed the relationship between the productivity and profitability of formal MFIs in Vietnam. Subsequent research can be extended to other institutions that provide microfinance services in Vietnam and further investigate other factors including macro and micro factors to achieve more comprehensive results on the interactive and causal relationship between productivity and profitability.
Funding: This study received no specific financial support. |
Competing Interests: The author declares that there are no conflicts of interests regarding the publication of this paper. |
REFERENCES
Abdulai, A. and D.D. Tewari, 2017. Trade-off between outreach and sustainability of microfinance institutions: Evidence from Sub-Saharan Africa. Enterprise Development and Microfinance, 28(3): 162-181. Available at: https://doi.org/10.3362/1755-1986.16-00014.
Abrar, A. and A.Y. Javaid, 2016. The impact of capital structure on the profitability of microfinance institutions. South Asian Journal of Management, 10(1): 21-37. Available at: https://doi.org/10.21621/sajms.2016101.03.
Adhikary, S. and G. Papachristou, 2014. Is there a trade-off between financial performance and outreach in South Asian microfinance institutions? The Journal of Developing Areas, 48(4): 381-402. Available at: https://doi.org/10.1353/jda.2014.0081.
Adusei, M., 2015. Bank profitability: Insights from the rural banking industry in Ghana. Cogent Economics & Finance, 3(1): 1-15. Available at: https://doi.org/10.1080/23322039.2015.1078270.
asharat, A., Arshad, A. and Khan, R., 2014. Efficiency, productivity, risk and profitability of microfinance industry. Pakistan Microfinance Network, 22: 1-10. Available at: http://www.microfinanceconnect.info/assets/articles/0ce95c3617279cc5b3101036da684b6c.pdf.
Berguiga, I., Y. Said and P. Adair, 2017. The social and financial performance of microfinance institutions in the MENA region: Do Islamic institutions perform better? Paper Presented at the 34th International Conference of the French Finance Association AFFI, May 31-June 2, 2017, University of Grenoble, Valence (France).
Bruett, T., I. Barres, L. Curran, A. Escalona, E.P. Nelson, D. Norell and M. Stephens, 2005. Measuring performance of microfinance institutions. Washington: SEEP Network.
Churchill, S.A. and A. Marr, 2017. Sustainability and outreach: A comparative study of MFIs in South Asia and Latin America and the Caribbean. Bulletin of Economic Research, 69(4): 19-41. Available at: https://doi.org/10.1111/boer.12100.
Fiebig, M., Hannig, A. and Wisniwski, S., 1999. Savings in the context of microfinance–state of knowledge. Available at: http://citeseerx.ist.psu.edu/viewdoc/download?doi=10.1.1.521.1871&rep=rep1&type=pdf
Forghani, M., M. Shirazipour and A. Hosseini, 2013. Impact of working capital management on firms performance. Journal of Basic and Applied Scientific Research, 3(7): 943 -947.
Kipesha, E.F. and X. Zhang, 2013. Sustainability, profitability and outreach tradeoffs: Evidences from microfinance institutions in East Africa. European Journal of Business and Management, 5(8): 136 - 148.
MicroRate, 2014. Technical guide: Performance and social indicators for microfinance institutions. Industry Research Report. Lima, Peru.
Monyi, J.N., 2017. Determinants of financial performance of deposit taking microfinance institutions in Kenya. A Thesis of Doctor of Philosophy. The Jomo Kenyatta University of Agriculture and Technology.
National Assembly, 2010. Law on credit institutions, No. 47/2010/QH12. Ha Noi, Vietnam. Available from https://www.economica.vn/Portals/0/Documents/f6c24d103517f2a8c3ea307d119a2e0e.pdf [Accessed September 10th, 2019].
Pai, J.R. and K.B. Banda, 2014. Impact of aggressive and conservative working capital management policy on firms profitability. International Research Journal of Social Science and Management, 4(1): 105 – 110.
Pal, D. and S.K. Mitra, 2017. Does the number of borrowers per loan officer influence microfinance institution asset quality? A stochastic frontier analysis. Economic Research, 76(300): 81-103. Available at: https://doi.org/10.1016/j.inveco.2016.11.007.
Rajaonera, I. and F. Rakotomanana, 2017. Impact of microcredits on non-agricultural family production units in Madagascar. R4D Working Paper No. 2017/03. Swiss Programme for Research on Global Issues for Development: 20-22.
Rashid, A. and K. Twaha, 2013. Exploring the determinants of the productivity of Indian microfinance institutions. Theoretical and Applied Economics, 18(12): 83-96.
Wassie, S.B., H. Kusakari and M. Sumimoto, 2019. Performance of microfinance institutions in Ethiopia: Integrating financial and social metrics. Social Sciences, 8(4): 1-13. Available at: https://doi.org/10.3390/socsci8040117.
World Bank, 2004. Microfinance and the poor in central Asia challenges and opportunities. Agriculture and Rural Development Discussion, 6. Washington, D.C: Europe and Central Asia Region. pp: 6-16.
Views and opinions expressed in this article are the views and opinions of the author(s), Asian Economic and Financial Review shall not be responsible or answerable for any loss, damage or liability etc. caused in relation to/arising out of the use of the content. |