


FINDING HIDDEN PATTERN OF FINANCIAL TIME SERIES BASED ON SCORE MATRIX IN SEQUENCE ALIGNMENT

1School of Economics & Management, University of Chinese Academy of Sciences, Beijing 100190 P.R. China; Research Center on Fictitious Economy & Data Science, Chinese Academy of Sciences, Beijing, 100190 P.R. China; Key Laboratory of Big Data Mining & Knowledge Management, Chinese Academy of Sciences, Beijing, 100190 P.R. China; College of Information Science and Technology, University of Nebraska at Omaha, Omaha, NE 68182, USA
2,3,4,5School of Economics & Management, University of Chinese Academy of Sciences, Beijing 100190 P.R. China; Research Center on Fictitious Economy & Data Science, Chinese Academy of Sciences, Beijing, 100190 P.R. China; Key Laboratory of Big Data Mining & Knowledge Management, Chinese Academy of Sciences, Beijing, 100190 P.R. China
ABSTRACT
This paper applies sequence alignment method of bioinformatics to financial analysis to find hidden pattern from financial markets. Results of simulation suggest that sequence alignment method can be used to identify key points to inset, delete and replace data in time series, to find lead-lag relationship between two time series, and to analyze matching patterns. We further propose a new score matrix named similarity-oriented matrix which is designed based on the characteristics of financial time series, and apply it to China’s stock market. The empirical analysis verifies the validity of our proposed score matrix, and tests the sensitivity for different threshold values of symbols definition
Keywords:Sequence alignment Score matrix Financial time series.
ARTICLE HISTORY: Received:31 August 2018. Revised:5 October 2018. Accepted:8 November 2018. Published:3 December 2018.
Contribution/ Originality:This study is one of very few studies which have investigated score matrix in financial markets. The paper’s primary contribution is finding that sequence alignment method of bioinformatics can be used to find hidden pattern of financial time series.
1. INTRODUCTION
Recognizing hidden patterns from financial time series has a wide application. Risk management, portfolio construction, asset pricing, and stock price prediction can all benefit from studies of the sequence characteristics and the relationship between variables. The prior literatures use a variety of models to describe the relationship of financial time series, including ARMA, GARCH, VAR, and Copula (Kim, 2001 ![]() ; He and Gong, 2009
; He and Gong, 2009 ![]() ; Baele et al., 2010
; Baele et al., 2010 ![]() ; Garcia and Tsafack, 2011
; Garcia and Tsafack, 2011 ![]() ; Gallegati, 2012
; Gallegati, 2012 ![]() ; Gupta and Guidi, 2012
; Gupta and Guidi, 2012 ![]() ). Each of these methods has its applicability and limitations, including: (1) little tolerance for noise, which would probably over fitting and lead to unreliable results; (2) based on certain assumptions, for instance, time series should obey a certain distribution; (3) when analyzing lead-lag relationship between two time series, its order is usually fixed; (4) if it contains missing data in time series, it is difficult to identify the missing place; (5) complex models are hard to understand and apply for investors. In these cases, some researchers attempt to use physics or biology methods to extract hidden patterns from financial time series.
). Each of these methods has its applicability and limitations, including: (1) little tolerance for noise, which would probably over fitting and lead to unreliable results; (2) based on certain assumptions, for instance, time series should obey a certain distribution; (3) when analyzing lead-lag relationship between two time series, its order is usually fixed; (4) if it contains missing data in time series, it is difficult to identify the missing place; (5) complex models are hard to understand and apply for investors. In these cases, some researchers attempt to use physics or biology methods to extract hidden patterns from financial time series.
In bioinformatics, sequence alignment method is to find similar structure of biological sequences, such as DNA, RNA or protein, by matching their counterpoints (Needleman and Wunsch, 1970 ![]() ; Smith and Waterman, 1981
; Smith and Waterman, 1981 ![]() ; Pevsner, 2005
; Pevsner, 2005 ![]() ). Using sequence alignment method, one can identify maximum base pairing (DNA sequence alignment) or residues (protein sequence alignment), and its results reflect similarity between two series. The aim of sequence alignment method in bioinformatics is similar with the financial time series we analyze. Using sequence alignment method to compare similar financial sequence, we can find hidden pattern of financial time series without prior assumptions related to distribution. It can also be used to analyze lead-lag relationships and to find missing data, which will increase the tolerance for noise. However, since sequence alignment designed for DNA and protein is to analyze discrete data, while financial time series, such as stock price in financial markets, are continuous, it cannot be directly used in financial field. Thus, in this paper, we first discuss how to discretize continuous time series in financial markets to get corresponding symbol data for sequence alignment. Then, use sequence alignment method to construct financial sequence alignment model to recognize key points, lead-lag relationship, and hidden pattern of financial time series. It is meaningful for both financial time series analysis and application field extension of sequence alignment method.
). Using sequence alignment method, one can identify maximum base pairing (DNA sequence alignment) or residues (protein sequence alignment), and its results reflect similarity between two series. The aim of sequence alignment method in bioinformatics is similar with the financial time series we analyze. Using sequence alignment method to compare similar financial sequence, we can find hidden pattern of financial time series without prior assumptions related to distribution. It can also be used to analyze lead-lag relationships and to find missing data, which will increase the tolerance for noise. However, since sequence alignment designed for DNA and protein is to analyze discrete data, while financial time series, such as stock price in financial markets, are continuous, it cannot be directly used in financial field. Thus, in this paper, we first discuss how to discretize continuous time series in financial markets to get corresponding symbol data for sequence alignment. Then, use sequence alignment method to construct financial sequence alignment model to recognize key points, lead-lag relationship, and hidden pattern of financial time series. It is meaningful for both financial time series analysis and application field extension of sequence alignment method.
The rest of this paper is organized as follows. Section 2 is the literature review for sequence alignment method and its application in financial markets. Section 3 introduces the model of sequence alignment for financial time series. Section 4 proposes a score matrix we called similarity-oriented matrix in order to find hidden patterns in financial time series. Section 5 conducts simulation to test application of sequence alignment method in different cases of financial markets. Section 6 conduct empirical analysis to study characteristics and relationship between two stock markets in China (Shanghai Composite Index and Shenzhen Component Index), and sensitive analysis of different threshold values of symbols definition. Section 7 concludes the main results in this paper and provides research expectation.
2. LITERATURE REVIEW
In biology, similarity of DNA or protein can be measured by similarity of nucleic acid or amino acid sequence. Since function and structure mainly depend on its sequence, finding similar sequence can help to find similar structure and function, and can even speculate evolutionary relationship of the gene. Thus, sequence alignment is a common method to compare sequence of DNA or protein, and find their similarity and difference patterns. Researches on sequence alignment mainly can be divided into two parts: the one is to improve its algorithm accuracy and computation speed (Gibbs and McIntyre, 1970 ![]() ; Pearson and Lipman, 1988
; Pearson and Lipman, 1988 ![]() ; Altschul et al., 1990
; Altschul et al., 1990 ![]() ; Lambert et al., 2003
; Lambert et al., 2003 ![]() ; Altschul et al., 2008
; Altschul et al., 2008 ![]() ; Dickson and Gloor, 2012
; Dickson and Gloor, 2012 ![]() ; Khazanov et al., 2012
; Khazanov et al., 2012 ![]() ; Herman et al., 2015
; Herman et al., 2015 ![]() ; Mirarab, 2015
; Mirarab, 2015 ![]() ) and the other is to apply it to study similar structure of the sequences to speculate their evolutionary relationship (Li et al., 2008
) and the other is to apply it to study similar structure of the sequences to speculate their evolutionary relationship (Li et al., 2008 ![]() ; Jangam et al., 2009
; Jangam et al., 2009 ![]() ; Li et al., 2010
; Li et al., 2010 ![]() ; Di Tommaso et al., 2011
; Di Tommaso et al., 2011 ![]() ; Mirarab et al., 2015
; Mirarab et al., 2015 ![]() ; Nguyen, 2016
; Nguyen, 2016 ![]() ; Yamada et al., 2016
; Yamada et al., 2016 ![]() ). In this paper, we mainly concern about the application of sequence alignment beyond biological field, especially in financial analysis. The literatures applying sequence alignment method to financial markets are as follows.
). In this paper, we mainly concern about the application of sequence alignment beyond biological field, especially in financial analysis. The literatures applying sequence alignment method to financial markets are as follows.
Takuya Yamano used sequence alignment method to analyze financial markets (Yamano et al., 2008 ![]() ). In empirical analysis, they studied similarity of Brazil index and the Dow Jones industrial average. They suggested using sequence alignment method to analyze financial time series can recognize similar characteristics in different markets. Besides, this method can tolerate abnormal data and time-lag.
). In empirical analysis, they studied similarity of Brazil index and the Dow Jones industrial average. They suggested using sequence alignment method to analyze financial time series can recognize similar characteristics in different markets. Besides, this method can tolerate abnormal data and time-lag.
Xu combined fuzzy logic theory and sequence alignment method (Xu, 2010 ![]() ). Opening price, closing price, maximum and minimum price were encoded into K-chart, which then can be recognized by sequence alignment. Xu used financial time series in Chinese markets from 1990 to 2006 to predict its trend in 2007-2008. The results suggested that some of the patterns can be used as trading signal, while some other patterns do not have such function.
). Opening price, closing price, maximum and minimum price were encoded into K-chart, which then can be recognized by sequence alignment. Xu used financial time series in Chinese markets from 1990 to 2006 to predict its trend in 2007-2008. The results suggested that some of the patterns can be used as trading signal, while some other patterns do not have such function.
Xu combined K-nearest and sequence alignment method to predict stock price (Mei, 2013 ![]() ). First, Shanghai Composite Index and Shenzhen Component Index were symbolized. Then, using sequence alignment method, k subsequences were obtained for stock price prediction by K-nearest method.
). First, Shanghai Composite Index and Shenzhen Component Index were symbolized. Then, using sequence alignment method, k subsequences were obtained for stock price prediction by K-nearest method.
Yih-Wenn Laih combined GARCH-Copula and sequence alignment method to calculate rank correlation coefficient of financial time series, and analyze correlation of stock index in Four Asian Tigers (Laih, 2014 ![]() ). Empirical results suggested rank correlation coefficient based on sequence alignment method is larger than other methods.
). Empirical results suggested rank correlation coefficient based on sequence alignment method is larger than other methods.
There is a few of literatures applied sequence alignment method in financial markets, and they mainly focus on the correlation between financial time series or stock price prediction. Actually, besides these, the applications of sequence alignment method in financial research can be more extensive, such as lead-lag relationship recognition and missing data finding. Moreover, when prior researches applied sequence alignment in financial time series analysis, the score matrix they use is usually setting a certain value for symbol pairs, which we called simple matrix in this paper. Since simple matrix ignores match probability contained in historical data, pattern, which means probability of symbols occurring in two sequences at the same time, cannot be recognized. This paper will learn from the methods of constructing PAM and BLOSUM matrix in biology, and propose a similarity-oriented score matrix to extract match patterns from financial time series. It not only provides a new method to find hidden pattern of financial time series, but also extends application fields of sequence alignment method.
3. MODEL OF SEQUENCE ALIGNMENT
In bioinformatics, sequence for alignment is a series of characters which refer to DNA, RNA or protein. Sequence alignment is to match symbols according to a scoring rule. When two sequences are placed in two lines, similar symbols are placed in the same column, while different symbols are set as mismatch or gaps. Thus, there are three cases in alignment results, as follows:
(1) Match: corresponding positions have similar symbols in different sequences.
(2) Mismatch: corresponding positions have different symbols in different sequences.
(3) Gap: insert several gaps in one sequence to make them correspond to the symbols in the other sequence.
Thus, sequence alignment is a matching algorithm to maximize similar corresponding symbols. Since we can set each case (match, mismatch and insert gap) a score, sequence alignment is to use such scoring rule to get the optimal (most similar) arrangement of the symbols in two sequences.
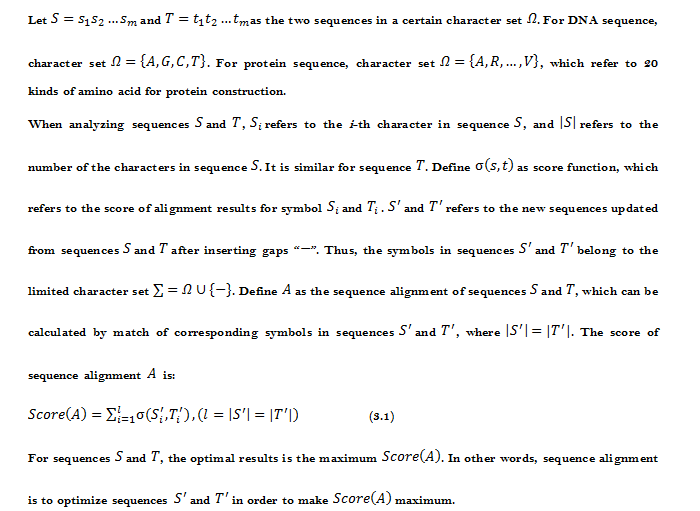
Score system of sequence alignment contains score matrix and gaps penalty. For gaps penalty, inserting gaps will deduct a certain score. For symbol replacement, score matrix is to measure matching score of the two symbols. Score function ![]() means the matching score of symbols in y-th row (y-th symbols in sequence T) and x-th column (x-th symbols in sequence S) of the score matrix. It can be seen that the result of sequence alignment depends on score matrix. Thus, score matrix design is important, and is one of our main focus in this paper.
means the matching score of symbols in y-th row (y-th symbols in sequence T) and x-th column (x-th symbols in sequence S) of the score matrix. It can be seen that the result of sequence alignment depends on score matrix. Thus, score matrix design is important, and is one of our main focus in this paper.
4. SIMILARITY-ORIENTED SCORE MATRIX
In bioinformatics, the common score matrixes for sequence alignment are Point Accepted Mutation (PAM) (Dayhoff, 1972 ![]() ; Pevsner, 2009
; Pevsner, 2009 ![]() ; Sung, 2009
; Sung, 2009 ![]() ) and BLOSUM matrix (Henikoff and Henikoff, 1992
) and BLOSUM matrix (Henikoff and Henikoff, 1992 ![]() ; Pertsemlidis and Fondon, 2001
; Pertsemlidis and Fondon, 2001 ![]() ; Eddy, 2004
; Eddy, 2004 ![]() ). PAM matrix is according to conversion rate of the amino acids in protein sequence. If the conversion rate of two amino acids is high, the matching score of them is high, and corresponding value in score matrix is large. Thus, the value of i-th row and j-th column in PAM matrix reflects conversion probability of i-th and j-th amino acid in two sequences. BLOSUM matrix is also calculated from conversion rate of the amino acids in protein sequence with a different method.
). PAM matrix is according to conversion rate of the amino acids in protein sequence. If the conversion rate of two amino acids is high, the matching score of them is high, and corresponding value in score matrix is large. Thus, the value of i-th row and j-th column in PAM matrix reflects conversion probability of i-th and j-th amino acid in two sequences. BLOSUM matrix is also calculated from conversion rate of the amino acids in protein sequence with a different method.
When applying sequence alignment model to financial time series analysis, prior researches mainly use simple score matrix, such as Unitary matrix or BLAST matrix, which set a fixed positive score when symbols in two sequences are the same, and set a fixed negative score (or 0) when they are different. However, such score matrix cannot reflect the relationship of different symbols, for example, the similarity level of the two different symbols. Thus, patterns (probability of symbols occurring in two sequences at the same time) cannot be recognized. Inspired by score matrix in bioinformatics, this paper proposes similarity-oriented matrix as score matrix to analyze financial time series, which can be used to extract match patterns from financial time series according to relationship of symbols in time series.
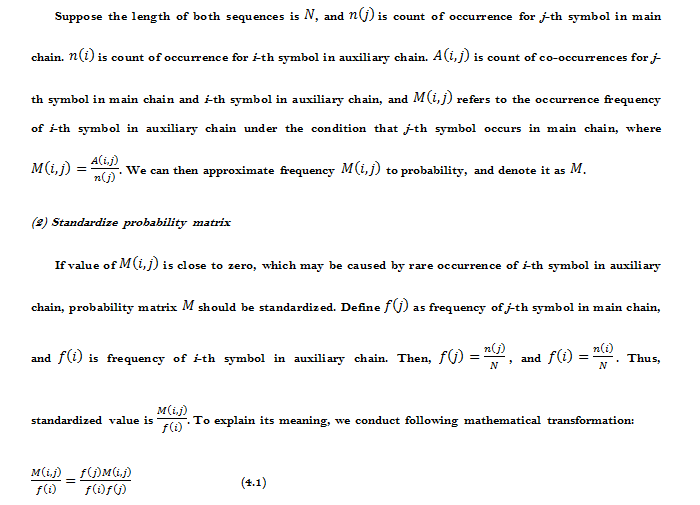
Suppose the length of two sequences are same, and symbols in both sequences are alignment. Define the first sequence as main chain, and the second sequence is auxiliary chain. Score matrix proposed in this paper called similarity-oriented matrix can be calculated as follows:
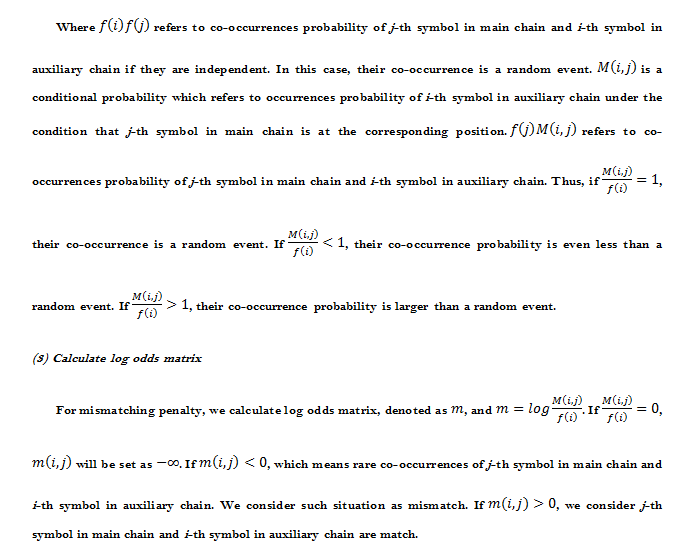
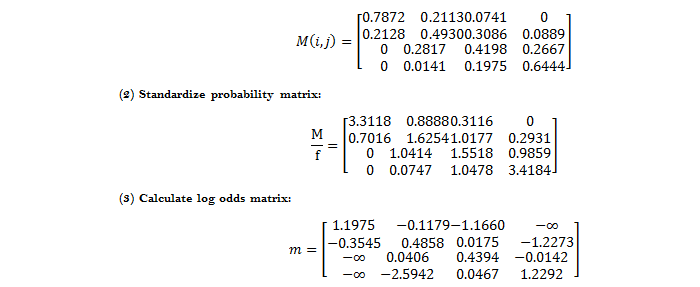
(1) Calculate co-occurrences probability matrix
Following is an example of above three steps to calculate score matrix:
Suppose a main chain
S=GACCAGCTCATTAAACTTTTGGTGTCCAGTAGGCGGCAGGGGTCTATGGACGCGAACGCAGGGGTCCCCGCCGCCATTCT
GCCGGCGCTGCA
CCGATGTATCGATAGCACAGGTGGGCGGTGTGCTCTCGGCTGGACTGCCCGGAAGTTGCCCAGAGGTGG
CGACAATCCACGGCCTAAAGACGCATGC
TCGAGTTGGTCGTCGCCGCCTCAGAGTGGGGGAG
CACGCAAACCTCCAGGAA
CTT,
and an auxiliary chain
T=GCCGAAGTCATTAAAGTTTGGATGTGGCCGATCCGGCAGGGCGCTACAGACTGGAACCGAGTCGTGCGATCCACAAGTATT
CCGAGCCGGCAC
AACCTGCTGCAGCGAAAAGCTGGCTGTGGGGGCTGTGACCTAGTCACCCCCACGTGGACAGATGTGCCC
CAACTCCAGCCAGTAAACAAGGCTGCGACA
CTTTCTCGTTGCCGCCTGACAGCCTCTTATAACGCCAACATGCACGAACGT.
(1) Calculate co-occurrences probability matrix:
5. SIMULATION
Because sequence alignment method is firstly used to analyze biological sequence which is discrete, when it is applied to financial field where have different data characteristics, we conduct 3 simulations to test validity of the sequence alignment method used in the time series analysis. The simulation contains following steps. First, generate datasets for simulation, which is to get discrete data from a certain function. Next, symbolize datasets, which is to classify datasets according to its characters, and define each of class a symbol, such as G, P, T and N in amino acids. Then, use sequence alignment method to analyze two sequences. Since trigonometric function with uncomplicated range has good characteristics, which can be analyzed combining unit circle, and the values appears repeatedly in the domain of definition, this paper uses trigonometric function to generate datasets for simulation.
5.1. Simulation I: Recognize Key Points in Sequence
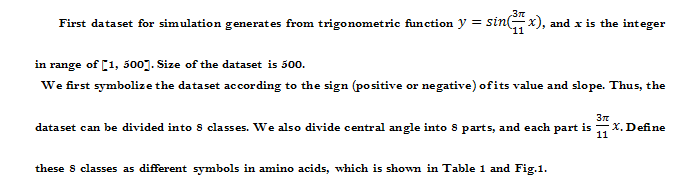
Table-1. Characters of the dataset and its corresponding symbols for simulation I.
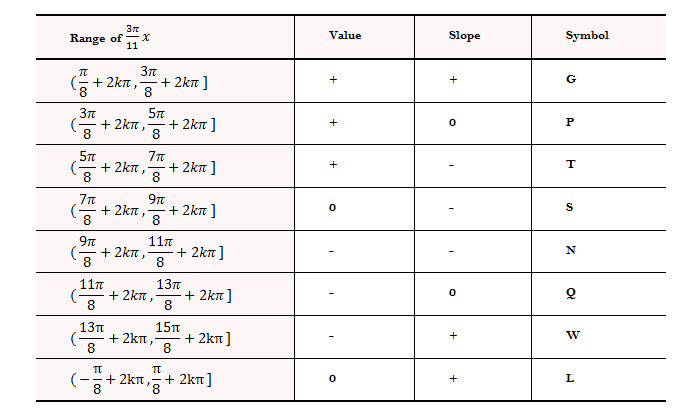
Note: k is the natural number, “+” refers to above 0, “-”refers to below 0, and “0” refers to approximate to 0.
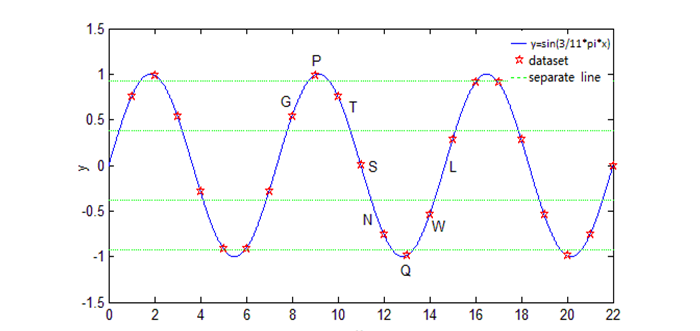
Fig-1. Characters of the dataset and its corresponding symbols for simulation I.
For sequence alignment of the two sequences, define dataset in Fig.1 as sequence a, which contains 500 symbols. Random delete 50 characters in sequence a, and get sequence b. We use simple score matrix for sequence alignment of sequence a and b, that is, the score will get 1 point if the symbols at the same position of the two sequences are the same, otherwise get 0. This score matrix is also called unitary matrix. Suppose no gap penalty here. The results are shown in Fig.2. It can be seen that several gaps are inserted into sequence b so that two sequences are matched. Moreover, if sequence b is generated by replacing some symbols in sequence a, the alignment results will find the mismatch position.
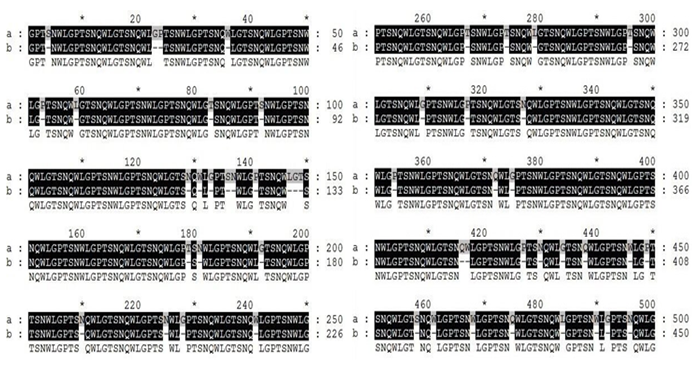
Fig-2. Results of the sequence alignment for simulation I.
The results in simulation I suggest if two sequences are similar, we can use sequence alignment method to find insert, delete, and replace points in one sequence by comparing with the other, which is useful for financial time series analysis, because in practice, original financial time series may contain abnormal data or missing data. In that case, we can use sequence alignment method to find the position of these abnormal or missing data if we find a sequence highly similar to the original financial sequence.
5.2. Simulation II: Recognize Lead-Lag Relationship of the Sequences
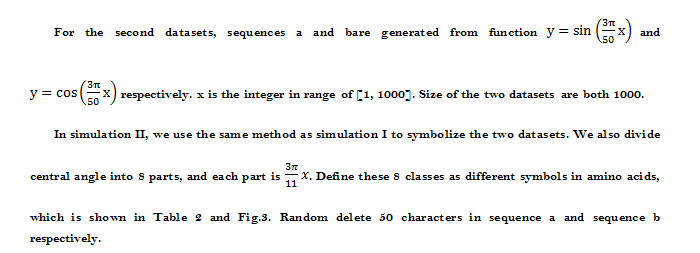
Table-2. Characters of the dataset and its corresponding symbols for simulation II.
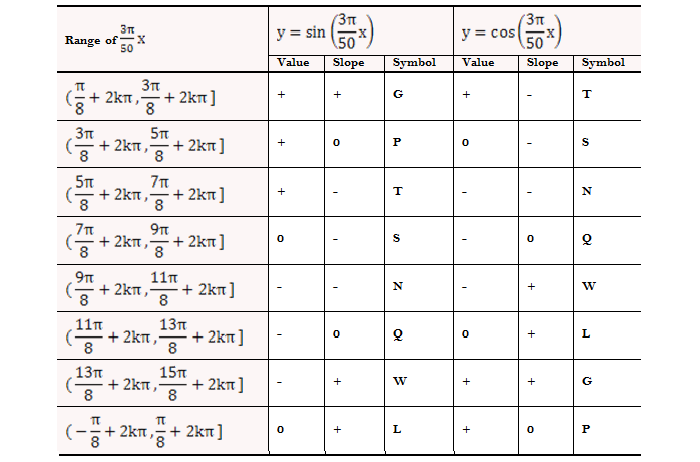
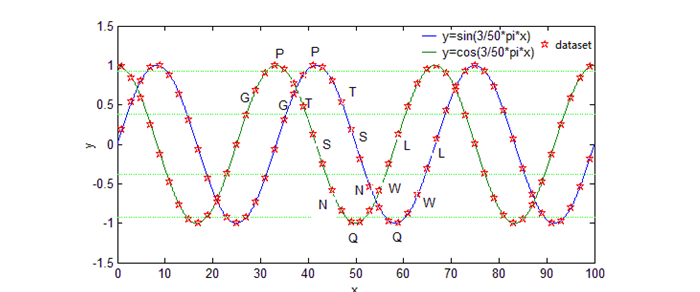
Fig-3. Characters of the dataset and its corresponding symbols for simulation II.
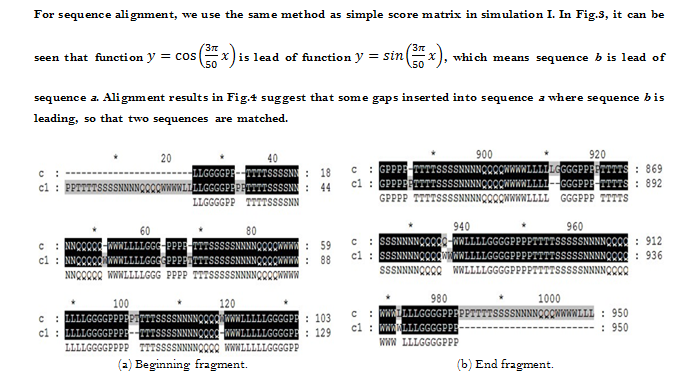
Fig-4. Beginning and end fragments of the sequence alignment result for simulation II.
The results in simulation II suggest sequence alignment method can make numbers of matching symbols as large as possible by inserting gaps. In financial studies, this method can be used to analyze lead-lag relationship between the two financial time series.
5.3. Simulation III: Recognize Similar Patterns of the Sequences
In simulation III, datasets and symbolization methods are the same as simulation II. In Fig.3, it can be seen that symbol G in sequence a is always corresponding with symbol T in sequence b, and symbol P in sequence a is always corresponding with symbol S in sequence b. It seems that there are some stable patterns between these two sequences. Thus, we apply similarity-oriented score matrix proposed in section 4 in simulation III to recognize such similar patterns.
The results of standardized probability matrix are shown in Table 3. Correspondence of symbols in two sequences is different according to different symbols. For example, standardized probability of G in sequence a with T in sequence b is 5.24, with P in sequence b is 2.53, and with S in sequence b is 0.32, which suggest symbols in the two sequences do have some stable relations.
Table-3. Standardized probability matrix for simulation III.
| Sequence b | Sequence a | |||||||
| G | P | T | S | N | Q | W | L | |
| G | 0 | 0 | 0 | 0 | 0 | 0.2777 | 5.4934 | 2.4869 |
| P | 2.5296 | 0 | 0 | 0 | 0 | 0 | 0.1402 | 5.1252 |
| T | 5.2432 | 2.3985 | 0 | 0 | 0 | 0 | 0 | 0.3331 |
| S | 0.3224 | 5.1238 | 2.3571 | 0 | 0 | 0 | 0 | 0 |
| N | 0 | 0.2642 | 5.3087 | 2.4632 | 0 | 0 | 0 | 0 |
| Q | 0 | 0 | 0.3381 | 5.0831 | 2.4771 | 0 | 0 | 0 |
| W | 0 | 0 | 0 | 0.4029 | 5.3756 | 2.4083 | 0 | 0 |
| L | 0 | 0 | 0 | 0 | 0.2752 | 5.2724 | 2.5441 | 0 |
We introduce similarity-oriented scoring matrix for sequence alignment. In this simulation, set 3 points as penalty point for inserting gaps, because all of the standardized probability of symbols in Table 3 is below 3 except respective maximum matching value of each symbol. Thus, this penalty point ensures that gaps will not be inserted for matching two symbols if co-occurrence probability of the two symbols is not the maximum. Results of sequence alignment are shown in Fig.5. It suggests that G, P, T, S, N, Q, W, L in sequence a are matching with T, S, N, Q, W, L, G, P in sequence b respectively.
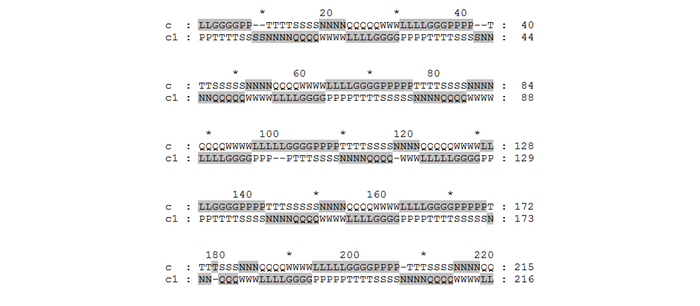
Fig-5. Fragment of the sequence alignment result for simulation III.
The results in simulation III show that we can recognize matching patterns using similarity-oriented score matrix. The sequences for alignment not only can be the sequences with lead-lag relationship like datasets in simulation III, but also sequences with some other matching patterns, such as a set of sequences defined by cosine function and sawtooth wave function respectively, shown in Fig.6. In financial analysis, as long as there are some stable matching patterns between two sequences, we can use sequence alignment method with proposed similarity-oriented score matrix to find them.
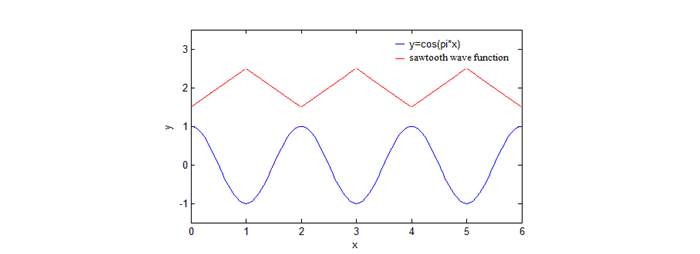
Fig-6. Cosine function and sawtooth wave function.
To sum up, we verify sequence alignment and proposed similarity-oriented score matrix can be used to analyze financial time series in different cases. In simulation I, the results suggest sequence alignment method is useful for data missing problem. In simulation II, it suggests that sequence alignment method can be used to analyze lead-lag relationship of financial time series. In simulation III, we can use proposed similarity-oriented score matrix to find stable matching patterns between two sequences. The similarity-oriented score matrix is not only proposed for sequences alignment, but also for hidden pattern finding. As shown in Fig.6, peaks in trigonometric function are always corresponding to valleys in sawtooth wave function, which is a kind of matching patterns, and vice versa.
6. EMPIRICAL ANALYSIS
We use sequence alignment method and score matrix we proposed to analyze characters and correlation of the two markets in China, whose representative are Shanghai composite index (SH) and Shenzhen component index (SZ) respectively. Because both of the two indices reflect Chinese stock market and their constituent stocks are different, these two indices are highly correlated but not completely same. Unlike traditional methods such as Pearson correlation coefficient to get an overall coefficient to reflect their correlation, the methods in this paper more concern about their matching patterns under certain correlation. For example, we attempt to find sharply drop of one index is always corresponding to which status of the other index, and to find whether co-occurrence of drop is more frequent than rise for the two indices. We also use different threshold to separate stock market index into several bullish and bearish intervals for sensitive analysis.
6.1. Sample and Datasets
Shanghai composite index is the weighted price of all the stocks listed in Shanghai Stock Exchange (SSE). Shenzhen composite index is the weighted stock price index of 500 representative listed companies in Shenzhen Stock Exchange (SZSE). Compared with SSE, SZSE contains more small and medium-size stocks. For example, in 2015, the weight of the small and medium-size stocks is 34% and weight of growth enterprise stocks is 16% in Shenzhen composite index.
Samples we use are time series of close prices of these two composite indices from May 31, 2005 to December 31, 2013.We define returns of the index as ![]() and get 2089 observed data. The Pearson correlation coefficient of the two indices is 0.926. Our target is to use proposed similarity-oriented score matrix to find intrinsic hidden patterns under this high correlation.
and get 2089 observed data. The Pearson correlation coefficient of the two indices is 0.926. Our target is to use proposed similarity-oriented score matrix to find intrinsic hidden patterns under this high correlation.
6.2. Symbolization of Returns Series
In order to analyze characters of the two markets in China, we symbolize returns series as several intervals to reflect bullish and bearish. We define top 100 returns as sharply rise, called T, define last 100 as sharply drop, called A, define returns no less than 0 and except top 100 as weakly rise, called G, and define returns below 0 and except last 100 as weakly drop, called C. Symbols and its frequency in two markets are shown in Table 4. It can be seen that the value of quantile of sharply drop A is larger than sharply rise T in both markets, which suggests that drop rate is larger than rise. Besides, both absolute values of quantile T and A in Shenzhen are larger than Shanghai, which implies that volatility of Shenzhen is more than Shanghai. It is reasonable because compared with Shanghai, there are more small and medium-size stocks in Shenzhen.
Table-4. Symbols and its frequency for index returns series.
| Symbol | SH frequency | SH interval | SZ frequency | SZ interval |
| A | 0.0479 | (-∞,-2.96%) | 0.0479 | (-∞,-3.19%) |
| C | 0.4119 | [-2.96%,0) | 0.4248 | [-3.19%,0) |
| G | 0.4923 | [0,2.66%) | 0.4794 | [0,3.16%) |
| T | 0.0479 | [2.66%,+∞) | 0.0479 | [3.16%,+∞) |
6.3. Analysis Based on Similarity-Oriented Score Matrix
Define symbolized returns series of Shanghai as main chain, and that of Shenzhen as auxiliary chain. Then we use method proposed above to calculate score matrix.
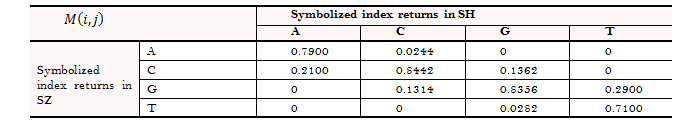
(1) Calculate co-occurrences probability matrix, which refers to probability of returns in Shenzhen is i if returns of index in Shanghai is j. Thus, the sum of the value in each column in this matrix is 1. Probability matrix are shown in Table 5.
Table-5. Probability matrix for symbolized index returns.
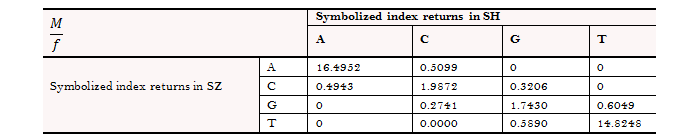
(2) Standardize probability matrix above, and the results are shown in Table 6.
Table-6. Standardize probability matrix for symbolized index returns.
(3)Calculate log odds matrix, and the results are shown in Table 7.
Table-7. Logarithmic probability matrix for symbolized index returns.
| m
|
Symbolized index returns in SH | ||||||
| A | C | G | T | ||||
| Symbolized index returns in SZ | A | 2.8031 | -0.6736 | -∞ | -∞ | ||
| C | -0.7045 | 0.6867 | -1.1376 | -∞ | |||
| G | -∞ | -1.2943 | 0.5556 | -0.5027 | |||
| T | -∞ | -∞ | -0.5293 | 2.6963 | |||
It can be seen that the score become positive only when corresponding symbols are same based on the matrix in Table 7 for sequence alignment, which indicates synchronism of the two indices. The value of A in Shanghai (Shenzhen) and G or T in Shenzhen (Shanghai) is -∞, because there is no sample that A and G (or T) are co-occurrence in this time period. As for absolute value, the score for symbol A is larger than symbol T, and symbol C is larger than symbol G, which suggests concurrent decrease of the two indices is more common than rise. Besides, the score for symbol A is larger than symbol C, and symbol T is larger than symbol G, which suggests extreme volatility leads to much more co-movement of the two indices.
6.4. Sensitive Analysis
We use different threshold to separate stock market index into several bullish and bearish interval for sensitive analysis. We expand samples to November 24, 2015, and get 2550 observed data.
(1) Symbolization of returns series
We use three cases for analysis. Definition of quantile in first case is the strictest. We define the highest 5% returns as sharply rise, called T, define the lowest 5% as sharply drop, called A, define returns no less than 0 and except the highest 5% as weakly rise, called G, and define returns below 0 and except the lowest 5% as weakly drop, called C. In second case, we release such quantile. Define the highest 10% and lowest 10% as T and A respectively. In third case, we further release it. Define the highest 15% and lowest 15% as T and A respectively. Rule for definition of C and G is ditto. Symbols and its interval in different quantile for the two markets are shown in Table 8.
Table-8. Symbols and its interval in different quantile.
| Quantile | Symbol | A | C | G | T |
| 5% | SH interval | (-∞, -2.9521%) | [-2.9521%, 0) | [0,2.6734%) | [2.6734%, +∞) |
| amount | 128 | 1031 | 1263 | 128 | |
| SZ interval | (-∞, -3.1936%) | [-3.1936%, 0) | [0, 3.1602%) | [3.1602%, +∞) | |
| amount | 128 | 1072 | 1222 | 128 | |
| 10% | SH interval | (-∞, -1.9180%) | [-1.9180%, 0) | [0, 2.0103%) | [2.0103%, +∞) |
| a | 255 | 904 | 1136 | 255 | |
| ount | |||||
| SZ interval | (-∞, -2.1774%) | [-2.1774%, 0) | [0, 2.3594%) | [2.3594%, +∞) | |
| amount | 255 | 945 | 1095 | 255 | |
| 15% | SH interval | (-∞, -1.4035%) | [-1.4035%, 0) | [0, 1.5496%) | [1.5496%, +∞) |
| amount | 383 | 776 | 1008 | 383 | |
| SZ interval | (-∞, -1.6114%) | [-1.6114% | [0, 1.8222%) | [1.8222%, +∞) | |
| 0) | |||||
| amount | 383 | 817 | 967 | 383 |
It can be seen that absolute returns of the highest 5% and lowest 5% in Shanghai is more than 2.67%, and in Shenzhen is more than 3.16%. It is similar with quantile of top and end 100 in section 6.3. When quantile is 10% or 15%, the absolute returns is not large enough, so that we called big drop for symbol A, and big rise for symbol T in these two cases.
Absolute returns of the lowest 5% is larger than the highest 5% in both markets, which indicates drop rate is larger than rise. However, absolute returns of the highest 10% and 15% is larger than the lowest 10% and 15% respectively, which suggests distribution of index return is more concentrated in big rise (not sharply rise) than big drop (not sharply drop). Besides, in all the three cases, absolute returns at quantile in Shenzhen is larger than Shanghai. It suggests compared with Shanghai, Shenzhen which contains more small and medium-size stocks has more sharply volatility.
(2) Analysis Based on Score Matrix
Using quantile above to symbolize returns series in two markets, we define Shanghai as main chain, and Shenzhen as auxiliary chain. We use method proposed in section 4 to calculate score matrix, standardized probability matrix, and logarithmic probability matrix. The results are shown in Table 9, 10, and 11.
Table-9. Results of sensitive analysis for 5% quantile symbolization.
| Symbolized index returns in SH | |||||
| Probability matrix | A | C | G | T | |
| Symbolized index returns in SZ | A | 0.7969 | 0.0252 | 0 | 0 |
| C | 0.2031 | 0.84 | 0.1425 | 0 | |
| G | 0 | 0.1348 | 0.8274 | 0.2969 | |
| T | 0 | 0 | 0.0301 | 0.7031 | |
| Standardized matrix | A | C | G | T | |
| Symbolized index returns in SZ | A | 15.8752 | 0.5024 | 0 | 0 |
| C | 0.4832 | 1.998 | 0.339 | 0 | |
| G | 0 | 0.2813 | 1.7266 | 0.6195 | |
| T | 0 | 0 | 0.5994 | 14.0076 | |
| Logarithmic matrix | A | C | G | T | |
| Symbolized index returns in SZ | A | 2.7648 | -0.6884 | -∞ | -∞ |
| C | -0.7274 | 0.6922 | -1.0817 | -∞ | |
| G | -∞ | -1.2682 | 0.5461 | -0.4788 | |
| T | -∞ | -∞ | -0.5118 | 2.6396 | |
Table-10. Results of sensitive analysis for 10% quantile symbolization.
| Symbolized index returns in S | |||||
| Probability matrix | A | C | G | T | |
| Symbolized index returns in SZ | A | 0.7922 | 0.0586 | 0 | 0 |
| C | 0.2039 | 0.7887 | 0.1549 | 0.0157 | |
| G | 0.0039 | 0.1515 | 0.7852 | 0.2549 | |
| T | 0 | 0.0011 | 0.0599 | 0.7294 | |
| Standardized matrix | A | C | G | T | |
| Symbolized index returns in SZ | A | 7.9216 | 0.5863 | 0 | 0 |
| C | 0.5503 | 2.1283 | 0.4181 | 0.0423 | |
| G | 0.0091 | 0.3529 | 1.8286 | 0.5936 | |
| T | 0 | 0.0111 | 0.5986 | 7.2941 | |
| Logarithmic matrix | A | C | G | T | |
| Symbolized index returns in SZ | A | 2.0696 | -0.534 | -∞ | -∞ |
| C | -0.5974 | 0.7553 | -0.8721 | -3.1623 | |
| G | -4.6959 | -1.0415 | 0.6035 | -0.5215 | |
| T | -∞ | -4.5042 | -0.5132 | 1.9871 | |
Table-11. Results of sensitive analysis for 15% quantile symbolization.
| Symbolized index returns in SH | |||||
| Probability matrix | A | C | G | T | |
| Symbolized index returns in SZ | A | 0.8094 | 0.0889 | 0.004 | 0 |
| C | 0.1828 | 0.7358 | 0.1687 | 0.0157 | |
| G | 0.0078 | 0.174 | 0.7431 | 0.2089 | |
| T | 0 | 0.0013 | 0.0843 | 0.7755 | |
| Standardized matrix | A | C | G | T | |
| Symbolized index returns in SZ | A | 5.389 | 0.592 | 0.0264 | 0 |
| C | 0.5704 | 2.2966 | 0.5264 | 0.0489 | |
| G | 0.0207 | 0.4588 | 1.9595 | 0.5508 | |
| T | 0 | 0.0086 | 0.5614 | 5.163 | |
| Logarithmic matrix | A | C | G | T | |
| Symbolized index returns in SZ | A | 1.6844 | -0.5242 | -3.6336 | -∞ |
| C | -0.5613 | 0.8314 | -0.6417 | -3.0181 | |
| G | -3.8798 | -0.7792 | 0.6727 | -0.5964 | |
| T | -∞ | -4.7583 | -0.5773 | 1.6415 | |
It can be seen that in all of the three cases, only when corresponding symbols are same does the score become positive, which verifies the results that two indices are synchronism. Besides, absolute score for symbol A is larger than symbol T, and symbol C is larger than symbol G, which suggests concurrent decrease of the two indices is more common than rise. The score for symbol A is larger than symbol C, and symbol T is larger than symbol G, which suggests extreme volatility leads to much more co-movement of the two indices. These results are similar with results in section 6.3, and prove the robustness of the results.
Besides, we also find when define the lowest 5% of the returns as A, the value of A in Shanghai (Shenzhen) with G or T in Shenzhen (Shanghai) is -∞, ecause there is no sample that A and G (or T) are co-occurrence in this time period. While define the lowest 15% of the returns as A, the value of A in Shanghai (Shenzhen) with G in Shenzhen (Shanghai) may not be -∞, because with release of extreme symbol’s definition, some absolute returns assigned to symbol A (or T) are not significantly higher than those of C (or G). Except correlation coefficient, proposed similarity-oriented score matrix helps us to find hidden patterns in these two correlated series.
6.5. Summary
Here we summarize hidden patterns we find in Chinese stock index SSE and SZSE under their high correlation in empirical analysis. (1) Rise and decrease are approximately synchronous in two indices. (2) Simultaneous decrease of the two indices is more common than rise. (3) Extreme volatility leads to much more co-movement of the two indices.
The difference between our method in this paper and traditional correlation analysis in financial time series is that our goal is not to value how similar of the two series. Traditional correlation analysis like Pearson correlation coefficient calculate an overall coefficient to reflect their correlation, while the similarity-oriented score matrix we propose is to find intrinsic hidden pattern between two highly correlated series.
The idea of proposed similarity-oriented score matrix is based on PAM matrix in sequence alignment program. They both use known sequences to calculate frequency of aligned pairs to approximate its probability. Compared with PAM which reflect evolutionarily related of each aligned residue pair, similarity-oriented score matrix is to find co-occurs symbol pairs in different time series. For example, in above empirical analysis, the score for symbols representing decrease is larger than symbols representing rise suggests concurrent decrease of the two indices happens more than concurrent rise.
7. CONCLUSIONS
This paper discussed the application of sequence alignment for financial time series. A few of literatures use sequence alignment method to analyze financial series. Most of these previous literatures focus correlation analysis, and commonly used score matrix is simple matrix, which is to set a fix value subjectively. This paper suggests sequence alignment method and its score matrix can be used to more fields in financial series analysis. In simulation, we have verified simple matrix can be used to find key points, including insert, delete, and replace points, and to analyze lead-lag relations in first two simulations. Further, based on methods of calculating PAM matrix, we propose a similarity-oriented score matrix to find hidden patterns and adopt it in both simulation and empirical analysis.
We apply similarity-oriented score matrix to study characteristics and relationship between two stock markets in China. Since data characteristics for biological sequence and financial series are different, sequence alignment method cannot be directly used in financial analysis. We first symbolize financial time series as several intervals to reflect bullish and bearish. Then, use proposed similarity-oriented score matrix to find matching patterns of these two indices under their high correlation. The results suggest co-occurrence of the volatility in the two markets, and more co-movement in extreme volatility. In sensitive analysis, we get the similar results for different threshold values of symbols definition, and further evidence of co-movement in extreme cases. These results are meaningful for both financial time series analysis and application field extension of sequence alignment method.
| Funding: This research was supported by the grants from National Natural Science Foundation of China (No. 71771204, 71331005, 91546201). |
| Competing Interests: The authors declare that they have no competing interests. |
| Contributors/Acknowledgement: All authors contributed equally to the conception and design of the study. |
REFERENCES
Altschul, S.F., E.M. Gertz, R. Agarwala, A.A. Schäffer and Y.-K. Yu, 2008. PSI-BLAST pseudocounts and the minimum description length principle. Nucleic Acids Research, 37(3): 815-824. Available at: https://doi.org/10.1093/nar/gkn981.
Altschul, S.F., W. Gish, W. Miller, E.W. Myers and D.J. Lipman, 1990. Basic local alignment search tool. Journal of Molecular Biology, 215(3): 403-410. Available at: https://doi.org/10.1006/jmbi.1990.9999.
Baele, L., G. Bekaert and K. Inghelbrecht, 2010. The determinants of stock and bond return comovements. The Review of Financial Studies, 23(6): 2374-2428. Available at: https://doi.org/10.1093/rfs/hhq014.
Dayhoff, M.O., 1972. A model of evolutionary change in proteins. Atlas of Potein Sequence and Structure, 5(3): 89-99.
Di Tommaso, P., S. Moretti, I. Xenarios, M. Orobitg, A. Montanyola, J.-M. Chang, J.-F. Taly and C. Notredame, 2011. T-Coffee: A web server for the multiple sequence alignment of protein and RNA sequences using structural information and homology extension. Nucleic Acids Research, 39(Suppl_2): W13-W17. Available at: https://doi.org/10.1093/nar/gkr245.
Dickson, R.J. and G.B. Gloor, 2012. Protein sequence alignment analysis by local covariation: Coevolution statistics detect benchmark alignment errors. PLoS One, 7(6): e37645. Available at: https://doi.org/10.1371/journal.pone.0037645.
Eddy, S.R., 2004. Where did the BLOSUM62 alignment score matrix come from? Nat Biotech, 22(8): 1035-1036. Available at: https://doi.org/10.1038/nbt0804-1035.
Gallegati, M., 2012. A wavelet-based approach to test for financial market contagion. Computational Statistics & Data Analysis, 56(11): 3491-3497. Available at: https://doi.org/10.1016/j.csda.2010.11.003.
Garcia, R. and G. Tsafack, 2011. Dependence structure and extreme comovements in international equity and bond markets. Journal of Banking & Finance, 35(8): 1954-1970. Available at: https://doi.org/10.1016/j.jbankfin.2011.01.003.
Gibbs, A.J. and G.A. McIntyre, 1970. The diagram, a method for comparing sequences: Its use with amino acid and nucleotide sequences. European Journal of Biochemistry, 16(1): 1-11. Available at: https://doi.org/10.1111/j.1432-1033.1970.tb01046.x.
Gupta, R. and F. Guidi, 2012. Cointegration relationship and time varying co-movements among Indian and Asian developed stock markets. International Review of Financial Analysis, 21(C): 10-22. Available at: https://doi.org/10.1016/j.irfa.2011.09.001.
He, X. and P. Gong, 2009. Measuring the coupled risks: A copula-based CVaR model. Journal of Computational and Applied Mathematics, 223(2): 1066-1080. Available at: https://doi.org/10.1016/j.cam.2008.03.046.
Henikoff, S. and J.G. Henikoff, 1992. Amino acid substitution matrices from protein blocks. Proceedings of the National Academy of Sciences, 89(22): 10915-10919. Available at: https://doi.org/10.1073/pnas.89.22.10915.
Herman, J.L., Á. Novák, R. Lyngsø, A. Szabó, I. Miklós and J. Hein, 2015. Efficient representation of uncertainty in multiple sequence alignments using directed acyclic graphs. BMC Bioinformatics, 1(16): 1-26.
Jangam, S.R., D.H. Yamada, S.M. McFall and D.M. Kelso, 2009. Rapid, point-of-care extraction of human immunodeficiency virus type 1 proviral DNA from whole blood for detection by real-time PCR. Journal of Clinical Microbiology, 47(8): 2363-2368. Available at: https://doi.org/10.1128/jcm.r00092-09.
Khazanov, N.A., K.L. Damm-Ganamet, D.X. Quang and H.A. Carlson, 2012. Overcoming sequence misalignments with weighted structural superposition. Proteins: Structure, Function, and Bioinformatics, 80(11): 2523-2535. Available at: https://doi.org/10.1002/prot.24134.
Kim, S., 2001. International transmission of US monetary policy shocks: Evidence from VAR's. Journal of Monetary Economics, 48(2): 339-372. Available at: https://doi.org/10.1016/s0304-3932(01)00080-0.
Laih, Y.-W., 2014. Measuring rank correlation coefficients between financial time series: A GARCH-copula based sequence alignment algorithm. European Journal of Operational Research, 232(2): 375-382. Available at: https://doi.org/10.1016/j.ejor.2013.07.028.
Lambert, C., J. Campenhout, X. DeBolle and E. Depiereux, 2003. Review of common sequence alignment methods: Clues to enhance reliability. Current Genomics, 4(2): 131-146. Available at: https://doi.org/10.2174/1389202033350038.
Li, H., J. Ruan and R. Durbin, 2008. Mapping short DNA sequencing reads and calling variants using mapping quality scores. Genome Research, 18(11): 1851-1858. Available at: https://doi.org/10.1101/gr.078212.108.
Li, Y., C.J. Willer, J. Ding, P. Scheet and G.R. Abecasis, 2010. Mach: Using sequence and genotype data to estimate haplotypes and unobserved genotypes. Genetic Epidemiology, 34(8): 816-834. Available at: https://doi.org/10.1002/gepi.20533.
Mei, X.U., 2013. Empirical research of stock market volatility based on sequence alignment method. Journal of Wuhan University of Technology, 35(3): 404-408.
Mirarab, S., 2015. Novel scalable approaches for multiple sequence alignment and phylogenomic reconstruction. Doctoral Dissertation, PhD Thesis, University of Texas at Austin.
Mirarab, S., N. Nguyen, S. Guo, L.-S. Wang, J. Kim and T. Warnow, 2015. PASTA: Ultra-large multiple sequence alignment for nucleotide and amino-acid sequences. Journal of Computational Biology, 22(5): 377-386. Available at: https://doi.org/10.1089/cmb.2014.0156.
Needleman, S.B. and C.D. Wunsch, 1970. A general method applicable to the search for similarities in the amino acid sequence of two proteins. Journal of Molecular Biology, 48(3): 443-453. Available at: https://doi.org/10.1016/0022-2836(70)90057-4.
Nguyen, N.P., 2016. A perspective on 16S rRNA operational taxonomic unit clustering using sequence similarity. NPJ Biofilms and Microbiomes, 2(1): 16004-16004. Available at: https://doi.org/10.1038/npjbiofilms.2016.4.
Pearson, W.R. and D.J. Lipman, 1988. Improved tools for biological sequence comparison. Proceedings of the National Academy of Sciences, 85(8): 2444-2448. Available at: https://doi.org/10.1073/pnas.85.8.2444.
Pertsemlidis, A. and J.W. Fondon, 2001. Having a BLAST with bioinformatics (and avoiding BLASTphemy). Genome Biology, 2(10): 1-2002.2010.
Pevsner, J., 2005. Basic local alignment search tool (BLAST). Bioinformatics and functional genomics. John Wiley & Sons, Inc. pp: 87-125. Available at: http://dx.doi.org/10.1002/047145916x.ch4 .
Pevsner, J., 2009. Pairwise sequence alignment. London: Sequence Comparison, Springer. pp: 35-62.
Smith, T.F. and M.S. Waterman, 1981. Identification of common molecular subsequences. Journal of Molecular Biology, 147(1): 195–197. Available at: https://doi.org/10.1016/0022-2836(81)90087-5.
Sung, W.K., 2009. Algorithms in bioinformatics: A practical introduction. London, UK: Chapman & Hall/CRC Press.
Xu, X., 2010. Technical analysis model for stock market based on fuzzy candlesticks sequence alignment. Computer Applications & Software, 27(9): 28-32.
Yamada, K.D., K. Tomii and K. Katoh, 2016. Application of the MAFFT sequence alignment program to large data—reexamination of the usefulness of chained guide trees. Bioinformatics, 32(21): 3246-3251. Available at: https://doi.org/10.1093/bioinformatics/btw412.
Yamano, T., K. Sato, T. Kaizoji, J.-M. Rost and L. Pichl, 2008. Symbolic analysis of indicator time series by quantitative sequence alignment. Computational Statistics & Data Analysis, 53(2): 486-495. Available at: https://doi.org/10.1016/j.csda.2008.08.033.