


PERCEPTION DIFFERENCE OF INDIAN STUDENTS TOWARDS INFORMATION AND COMMUNICATION TECHNOLOGY IN CONTEXT OF UNIVERSITY AFFILIATION

1,3Department of Media and Educational Informatics, University of ELTE, Budapest, Hungary
2Department of Mathematics and Computer Science, Faculty of Education, Trnava University in Trnava, Trnava, Slovakia
ABSTRACT
This paper explores the perception of students towards ICT factors according to university affiliation status. The university affiliation status tells that whether participants come from government or private university. In this study significant difference has been discovered between perceptions of students of government and private universities towards ICT factors. The findings of paper explore the significant difference among students considering their affiliation status towards opportunity and solution factors only. To find mean difference among students towards ICT factors both T-test and Z-Test at 5% significant level are applied. These statistical tests proved university affiliation status has no impact on perception of Indian students. Five hundred fifty six students from six universities have been participated in this research study during the academic year 2015-2016.
Keywords:T-Test Z-Test Mean Factor Significant Degree of freedom.
ARTICLE HISTORY: Received:21 February 2018 Revised:2 April 2018 Accepted:4 April 2018 Published:6 April 2018.
Contribution/ Originality:The authors applied both T and Z-test on large samples from 6 universities from 2 states of India to investigate the perception of student towards ICT against university affiliation (private and government).
1. INTRODUCTION
Today’s information is the key to knowledge. Now days it is very easy for ordinary man to access global information with the initiation of Information Technology (IT). The Information includes fax-text, e-newspapers, video-images, mobile-voice, video conferencing and computer’s data. All the information can be digitized, transported, stored, retrieved, modified and then distributed (Siriginidi, 2009 ![]() ). ICT is the discipline of information handling and processing chiefly by computers used to sustain the communication of knowledge in technical, economic and social field. India is growing ICT country in the world. The growing technological enhancement increases the uses of internet in every domain. In the last few years, fast developments in information and communication technology such as the Internet have made significant and impressive impact on modern educational practice in India. The decisions have been taken by republic of India to integrate and assimilate technology in classroom teaching at all levels became much solid in the Indian higher education system after the introduction of smart classes. The huge effect about Internet technology requires individuals to be more creative rather than admit all situations without inquiring. India’s own satellite system providing round the clock multipurpose services, nearly 100% reach of radio, a satellite to cable and terrestrial system of television, with above 50 channels in different languages. ICT is essential to any higher education institution that hopes to succeed in a 21st century world driven by intense globalization. Ulka and Millind (2012
). ICT is the discipline of information handling and processing chiefly by computers used to sustain the communication of knowledge in technical, economic and social field. India is growing ICT country in the world. The growing technological enhancement increases the uses of internet in every domain. In the last few years, fast developments in information and communication technology such as the Internet have made significant and impressive impact on modern educational practice in India. The decisions have been taken by republic of India to integrate and assimilate technology in classroom teaching at all levels became much solid in the Indian higher education system after the introduction of smart classes. The huge effect about Internet technology requires individuals to be more creative rather than admit all situations without inquiring. India’s own satellite system providing round the clock multipurpose services, nearly 100% reach of radio, a satellite to cable and terrestrial system of television, with above 50 channels in different languages. ICT is essential to any higher education institution that hopes to succeed in a 21st century world driven by intense globalization. Ulka and Millind (2012 ![]() ) stated that higher education institutes in developed countries have policies on the productive function; there is matter of debate regarding stability of long-term academic research with short-term technology transfer projects. Philomina and Amutha (2015
) stated that higher education institutes in developed countries have policies on the productive function; there is matter of debate regarding stability of long-term academic research with short-term technology transfer projects. Philomina and Amutha (2015 ![]() ) concluded that science teachers are more aware about ICT as compare to arts teachers and they also found no significant difference between awareness of male and female teachers towards ICT. Govindarajan and Kannan (2014
) concluded that science teachers are more aware about ICT as compare to arts teachers and they also found no significant difference between awareness of male and female teachers towards ICT. Govindarajan and Kannan (2014 ![]() ) found that both student and teachers have high attitude and high competency towards ICT in relation to gender, locality, faculty, institutions type and educational qualification by applying descriptive analysis. Saima (2015
) found that both student and teachers have high attitude and high competency towards ICT in relation to gender, locality, faculty, institutions type and educational qualification by applying descriptive analysis. Saima (2015 ![]() ) have found significant difference between availability of equipment between public and private universities and also they have found there is no significant difference between the usage of information technology between public and private universities.
) have found significant difference between availability of equipment between public and private universities and also they have found there is no significant difference between the usage of information technology between public and private universities.
2. OBJECTIVE AND HYPOTHESES
The objective of the study is to find significant difference between the perception of Indian students towards the information and communication technology factors related to government and private institutions located in Haryana and Punjab. In order to achieve this objective one null and one alternate hypothesis is framed. The null hypothesis is labeled as H01: There is no significant difference between perception of government and private student towards information and communication technology. The alternate hypothesis is labeled as H01A: There is significant difference between perception of government and private student towards information and communication technology.
3. DESIGN AND METHDOLOGY
This paper focusing on analytical and quantitative approach with the use of stratified random sampling of more than 500 students. The authors used structured survey form to gather primary samples and applied item analysis test was performed to validate instrument. The research hypotheses were evaluated using Z-test and T-test using data analysis tools in MS-Excel. There are five factors were considered for ICT awareness and allocation of 35 independent variables to these factors. Out of 1100 respondent (teacher and students), only 560 students given their respond positively and we extracted only student’s data. The availability (Av) factor has 10 independent variables, usability (Us) has 8, problem (Pr) has 3, solution (Sn) has 5 and opportunity (Op) has 9 independent variables.
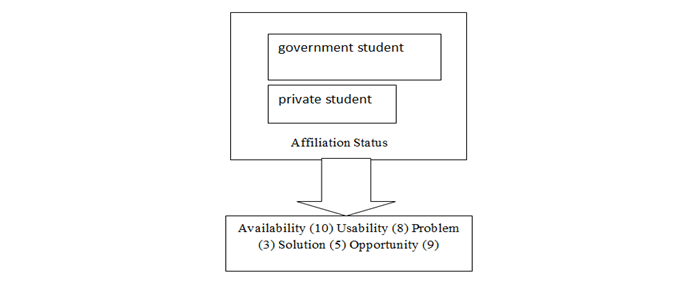
Fig-1. Variables Demography
Fig. 1 displays the graphical representation of variables and factors used. It shows the 2 dependent variables named government student and private student.
Table-1. Sample of students
Variable |
Frequency |
Percentage |
government student |
269 |
48% |
private student |
291 |
52% |
Data from Table 1 shows the population of participants involved. It displays that out of 560 faculty, 269 (48%) students from government Universities and 291 (52%) from private universities are involved.
4. ICT FACTORS ANALYSIS
This segment explores significant difference among student’s opinions for their university affiliation status such as government and private. To find mean difference between government and private student towards ICT factors (discussed above section 3), T-test and Z-Test at 5% significant level for different degree of freedom is applied. To find out significant difference between mean of Govt. student and private student, T-test at 5% level is applied for 18, 14, 04, 08 and 16 degree of freedom for availability, usability, problem, solution and opportunity respectively. We found calculated T-value and observed T-value at 5% significant level.
Table-2. Factor Mean Difference between government-private student using T-test
Factors T-Stat |
Av |
Us |
Pr |
Sn |
Op |
Calculated T-Value |
1.94 |
0.36 |
0.11 |
2.81 |
3.2 |
Observed T-Value |
2.1 |
2.14 |
2.77 |
2.3 |
2.11 |
Degree of Freedom |
18 |
14 |
4 |
8 |
16 |
Significant at 5% |
Not Significant at 5% Level |
Significant at 5% Level |
|||
Source: Availability (Av), Usability (Us), Problem (Pr), Solution (Sn), Opportunity (Op)
Data from Table 2 evident that calculated T-values are smaller than observed T-values for three factor named availability, usability, and Problem at 5% significant level for 18, 14 and 04 degree of freedom respectively. These values are not significant at 5 % level. Though, there is no mean difference between government student and private student for these factors. Hence, affiliation status of university or institutions did not affect opinions of students towards ICT availability (Av), usability (Us) and problem (Pr). According to Saima (2015 ![]() ) there is significant difference between public and private universities for availability of ICT equipment but no significant difference between them for usability. On another side, calculated T-value is greater than observed value for two factor named solution (Sn) and opportunity (Op) at 5% significant level for 08 and 16 degree of freedom respectively. These values are significant at 5 % level. Though, there is a mean difference between government student and private student for these factors. Hence, affiliation status of university or institutions has affected the opinions of students towards ICT solution (Sn) and opportunity (Op) factor.
) there is significant difference between public and private universities for availability of ICT equipment but no significant difference between them for usability. On another side, calculated T-value is greater than observed value for two factor named solution (Sn) and opportunity (Op) at 5% significant level for 08 and 16 degree of freedom respectively. These values are significant at 5 % level. Though, there is a mean difference between government student and private student for these factors. Hence, affiliation status of university or institutions has affected the opinions of students towards ICT solution (Sn) and opportunity (Op) factor.
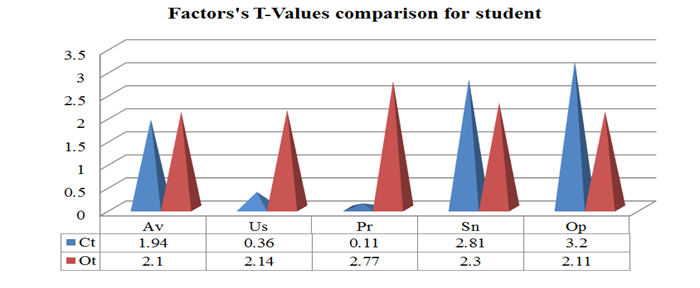
Fig-2. T-Values comparison of student for ICT Factors
Fig.2 shows that comparative chart of calculated t values (Ct) and observed t value (Ot) of ICT factors for stakeholders. For availability (Av), usability (Us) and problem (Pr) factor we can see that calculated t value is smaller than observed t value (Ct|<|Ot) which shows not significant at 5% level. But when we talk about solution (Sn) and opportunity (Op) factor, we found significant at 5% level due to greater calculated t-value from observed t-value (Ct|>|Ot). It can be concluded that affiliation status of university affected the opinions of students towards solution (Sn) and opportunity (Op), but in case of availability (Av), usability (Us) and problem (Pr) factor, opinions of stakeholders are identical almost.
The Z-test at 5 % significant level is applied to find mean difference between private and government student. Table 3 is showing the calculated Z- values of 269 government and 291 private student for five different ICT factors.
Table-3. Factor mean difference between government-private students using Z-test
Calculated Z-Value |
Observed Z-Value |
Significant at 5% Level |
|
Av |
2.02 |
Significant |
|
Us |
0.36 |
1.96 |
Not Significant |
Pr |
0.11 |
||
S |
2.52 |
Significant |
|
Opportunity |
3.21 |
Table 3 infers that calculated Z-values are smaller than the observed Z-value which is 1.96 at 5 % level of significant for only two factors named usability (Us) and problem (Pr). These values are found no significant at 5 % level. Hence, there is no mean difference between government student and private student towards these ICT factors. But for remaining three factors named availability (Av), solution (Sn) and opportunity (Op), the calculated Z-values are greater than the observed Z-value which is 1.96 at 5 % level. Hence, we found mean difference between private and government student towards these factors.
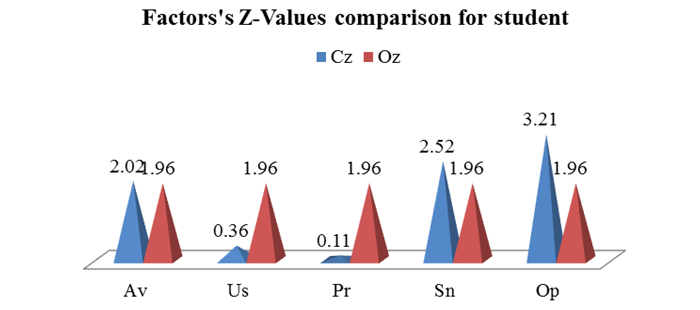
Fig-3. Z-Values comparison of student for ICT Factors.
Fig. 3 is s comparing the calculated z values (Cz) and observed z value (Oz) of ICT factors for student. For usability (Us) and problem (Pr) factor, the authors found no significant difference among students for their university affiliation status at 5% confidence level due calculated z value is smaller than the observed z value (Cz|<|Oz). But in case of availability (Av), solution (Sn) and opportunity (Op) factors, we found significant difference among students for their university affiliation status at 5% level, due to the greater calculated z-value from observed z-value (Cz|>|Oz). It is found that affiliation status of university influenced the opinions of students towards solution (Sn), availability (Av) and opportunity (Op).
5. TESTING OF HYPOTHESES
This section describes the evolution of our assumed two hypothesis using T-test, Z-test at 5% level of significant for 68 degree of freedom. For Null hypothesis H01 “There is no significant difference between perception of government and private student towards information and communication technology”, student T-test is applied at 5% confidence level.
Table-4. T-Test on H01 at 5% Significant Level
Variables T-static |
government student |
private Student |
Status at 5% Significant Level |
Mean |
3.65 |
3.58 |
|
Variance |
0.23 |
0.1 |
Failed to Reject |
Degree of Freedom |
68 |
||
Calculated T-Value |
0.74 |
||
Observed T-value |
2 |
||
Data from Table 4 infers that calculated T-value 0.74 is smaller than observed value 2.0 for 68 degree of freedom at 5% confidence level. It is not significant at 5% level of confidence which reveals that there is no significant mean difference between government student and private student towards ICT. Hence, our first null hypothesis H01 “There is no significant difference between perception of government and private student towards information and communication technology”, is failed to reject. It is concluded that there is no meaningful difference between opinions of government student and private student towards ICT. The findings of this test are supporting to the results of Luke (2015 ![]() ). Alternatively, hypothesis H01A “There is significant difference between perception of government and private student towards information and communication technology”, is failed to accept. Thus, university affiliation status has no impact on student’s perception towards ICT.
). Alternatively, hypothesis H01A “There is significant difference between perception of government and private student towards information and communication technology”, is failed to accept. Thus, university affiliation status has no impact on student’s perception towards ICT.
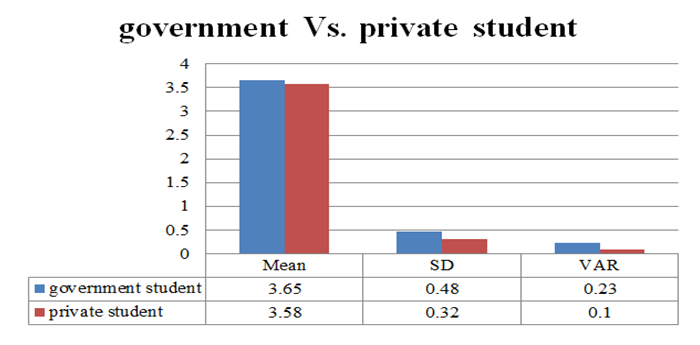
Fig-4. government Vs. private student towards ICT.
The Fig. 4 shows difference between the mean, standard deviation and variance of students towards ICT. The above chart shows that students from government Institutions have little bit more positive attitude towards ICT as compare to students of private institutions. The much scatteredness can be seen in responses of government students as compare to private students due higher SD (Standard Deviation).
The Z –test is also applied in order to test null hypothesis H01 “There is no significant difference between perception of government and private student towards information and communication technology”. The level of confidence of Z-test is 5% and degree of freedom is 68.
Table-5. Z-Test on H01 at 5% Significant Level
Variables T-static |
government student |
private student |
Status at 5% Significant Level |
Mean |
3.65 |
3.58 |
|
Known Variance |
0.23 |
0.1 |
Failed to Reject |
Calculated Z-Value |
0.73 |
||
Observed Z-value |
1.96 |
||
Above Table 5 evident that calculated Z-value 0.73 is smaller than observed value 1.96 at 5% confidence level. It is not significant at 5% level which shows that there is no significant mean difference between government student and private student towards ICT. Hence our first null hypothesis H01 “There is no significant difference between perception of government and private student towards information and communication technology”, is failed to reject. It is concluded that there is no meaningful difference between opinions of government student and private student towards ICT. The results are consistent with the findings of Sankar and Madhabananda (2012 ![]() ). The alternative hypothesis H01A “There is significant difference between perception of government and private student towards information and communication technology”, is failed to accept.
). The alternative hypothesis H01A “There is significant difference between perception of government and private student towards information and communication technology”, is failed to accept.
6. DELIMITATION OF STUDY
The present study is delimited to the only two states of India named Punjab and Haryana. The number of variables and factors are also limited. The authors are also confined to the statistical techniques like T-Test and Z-Test.
7. CONCLUSION
This paper explores the university’s affiliation status wise significant difference between students towards ICT factors. At one side, the university’s affiliation status did not affected mean difference between students towards availability (Av), usability (Us) and problem (Pr) factors but another side significant difference has been found between government and private student towards solution (Sn) and opportunity (Op) factor of ICT. The results of papers are opposite to the outcomes of Saima (2015 ![]() ). Overall testing of assumed null hypothesis is accepted (fail to rejected) by applied T-test and Z-test which reveals that university affiliation status did not influenced significant mean difference among students and faculty towards ICT. Further, it is also concluded that private students have higher level of perception towards information and technology as compare to government students in relation to university affiliation.
). Overall testing of assumed null hypothesis is accepted (fail to rejected) by applied T-test and Z-test which reveals that university affiliation status did not influenced significant mean difference among students and faculty towards ICT. Further, it is also concluded that private students have higher level of perception towards information and technology as compare to government students in relation to university affiliation.
| Funding: The authors have not received any funds for this research from any institutions. |
| Competing Interests: The authors declare that they have no competing interests. |
| Contributors/Acknowledgement: All authors contributed equally to the conception and design of the study. |
REFERENCES
Govindarajan, K. and C. Kannan, 2014. Competency and attitude towards ICT among student-teachers. International Journal of Informative & Futuristic Research, 1(11): 100-107.
Luke, O.O., 2015. Information and communication technology literacy skills and class instruction: A comprehensive perception survey of university of benin first year students. Nordic Journal of Information Literacy in Higher Education, 7(1): 63-79.View at Google Scholar | View at Publisher
Philomina, M.J. and S. Amutha, 2015. Information and communication technology awareness among teacher students and faculty. International Journal of Information and Education Technology, 6(8): 603-606.
Saima, Y., 2015. Comparative study of the availability and use of information technology in the subject of education in public and private Universities of Islamabad and Rawalpindi.Sage Open:1-17.
Sankar, P.M. and P. Madhabananda, 2012. Information and communication technology literacy among the higher secondary teachers in relation to their type of management and stream: An assessment. International Journal of Educational Research and Technology, 3(2): 119-124.View at Google Scholar
Siriginidi, S.R., 2009. Role of ICTS in India Rural Communities. Journal of Community Informatics, 5(1): 1-10.View at Google Scholar
Ulka, T. and J. Millind, 2012. Ict in higher education: Review of literature from the period 2004-2011. International Journal of Innovation, Management and Technology, 3(1): 20-23. View at Google Scholar