


STATE DIVESTITURES AND BANK PERFORMANCE: EMPIRICAL EVIDENCE FROM THE MIDDLE EAST AND NORTH AFRICA REGION

1,2 Department of Accounting and Finance, Faculty of Management Technology, German University in Cairo, Cairo , Egypt
ABSTRACT
The purpose of this study is to examine the relationship between privatization of state-owned banks and bank profitability, efficiency and risk in the MENA region using a sample of 36 privatized banks and 36 already private banks in eleven countries. With regards to the economic slowdowns and political instability in this region, the study results should be of interest to regulators, bank supervisors and policy makers studying the implications of bank reforms. Employing t-tests, country and time-fixed effects OLS regression and difference-in-differences analysis, the findings of this study conclude that banks in the MENA region have enhanced their cost efficiency and decreased their credit risk significantly after being privatized. Although, the study concludes that privatization improves bank cost efficiency and reduces risk, the effect on profitability remains inconsequential and debatable. This study proposes that bank privatization as a part of comprehensive reform programs should be supported in the MENA region to reduce the burden on state budget, and enhance managerial efficiency.
Keywords:Privatization, Banking, Emerging economies, DID analysis, Financial performance, Bank risk-taking, State-owned banks.
JEL Classification: G21, G34.
ARTICLE HISTORY: Received: 14 November 2017, Revised: 18 December 2017, Accepted: 22 December 2017, Published: 29 December 2017
Contribution/ Originality: This study uses new estimation methodology, the difference-in-differences (DID) analysis, to measure the effect of state divestitures on banking performance. Applying these exhaustive empirical methods result in: banks in the MENA region are able to meet benchmark performance by improving their cost efficiency and reducing risk of their loan losses.
1. INTRODUCTION
Bank privatization has become one of the most crucial elements in the structural reform agendas of many developing and developed countries (Carter, 2013). By 2003, over 250 commercial banks have been fully or partially privatized by governments of 59 countries, either publicly through a public offering of shares, or privately through an asset sale. There has been a relatively rapid transformation in the global banking system towards privatization of state-owned banks. The motives behind such transformation vary; for instance, bank privatization, could be a part of a government's ongoing efforts towards transitioning into a more market-based economic system, or could be a crucial element in plans to deregulate the financial system (Megginson, 2003). Similarly, Andrews (2005) proposes that governments sell their stake in banks when there is need for financial or operational restructuring to become competitive with privately owned banks. The bank privatization trend is obviously on the rise. Thus, it can be noted that many developing countries with the majority of banks being state-owned often suffer from inefficiency due to bureaucracy and political drives in the banking sector, which in turn affect bank performance. This has caused a burden on economic development for decades (Omran, 2007).
Developing countries are increasingly engaging in restructuring activities, reforms and divestiture of the shareholdings of state-owned banks in private and joint venture banks, despite the prevalence of government ownership in developing economies than in developed ones. For instance, official privatization committees have been formed in countries such as Iran and Jordan with an aim of ensuring that the privatization process is implemented within the proposed timelines (Clarke et al., 2003). Additionally, bank privatization has become a fundamental part of the economic reform plan in Egypt since 1991 (Omran, 2007). Therefore, privatizations have been observable in the MENA region, and the effect on banking performance can be studied to determine what conclusions can be drawn from these events. Nevertheless, since privatization entails full or partial transfer of public stake to the private sector, it could be useful to keep in check the ownership structure before and after privatization in order to calculate the post-privatization % change in state ownership. This could be an important factor affecting the strength of impact of privatization on the bank’s performance, thus would help in drawing conclusions and useful implications.
Extensive studies have focused on privatization of the non-financial state-owned enterprises (SOEs), while relatively, the privatization of state-owned banks remains insufficiently researched, and findings of prior research are still controversial. Moreover, after surveying the prior studies on privatization, it was found that examining this relationship in the MENA region remains scant. Therefore, this study addresses this research gap. First, it focuses on cross-country analysis in the MENA region. Subsequently, it contributes to the literature on privatization and banking performance in emerging countries, which have different characteristics from developed countries. Second, the results are expected to be different from previous studies on developed countries, since emerging countries in the MENA region are of distinct nature. Finally, privatization has serious implications for both banks and the government, which is covered in the following discussion. This stirs up an important question: Does privatization imply that state-owned banks suffer from poor performance? What is the impact of privatization on banking performance? To what extent does privatization affect bank performance?
The main shared characteristics of emerging countries mentioned in the literature are domination of bank financing, underdeveloped financial markets, inefficient capital markets, economic and political instability, high leverage ratios, ownership concentration, and family ownership domination (for instance Rwegasira (2000)). Moreover, in developing countries, banks represent the nerve of the financial system and dominate financial markets. Thus, banking sectors in developing countries have a significant role in providing finance, ensuring safety for depositors and enhancing economic growth (ElBannan, 2015). Therefore, the central motivation of this study is the reform and restructuring events in the MENA region, in particular, privatization of state-owned banks as a part of a comprehensive economic reform plan taking place in the MENA banking sectors. This study is motivated by the unique characteristics of the MENA countries and restructuring events in the banking sector. It aims as well to test their consequences on bank profitability, efficiency and risk taking.
This study contributes to the debate on the relationship between restructuring activities in the banking sector and bank performance in several important ways. First, the study includes most of the MENA countries and uses a large number of banks than used by other studies, such as Naceur et al. (2007) who focus on four MENA countries only. Second, to our knowledge, this is the first study that employs the Difference-in-Differences (DID) analysis, t-test and two-step regression to ensure the robustness of the study results. Whereas, effect of a treatment - privatization - is studied on an outcome by comparing average change in performance over time for the treatment group to the average change in performance over time for the control group. Third, while studies on these relationships are mostly individual country studies, for example, studies providing empirical evidence from Egypt (Omran, 2007) and Nigeria (Beck et al., 2005) or cross-country studies focusing on transition countries (Bonin et al., 2005; Fries et al., 2006) MENA region studies are scant. Little attention is paid to MENA countries despite a study for Boubakri et al. (2005) that uses a sample of 22 developed countries including six countries from the MENA region, six from Asia, eight from Latin America and two from Europe. Fourth, many studies examine the effect of ownership structure such as foreign, government, domestic ownership on bank performance in MENA region. (Kobeissi and Sun, 2010; Farazi et al., 2013) However, studies on bank privatization, as a reform and restructuring activity, are scarce. Notwithstanding the crucial role of banks in the MENA region, studying the consequences of privatization and reforms taking place in the banking sector have attracted little attention. Consequently, the findings of this study should be of interest to MENA countries regulators, researchers, bank supervisors and policy makers studying the implications of bank reforms.
The remainder of this paper is structured as follows. Section 2 reviews the relevant literature on the link between privatization and bank performance and an overview on the MENA economies, leading to the hypothesis development. Section 3 describes the sample and research methodology. Section 4 presents the empirical results. Finally, Section 5 concludes the paper.
2. BACKGROUND: AN OVERVIEW
2.1. Privatization Theories
The impact of privatization of state-owned banks on banking performance has been studied empirically in the literature. Privatization can be viewed through the lens of different theories. Herein below are major theories that explain privatization.
2.1.1. Contingency Theory
According to Negandhi and Reimann (1972) “The Contingency Theory of organizations holds that the optimum organization structure is primarily dependent on the external environment of the enterprise. Stable environmental conditions call for centralized structures, while a dynamic environment requires a decentralized structure.” Following Carter (2013) policy makers must interpret the environment correctly before deciding upon a privatization strategy. For instance, both internal and external factors constitute the critical environmental factors that are taken into consideration. Internal factors include culture, social standards, and resources. External factors include global competitions and geo-political coalitions. Such factors affect a country’s entire system – the economic, political, and social system. A privatization strategy should maintain a fit between a country’s system and environment. Following the Contingency Theory’s perspective, privatization effectiveness depends upon its ability to achieve the following: maintain a fit between the privatization program and country’s environment; maintain a fit among the country’s subsystems; solve conflicts arising on account of such privatization program. Nevertheless, the uniqueness of each country’s environment has an impact on the overall effectiveness of a privatization program and implementation success. According to the World Bank, European transition economies and developing economies should place more emphasis on achieving a stronger fit than in developed countries. This proposes an implication that the relation between privatization and performance in MENA where developing countries are predominant requires application of stricter conditions and controls in order to achieve positive bank performance.
2.1.2. Institutional Theory
Following Carter (2013) this theory views large autonomous structures (government agencies, organizations, countries) as rational autonomous actors, who legitimize and institutionalize decisions in order to fit in with their environment. Such actors are directed by social structures – law, culture, and norms. For example, they may take decisions related to structural reform plans (privatization program) in response to competitive pressure. They would shape the public’s understanding of decisions and alternatives, for example: through new regulatory agencies. The Institutional Theory suggests that policy makers in the case of privatization, guided by social structures, correct market failures through privatization programs, while taking into consideration the country’s history and culture. For example, the Chinese government introduced specific capitalist market-based enterprises as means to liberalize the market and correct market failures, whilst preserving the socialist institutions in order to protect their power, legitimacy, and authority. Furthermore, privatization programs could be implemented in phases. As success is witnessed after a phase, implementation continues; while if failure at one stage occurs, other alternatives could be considered – such as: partial privatization and regulations. Severe failure at one stage could also lead to radical alternatives such as nationalization. An efficient institutional system and regulatory framework is critical to the success of privatization. Finally, as a result of transferring rigid state-owned structures into more liberated private structures, uncertainty may arise. In case of uncertainty, countries may use successful privatization models applied in other countries as reference for their own application, or even imitate such successful models.
2.1.3. Agency Theory
The Agency Theory proposes that there is asymmetrical information between the principal and agent, which leads to a principal-agent problem called the agency problem. The agency problem also arises in cases of privatization. For instance, the government should write complete contracts (laws and regulations) to protect public interest and prevent privatized firms from exploiting the public to fulfill their own objectives. For each privatization deal, contracts should be enforced and followed. Following Carter (2013) the agency theory also suggests that individuals are risk-averse, inferring that effective monitoring and control mechanisms would restrain privatized firms from engaging in opportunistic behaviors, as strict laws and regulations would otherwise expose such firms to high risks and costs.
In this research, the prior theories are used as the underlying theories to examine the main relationship between privatization and bank performance. The three theories agree on a uniform hypothesis: privatization enhances banking performance. Nevertheless, each theory states a different condition that would entail a success privatization program. These conditions are then used to evaluate and assess the degree of success of the privatization programs taking place in the MENA region. For instance, the contingency theory suggests that in order to reap the benefits of privatization, the privatization program should be compatible the internal and external environment. The institutional theory suggests that privatization, with some degree of government control maintained, could have a positive effect on banking performance. It also proposes that privatization programs should be applied in phases. As for the agency theory, it suggests that law and regulations must have a monitory role in order to allow privatization to be beneficial rather than exploitive. Therefore, this study aims at testing whether the hypotheses of such theories will be supported or falsified. The main hypothesis proposes that, a privatization program which is well-monitored, properly applied, and is contingent with environmental factors, will positively affect the performance of the banking institution.
2.2. Privatization and Banking Performance
The literature on privatization has been scanned with the purpose of creating a foundation for hypotheses development and formulating a theoretical background for this research. A study conducted by Rumler and Waschiczek (2012) examined the effect of changes in the bank financial structure on profitability in the banking sector of Austria. Changes in financial structure include disintermediation, market concentration, privatization, and foreign ownership. Using Ordinary Least Squares (OLS) regression analysis to measure the effect of such financial structure reforms on bank profitability, the following was found. First, disintermediation and higher market concentration led to a positive effect on profitability. Second, privatization and foreign ownership did not have a clear or significant effect on bank profitability. Similarly, Choi and Hasan (2011) found that the effect of privatization on bank performance as a whole had no clear result. For instance, bank performance improved the first year of being privatized, and then a gradual decline in performance has been witnessed. Eventually, performance improved again. Although, this study used the same method as Rumler and Waschiczek (2012) to measure the relationship between the independent and dependent variable, Choi and Hasan (2011) relied on international evidence rather than on one country, in this case, Austria.
Megginson (2003) also agrees that increased private ownership reaps more benefits in terms of bank performance. For instance, this qualitative study examined the effect of privatization of state-owned banks on performance of banks all over the world. Although the study by Megginson (2003) was theoretical and used no quantitative methods to measure this relationship, findings were found to be supporting privatization. In other words, a positive relationship between privatization and bank performance was found. However, it was concluded that although privatized banks have better performance and efficiency in comparison with state-owned banks, privatization alone does not seem to be the only factor to ensure success (especially if the bank is partially privatized). It was found that some pre-conditions should be met for privatization programs to be successful. Andrews (2005) also agrees that for successful privatization to take place, certain conditions set pre-privatization should be taken into consideration. The qualitative study conducted by Andrews (2005) aims to provide guidance for policy makers regarding how bank privatization can affect performance, specifically post-banking crisis. Therefore, it focused on privatization that follows a banking crisis.
Furthermore, studies by Tochkov and Nenovsky (2011) and Kraft et al. (2006) used similar methods (Stochastic frontier model) to measure the effect of privatization on bank efficiency. Both studies also measure cost efficiency to indicate the bank efficiency, thus it is expected that their results would be similar. On the contrary, findings were different. Tochkov and Nenovsky (2011) found that banking reforms (including privatization) had an adverse effect on efficiency, while Kraft et al. (2006) found that privatization seemed to have no immediate significant effect on bank efficiency. The difference in findings could be due to the fact that both studies focused on different countries and time periods. For instance, Tochkov and Nenovsky (2011) focused on the Austrian banking sector over the period 1999-2007, and also took into consideration EU accession and other institutional reforms. Nevertheless, Kraft et al. (2006) focused on the Croatian banking sector over the period 1994-2000, and also took into consideration foreign bank entry. Similarly, Karas et al. (2010) used the same methods and measures to study the effect of privatization on bank efficiency; however, their results showed a negative relationship between privatization and bank efficiency. Still, it is noteworthy that this study focuses on the Russian banking sector, and uses years 2002 and 2006 as two points for comparing the effect of privatization.
Another study also examining the effect of privatization on bank efficiency (measured by profit and cost efficiency) was carried out by Bonin et al. (2004) with focus on transition countries. The transition countries studied were: Bulgaria, the Czech Republic, Croatia, Hungary, Poland, and Romania. Results were found to be positive, indicating that privatized banks improve profit and cost efficiency. A positive relationship was especially found when privatized banks had foreign ownership as part of their ownership structure.
Furthermore, the study conducted by Farabullini and Hester (2001) examined the effect of privatization on recently privatized Italian banks’ performance. To study the effect on performance, the following was measured: Changes in organizational structure (number and composition of staff, as well as number and importance of domestic branches); Turnover of top managers and membership of boards of directors; Profitability indicators (ROA, ROE, Losses on loans, Staff costs, Non-interest income); Efficiency indicators (Ratios per employee, Securitization). Findings of the study concluded that recently after privatization, turnover has increased, and branch expansion slowed down. However, positive effect on profitability, income growth, securitization, and innovation was found. Thus, it could be concluded that there is a positive relationship established between privatization and operating performance.
Likewise, another study by Fiorentino et al. (2009) examined the effect of privatization and consolidation on bank productivity comparatively between Germany and Italy. Similar to results founded by Farabullini and Hester (2001) a positive relationship between privatization and productivity was established. Privatized banks witnessed a significant increase in productivity, especially when they merged with other banks as well. It was also found that German banks were able to increase their productivity through consolidation.
In addition, three studies were conducted by Fahim and Siddiqui (2013); Shoaib and Iqbal (2012) and Ilyas et al. (2012) to examine the impact of privatization on banking performance in Pakistan. While Shoaib and Iqbal (2012) and Ilyas et al. (2012) focus on two major privatized banks in Pakistan – Habib Bank Ltd and United Bank Ltd, Fahim and Siddiqui (2013) focus only on the individual case of Habib Bank Ltd. Moreover, Fahim and Siddiqui (2013) additionally used corporate governance as a performance measure. The three studies argue that privatization is associated with positive bank performance. Shoaib and Iqbal (2012) argue that United Bank Ltd performed better than Habib Bank Ltd whatsoever, especially in the Earning Assets to Total Assets Ratio which was lower after privatization in Habib Bank (indicating decreased efficiency to a certain extent). On the contrary, paired t-test results of Ilyas et al. (2012) show that Habib Bank Ltd is performing better after privatization in comparison with United Bank Ltd.
Another study by Ghosh (2010) investigated the effect of privatization on the Indian banking sector. Diverse financial measures were used in the study for the measurement of performance, including: ROA to measure profitability, NIM to measure economic efficiency, Non-performing loans to total loan ratio (NPL) to measure bank risk, and capital adequacy ratio (CAR) to measure bank soundness. The main finding of this study is that there is a positive relationship between privatization and bank performance. It was found that partially privatized banks had a significant superiority in terms of profitability over fully state-owned banks. Additionally, it is concluded that profitability, efficiency, and bank soundness were enhanced after privatization; and bank risk decreased as a result (although over a longer time period). In the same vein, Kamaly et al. (2015) also found positive results with regards to effect of privatization on profitability, efficiency, liquidity, and banking effectiveness in the Egyptian banking sector. Likewise, Boubakri et al. (2005) test the performance of privatized banks in a sample of 22 developing countries and find evidence that privatized banks have lower economic efficiency, lower solvency than government owned banks, and profitability increases in post-privatization period. Regarding the MENA region, Naceur et al. (2007) argue that privatized banks experience an increase in profitability and operating efficiency, and decreases in employment and leverage in four MENA countries; Tunisia, Turkey, Egypt and Morocco. Moreover, Omran (2007) also agrees with Choi and Hasan (2011) and Rumler and Waschiczek (2012) that no solid findings on the effect of privatization on bank performance were concluded, although Omran (2007) showcases evidence to support privatization. This study focused on studying the impact of privatization of state-owned banks on Egyptian banks’ financial and operational performance. Findings indicated that profitability and liquidity ratios for privatized banks declined noticeably, while other performance measures relatively remained the same after privatization. However, it was found that privatized banks performed better than mixed banks. In spite of these findings, the study found strong evidence to support that banks with greater private ownership perform better than those with less or only partial private ownership.
The MENA region has distinct characteristics that differentiate it from other developing and developed countries. The banking sectors of MENA countries are highly concentrated and have unique ownership structure and growth potential and is highly monopolistically competitive (Turk-Ariss, 2009). High bank concentration is associated with low insolvency risk and credit risk as measured by loan loss provisions in the Egyptian banking sector during the period 2005-2011 (ElBannan, 2015). Accordingly, testing the relationship between privatization and performance in these developing countries is interesting to explore, if the results will remain the same as for the developed ones.
2.3. MENA Region Economic Indicators: An Overview
Financial sectors in the MENA countries are still underdeveloped and in the early phases of economic development. Capital markets are underdeveloped and financial markets are dominated by banks as the main financial institution and providers of credit to private and public investments (Turk-Ariss, 2009). According to the World Bank report on recent economic developments and prospects as of 2016, the MENA region is facing economic and political instability, in addition to low oil prices that challenges the oil importers. Furthermore, the civil war in Syria, Iraq, Libya and Yemen and the refugee crisis is affecting the neighboring countries. Also, the unemployment rate is high in Egypt, Iran, Iraq, Jordan, Morocco and Tunisia in 2016. However, governments in the region are looking for remedies, reforms and diversification in their economies. World Bank report reflects expectations of improvements in the regional growth over the next two years. Table (1) shows the main economic development indicators in the region to shed the light on the economic conditions in the region.
Table-1. MENA region development indicators
| Indicator | 2007 |
2008 |
2009 |
2010 |
2011 |
2012 |
2013 |
2014 |
2015 |
| Unemployment | 10.33 |
9.92 |
10.09 |
10.38 |
11.21 |
11.30 |
11.20 |
11.26 |
|
| GDP growth % | 6.15 |
5.023 |
1.574 |
5.105 |
3.710 |
3.1476 |
2.651 |
3.030 |
3.086 |
| Inflation % | 6.39 |
15.318 |
-4.365 |
10.559 |
13.591 |
4.193 |
1.860 |
1.111 |
-0.998 |
| Exports (% of GDP) | 49.49 |
51.335 |
43.127 |
45.433 |
49.301 |
49.335 |
48.508 |
45.777 |
44.921 |
| Imports (% of GDP) | 37.44 |
38.304 |
38.576 |
36.442 |
35.115 |
36.473 |
35.638 |
36.206 |
43.289 |
| Credit (% of GDP) | 44.22 |
39.539 |
49.949 |
48.082 |
46.082 |
46.101 |
47.387 |
53.214 |
69.430 |
| Foreign direct investment mill. US$ | 126,453 |
114,355 |
83,675 |
86,092 |
62,774 |
61,339 |
58,598 |
52,024 |
51,136 |
| Bank capital to assets % | 9.6 |
8.5 |
10.0 |
10.8 |
10.8 |
10.01 |
10.3 |
9.6 |
|
| Bank nonperforming loans to gross loans% | 3.95 |
4.2 |
5.5 |
5.1 |
4.9 |
5.2 |
5.6 |
4.6 |
3.4 |
Note: the table presents total unemployment as a % of total labor force, GDP Growth in percentage, annual inflation GDP deflator, exports and imports of goods and services as percentage of GDP, Domestic credit provided by financial sector as a percentage of GDP, Foreign direct investment net inflows in US $, ratio of bank capital to total assets, and ratio of nonperforming loans to gross loans. Data compiled by authors from the World Bank's World development indicators database.
In Table (1), the GDP growth is decreasing from 6.15% in year 2007 to 3.08% in year 2015, and unemployment rate has increased by 9% from year 2007 to 2014. The exports of goods and services of the MENA region as percentage of GDP are on average 47%, while the average imports are 37%. The credit provided by the financial sector is high as a percentage of the GDP, which indicates that the financial sector plays a critical role in the MENA economies. Moreover, the foreign direct investments have been dropped by $75,317million from 2007 to 2015, indicating a decrease of 60% in the foreign direct investments to the MENA economy.
Regarding privatization transactions, the World Bank reported that 7 % of total value of privatization transactions in developing countries is in the MENA region in the period 2000-2008, whereas Egypt and Morocco, account for more than 60 % of the total value and number of privatization transactions. However, privatization activity in the Middle East rises significantly in years after 2008.
From the above discussion, it could be concluded that the MENA countries are still undeveloped and their economies are fragile and instable, however, their governments are undertaking economic reform plans in different sectors in attempt to remedy the problems in their economies. As bank privatization is a restructuring activity that aims to develop the banking sector, therefore, it is important to test its impact on the banking sector performance in terms of profitability, efficiency and bank risk.
2.4. Research Hypotheses
The objective of this research is to examine the impact of privatization of state-owned banks on banking performance in the MENA region. The study tests the applicability and extent of usability of the theories on privatization especially in the MENA region, through conducting a methodology to test the relationship between the independent variable (privatization) and dependent variable (bank performance). This is in order to ultimately come up with conclusions on whether or not privatization is an appropriate bank reform tool, which can help improve the banking sector in the region. Accordingly, the research question for which the study is seeking an answer is, what the impact of privatization of state-owned banks is on banking performance in the MENA region. In this study, bank performance is divided into: profitability (Return on Average Assets (ROAA), Return on Average Equity (ROAE), Net Interest Margin (NIM)); cost efficiency (Cost to Income); and bank risk (Provisions for Loan Losses Ratio, which also measures asset quality). Relying on the above discussion on the association between privatization and bank performance and the overview on the economic conditions and indicators of the MENA region, it could be hypothesized that privatization is a restructuring activity that aims to reform the banking sectors in the MENA region and used as a mean of remedy of the banking sectors’ problems. In particular, the banking sectors in the MENA region represent the nerve of their economies and ensuring the soundness of this sector is important for economic development. Therefore, we hypothesize the following three main hypotheses:
H1: Bank profitability is positively associated with privatization of state-owned banks.
H2: Bank cost efficiency is positively associated with privatization of state-owned banks. (Whereas, improved cost efficiency is equal to decreased cost to income ratio)
H3: Bank risk is negatively associated with privatization of state-owned banks.
3. EMPIRICAL ANALYSIS
In this section, the impact of privatization of state-owned banks on banking performance in the MENA region is analyzed empirically.
3.1. Sample and Data Collection
In this section, sample and data collection are described, followed by a description of the primary group sample of privatized banks, definition and explanation of variables, and sign expectations.
3.1.1. Sample Construction
This study examines the performance of 36 privatized banks (treated) and 36 already private banks (untreated) over a 6-year time period in the following MENA countries: Egypt, Tunisia, Morocco, Kuwait, Iran, Bahrain, Oman, Jordan, Lebanon, Algeria, and Libya; where bank privatization date takes place during a time period from 1994 to 2012. This sums up to 72 banks used in the sample to form a total of 432 bank-year observations. Thus, the study involves a panel data set, albeit a small sample due to difficulties in obtaining cross-country bank financial data before 1994 as well as considerable missing data during the study time period itself. That leads to the exclusion of several bank privatizations. To define bank privatization, this study takes into account a transfer of ownership that reduces the state’s share, regardless the magnitude of the change in state ownership. This is in order to widen the sample scope to take into account a greater number of banks. Nevertheless, a variable is included to measure the change in state ownership after privatization, in order to include the strength or the extent of privatization in each bank case. Firstly, to indicate if a bank has been privatized, data on privatization was obtained from the following sources: mainly the World Bank Privatization Database, Megginson (2003) in addition to the Bloomberg Database and official websites of the banks. Bank financial data was obtained from the Bankscope Database. In addition to change in state ownership after privatization, information on the method of privatization (joint venture, divestiture, stake purchase, initial public offering, or acquisition) was also collected. Data was primarily collected on privatized banks ‘treatment group’, followed by a similar data collection for private banks ‘control group’ to conduct a DID analysis, thus two data sets were used in the step involving DID analysis. To be included in the study sample, banks should be privatized during the period 1994 – 2012, and banks with missing data are excluded from our sample. Initially, 52 privatized banks were found, and eventually this sample was narrowed down to 36 privatized banks as 16 banks are found to have many missing data that disqualifies them from being included in the data analysis. The first data set consisting of privatized banks – the treatment group, comprises of 216 bank-year observations as follows: 36 banks over a 6 year time period – 3 years before privatization and 3 years after privatization (with exclusion of year 0 – the year of privatization, as it is a transition year including both the private and public ownership phases of the bank). This group is referred to as the “privatized banks” group throughout the rest of the study. The second data set comprising the banks that are already private and untreated (not exposed to privatization) - the control group, comprises of 216 bank-year observations as well. This group is referred to as the “already private banks” group throughout the rest of the study.
Table-2. Bank privatization across data
| Bank Name | Country |
Year of Privatization |
% Decrease in State Ownership |
Method of Privatization |
| Banque Du Caire | Egypt |
2004 |
35 |
|
| Commercial International Bank (CIB) | Egypt |
2006 |
19 |
Joint Venture |
| Bank of Alexandria | Egypt |
2006 |
80 |
Divestiture |
| Bank Audi SAE | Egypt |
2006 |
39 |
Joint Venture |
| Ahli United Bank | Egypt |
2006 |
19 |
Joint Venture |
| Credit Agricole Egypt SAE | Egypt |
2006 |
34 |
Joint Venture/Merger |
| Al Baraka Bank SAE | Egypt |
2008 |
3 |
Stake in Joint Venture |
| Piraues Bank | Egypt |
2005 |
69 |
Stake Purchase |
| Arab African International Bank | Egypt |
2005 |
100 |
|
| Union National Bank | Egypt |
2006 |
50 |
Joint Venture |
| Misr Exterior Bank (BanqueMisr now) | Egypt |
1997 |
39 |
|
| Misr International Bank | Egypt |
1997 |
20 |
|
| National Bank for Development | Egypt |
1998 |
26 |
|
| National Societe General (NSGB) | Egypt |
1997 |
11 |
|
| Cairo Barclays Bank | Egypt |
2004 |
100 |
|
| Attijari Bank | Tunisia |
2005 |
54 |
|
| Banque Tuniso-Koweitienne | Tunisia |
2008 |
30 |
Sale of Shares |
| Société Tunisienne d'Assurances et de Réasssurances | Tunisia |
2008 |
35 |
Sale of Stake |
| Banque Central Populaire | Morocco |
2004 |
20 |
|
| Kuwait Finance House | Kuwait |
2004 |
25 |
Sale of Stake |
| Bank Mellat | Iran |
2009 |
5 |
Sale of Stake |
| Bank Tejarat | Iran |
2009 |
51 |
|
| Bank Saderat Iran | Iran |
2009 |
51 |
|
| Kuwait Finance House - Bahrain | Bahrain |
2004 |
25 |
|
| Gulf Finance House BSC | Bahrain |
2006 |
N/A |
|
| Bahrain Islamic Bank B.S.C | Bahrain |
2005 |
26 |
Acquisition |
| Al Baraka Banking Group | Bahrain |
2006 |
30 |
IPO |
| Bank Muscat SAOG | Oman |
2004 |
N/A |
Sale of Stake/Merger |
| Cairo Amman Bank | Jordan |
1999 |
81 |
|
| Burgan Bank | Kuwait |
1997 |
34 |
Asset sale and SIP |
| EQDOM – Societe d'Equipement Domestique et Menager | Morocco |
2002 |
18 |
SIP |
| Credit Libanais | Lebanon |
1997 |
97 |
|
| Credit Populaire d'Algerie | Algeria |
2006 |
51 |
Majority Stake |
| Wahda Bank | Libya |
2008 |
19 |
|
| Sahara Bank | Libya |
2007 |
19 |
Divestiture |
| Union Internationale de Banques | Tunisia |
2002 |
52 |
Divestiture |
Note: privatization data used in the study and compiled by authors.
The already private banks were chosen randomly, with the following set criteria: not privatized, similar characteristics to the private banks group, data collected for the same time frame and selected MENA countries. The rationale behind including the control group of already private banks is to be used in DID analysis, which is the final step in the methodology. In this work, DID analysis is used to calculate the difference in performance between the privatized banks (treated) and already private banks (untreated or control) year-by-year in order to generate a new ‘difference’ variable in the DID analysis for each existing variable. The sample of private banks have not been exposed to state divestitures, in order to fairly represent the benchmark performance. The whole results of our DID analysis depend on calculating this difference between actual and benchmark performance, then we repeat all empirical tests on this difference group as a robustness check. Hence, the inclusion of the control group in the DID analysis determines the deviation from expected performance, as a base for the subsequent empirical tests.
These difference variables are will then used in this methodological step, and are referred to in the rest of the study as the “difference” group. Also, T-tests and regressions are applied to the difference group. Table (2) shows the privatized banks used in the study (the primary group), the country in MENA where the bank operates, year of privatization, the percentage decrease in state ownership as a result of the bank privatization (taken at the year of privatization itself), and the method of privatization. However, percentage decrease in State Ownership was not included as a control in this study, because it had to be excluded due to its high correlation with the privatization dummy.
3.1.2. Bank Performance and Control Measures
The main explanatory variable (independent variable) used in this study is bank privatization, measured by a dummy variable. Many variables are used in this study to proxy for accounting and financial performance measures in order to allow for comparison of pre- and post- privatization performance. Also, various control variables are used to examine their effect on bank performance as a dependent variable. Table (3), illustrates the variables used in this study:
Table-3. Variables Definition
| Variable | Symbol | Measurement | Variable Type | Expected Sign |
| Return on Average Equity | ROAE | Net Income/Total Equity | Dependent | + |
| Return on Average Assets | ROAA | Net Income/Total Assets | Dependent | + |
| Net Interest Margin | NIM | Net Interest Income/Total Assets | Dependent | + |
| Cost To Income Ratio | CTI | Total Cost/Total Income | Dependent | - |
| Provisions for Loan Losses Ratio | PLL | Provisions for Loan Losses/Net Interest Revenue | Dependent | - |
| Privatization Dummy | pdummy | Takes ‘1’ after privatization, otherwise‘0’ | Main Explanatory | |
| Reserves for Loan Losses Ratio | RLL | Reserves for Loan Losses/Gross Loans | Control | - |
| Impaired Loans Ratio | IL | Impaired Loans/Gross Loans | Control | - |
| Asset Composition Ratio/ Tangibility Ratio | FAtoTA | Fixed Assets/Total Assets | Control | + |
| Log of Total Assets (Bank Size) | logTA | Log(Total Assets) | Control | + |
| Time Fixed Effect | Fixed time parameter at i=1…n | Control | ||
| Country Fixed Effect | Fixed country parameter at i=1…n | Control |
Note: The table presents the definition and measure for all the study variables.
As shown in Table (3), the variables included comprise different performance indicators. For the profitability indicator - ROAE, ROAA, and NIM are used. For the cost efficiency, CTI is used. For bank risk and asset quality (mainly loan quality) - PLL, RLL, and IL are used. To control for bank size across the study time period, Log of Total Assets (in USD) is used. To measure asset composition - FAtoTA was used. The study uses country and time fixed effects to control unobserved heterogeneity across years and countries. Thus, it absorbs the effects particular to each country, as banks are located in different countries in MENA. The study controls for time as it assumes unexpected variation or special events may affect the outcome variables as a result of variation in bank years. The fixed effects model is a powerful tool to eliminate omitted variable bias.
3.2. Methodology
The study conducts quantitative analysis to test our hypotheses that privatization enhances banking cost efficiency and profitability. The empirical tests were carried out over three stages; the descriptive and T-test analysis, OLS regression with country- and time-fixed effects, and difference-in-differences analysis.
First, Descriptive and T-Test analysis, the descriptive statistics were first generated to describe and analyze the sample, as reported in Table (4), followed by a t-test by privatization dummy on each of the means of the following variables: ROAE, ROAA, NIM, CTI, PLL, RLL, IL, logTA and FAtoTA. Each bank receives a pdummy = 1 after it gets privatized, and pdummy = 0 before it gets privatized. As indicated, the minimum time interval for each bank is 6 years (t = -1, -2, -3, +1, +2, +3), excluding the year of privatization (year 0). Thus, a two-sample paired t-test with equal variances was conducted on the privatized bank group to test the null hypothesis that the cross-sectional mean performance changes are equal to zero. This is tested against the main study proposition where the alternate hypothesis states that the mean post-privatization performance is better than the mean pre-privatization performance, such that there are greater post-privatization means in case of ROAA, ROAE, NIM, logTA, FAtoTA; and lower post-privatization means in case of CTI, PLL, RLL, and IL. The test hypotheses are outlined in the t-test results shown in Table (5).
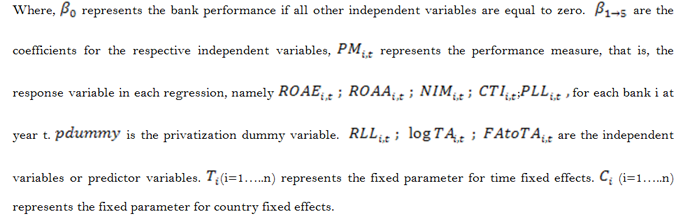
Second, Regression Analysis, where OLS regression is used with country and time fixed effects. A performance indicator is regressed on the main explanatory variable ‘privatization dummy’ as well as a set of control variables. First, a standard OLS (Ordinary Least Squares) regression was run on the privatized bank group, using country and time fixed effects. The following general model is thus estimated:
General Model (1)
![]()
i = entity; t = time
Third, Difference-in-differences (DID) Analysis, where this step is conducted as a robustness check for further validation of results, where the research design and observational study data are mimicked. In this step, we compare the privatized group with a control group consisting of private banks. The rationale behind using private banks as the control group is that these private banks have not been subject to state divestitures, and are used as the benchmark performance, which is the performance we expect our privatized banks to conform to after being privatized. The actual performance of the privatized banks sample is thus compared with a benchmark performance, that is, the private banks. These differences in performance between actual performance and benchmark performance formulate our ‘difference’ group.
The DID analysis starts with studying the effect of privatization on the performance variables by comparing average change in performance over time for the treatment group to the average change in performance over time for the control group. Same assumptions of OLS apply to DID. For each privatized bank, year by year, we compare performance 3 years before privatization with performance of the control group 3 years before privatization – the same comparison is repeated for the 3-years period after privatization. T-test as described in step (i) and regression analysis as described in step (ii) is then repeated on the basis of difference to control group – that is, tests are done on the generated ‘difference’ variables. The difference is calculated, such that:
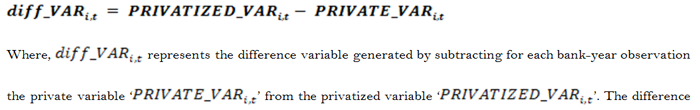
is calculated for all variables in the study; ROAE, ROAA, NIM, CTI, PLL, RLL, IL, logTA, FAtoTA. Privatized controls are used for the country and time fixed effects for the regression done in the DID analysis.
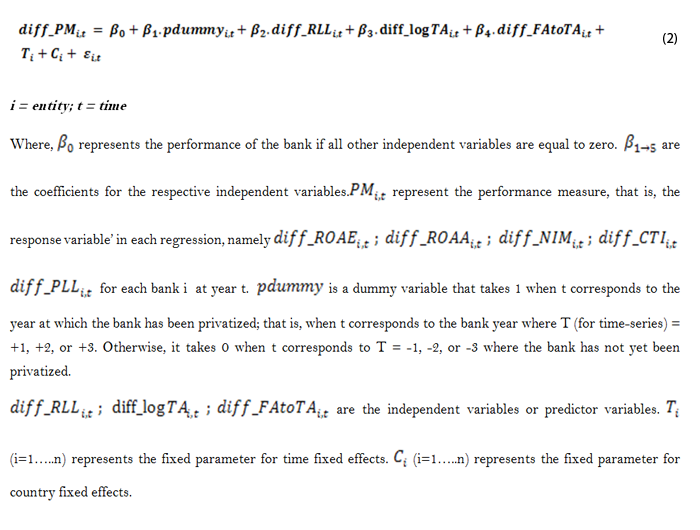
The same model for the DID analysis is used as for the analysis on privatized banks group in step (ii). The only difference is that the new variables, the ‘difference’ variables are used. Throughout the rest of the study, they are referred to as diff_ROAE, diff_ROAA, diff_NIM, diff_CTI, diff_PLL, diff_RLL, diff_IL, diff_logTA, diff_FAtoTA. The following general model is thus estimated:
General Model (2)
3.3. Econometric Models
The study presents two main models to estimate the main relationship between privatization and bank performance. The models are presented below and definitions of all variables used in the study are shown in Table (3).
Model (1):
The following models are used to estimate the coefficients of the ‘Privatized’ group.

4. EMPIRICAL RESULTS
The descriptive analysis of the study sample is displayed in Table (4). The central tendency measures are included to show the most extreme values, the minimum and maximum, standard deviation, skewness, kurtosis…etc. On average, the means for the variables are different from the medians, suggesting that the distribution is asymmetric. This suspicion is confirmed by the small positive skewness (mean is skewed to the right of the median) in NIM, CTI, PLL, RLL, IL, logTA, and FAtoTA ratios; which shows that the respective variables have a long right tail. That is, the distribution is asymmetric, with some distant values in a positive direction from the center of the distribution. On the other hand, two variables, namely ROAA and ROAE, have a negative skewness (mean is skewed to the left of the median), which shows that both variables have a long left tail, and also indicates asymmetric distribution due to some distant values lying in a negative direction from the center of the distribution. Therefore, it can be suggested that standard deviation is inflated to a point where it is no longer useful as a measure of the spread of data values. Data normalization allows for symmetric (normal) distribution of data values in order to make statistical procedures for quantitative data more reliable.
Table-4. Summary statistics
| Stats | ROAE |
ROAA |
NIM |
CTI |
PLL |
RLL |
IL |
logTA |
FAtoTA |
ChangeSO |
| Mean | 12.059 |
1.603 |
3.485 |
53.48 |
48.781 |
10.944 |
12.275 |
9.232 |
.0189 |
-18.96 |
| Median | 12.99 |
1.075 |
2.83 |
48.94 |
28.22 |
7.8 |
7.41 |
9.16672 |
.0133 |
0 |
| SD | 20.99 |
3.763 |
4.115 |
22.623 |
99.87 |
10.75 |
15.080 |
0.9075 |
0.0168 |
26.93 |
| Variance | 440.85 |
14.161 |
16.93 |
511.80 |
9975.7 |
115.64 |
227.43 |
0.823 |
0.0002 |
725.57 |
| Skewness | -5.784 |
-1.221 |
3.898 |
1.4780 |
4.417 |
2.76 |
3.097 |
1.527 |
2.717 |
-1.505 |
| Kurtosis | 54.72 |
29.806 |
22.214 |
7.328 |
26.588 |
13.273 |
13.624 |
15.617 |
16.387 |
4.541 |
| N | 216 |
216 |
215 |
214 |
189 |
155 |
53 |
214 |
214 |
216 |
| Sum | 2604.9 |
346.40 |
749.33 |
11446.4 |
9220.1 |
1696.3 |
650.59 |
1975.77 |
4.050 |
-4097.3 |
| Range | 264.46 |
47.53 |
35.39 |
172.13 |
877.48 |
68.3 |
83.16 |
8.29 |
0.1427 |
100 |
| Min | -199.92 |
-28.41 |
-4.39 |
5.49 |
-101.2 |
0 |
.04 |
6.567 |
0.00033 |
-100 |
| Max | 46.54 |
19.13 |
31 |
177.62 |
776.28 |
68.3 |
83.2 |
14.866 |
0.1431 |
0 |
Note: The table presents the distribution of variables by showing mean, median, standard deviation, skewness, kurtosis, minimum and maximum. See Table 3 for variable definitions
To solve the above issue, log transformation is usually needed. However, the log transformation is only needed for the normal distribution of residuals. It is also needed to create valid t-test results, but has no effect on regression, as estimation of regression coefficients do not require normally distributed residuals. Finally, a normality of t-test assumption need not be satisfied if the sample size is larger than n=30. By the central limit theorem, means of samples from a population with finite variance approach a normal distribution regardless of the distribution of the population. Sample means are principally normally distributed as long as the sample size is at approximately 20 or 30. Thus, no long transformation is needed for the empirical analysis in this study (Baum, 2006).
4.1. T-Test on Privatized Group
The results of the two-sample paired t-test with equal variances conducted on the privatized group are presented in Table (5). The t-test null hypothesis indicates that there is no difference between the mean performance of banks before privatization and the mean performance of these banks after privatization. The alternate hypothesis![]() suggests that the respective mean variable is greater after privatization,
suggests that the respective mean variable is greater after privatization,
Table-5. Comparison of mean performance of privatized banks by privatization dummy
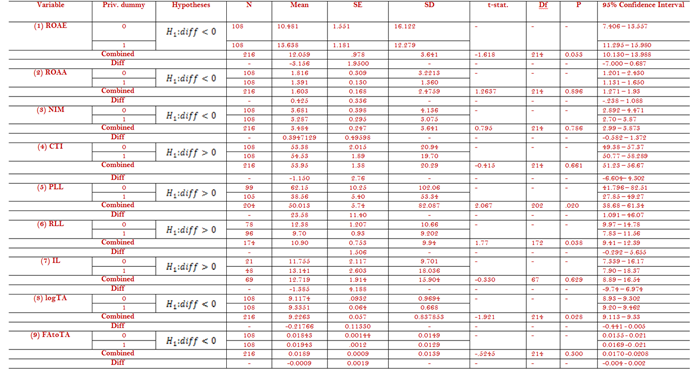
Further, the following graph visually illustrates the results of the t-test on the privatized group. As demonstrated in Table (5), for each financial variable, the mean of the respective variable before privatization (dummy = 0) is compared with the mean of the respective variable after privatization (dummy = 1) to calculate the mean difference. In each case,H1 (as displayed in the table) is tested against the null hypothesis that there is no difference between means of group (0) and group (1).
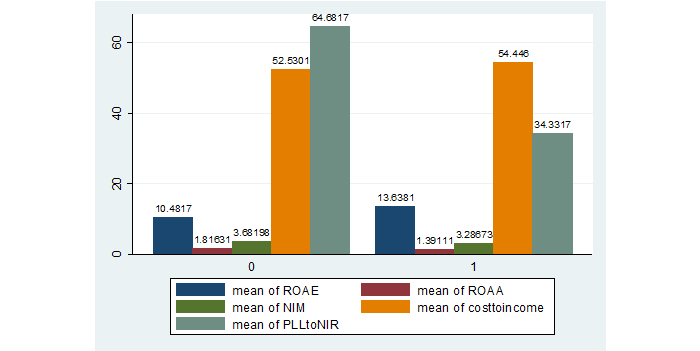
Figure-1. Graphical representation of Table (5) – comparison of average performance before and after privatization, by privatization dummy (privatized group)
The t-test results show that the mean of ROAE is higher after privatization. Thus, the null hypothesis is rejected, and the proposition that on average banks have a higher ROAE after privatization is statistically significant at the 5% level. Moreover, RLL was lower after privatization, which indicates that banks had a lower risk of default loans after getting privatized , and thus, kept lower reserves for potential loan losses. Thus, the null hypothesis is rejected and the proposition that banks have lower RLL after privatization is accepted, and is statistically significant at the 5% level. Also, the PLL ratio was lower after privatization, which means that the expenses the banks had to incur because of default loans is lower after privatization. Thus, the null hypothesis is rejected, and the proposition that on average banks have lower PLL resulting in higher quality of loans is statistically significant at the 5% level. This result also prominently corresponds with the results that banks after privatization kept lower RLL. However, t-tests on other variables failed to reject the null hypotheses. IL results show a minor negative difference which is statistically insignificant; this could be due to its calculation involving the full amount of impaired loan, rather than only the specific amount that is overdue. Additionally, ROAA was lower after privatization by a relatively small difference of 0.4251. However, the result of the ROAA t-test was insignificant. Similarly, the t-test results for NIM and CTI showed that mean performance in terms of NIM and CTI deteriorated after privatization, albeit these results being statistically insignificant. The difference in average CTI after privatization was -1.15063, which is a relatively small difference. We fail to reject the null hypothesis, and thus reject the alternate hypotheses that average CTI decreases after privatization and average NIM increases after privatization. However, since the results were statistically insignificant, further analysis are performed to validate results, as demonstrated in the following regression and DID analyses.
Finally, logTA and FAtoTA increase after privatization, with the logTA result being statistically significant at the 5% level. This could imply that the banks are increasing their size. This corresponds perfectly with the direction of change in the variables after privatization. For instance, it explains the decreased ROAA and NIM after privatization. This is because increased TA leads to decreased ROAA and NIM, as TA is a common denominator in both ratios. Assuming liabilities are held constant, an increase in total assets implies an increase in equity as the purchase of assets is assumed to be financed by equity respectively. Since mean ROAE increases after privatization, it would be logical to assume that net income increased at a rate greater than the increase in total equity, which led to increased ROAE.
4.2. Regression Analysis on Privatized Banks Group
As shown in Table (6), results of the regression on privatized group show that ROAA decrease after the bank experiences privatization, although with a small coefficient and this result being statistically insignificant. Thus, due to insignificance of this result, it cannot be claimed with confidence that banks experience lower asset profitability or poor asset management after privatization in spite of the negative coefficient. It is also worth noting that the time period after privatization is 3 years, which could reflect that on the long run banks could be experiencing improved ROAA. As for the ROAE, which reflects the return flowing to investors as compensation for their capital investment in the bank, increases after the bank gets privatized although this result is statistically insignificant. Taking everything into account, there is a positive ROAE coefficient albeit the statistical insignificance of the result.
Table-6. Privatized group regression
(1) |
(2) |
(3) |
(4) |
(5) |
|
| VARIABLES | ROAE |
ROAA |
NIM |
CTI |
PLL |
| Pdummy | 4.324 |
-0.109 |
-0.528 |
10.07** |
-28.74 |
(3.142) |
(0.680) |
(0.546) |
(4.755) |
(19.42) |
|
| RLL | -0.238* |
-0.0390 |
0.0615*** |
-0.0909 |
0.610 |
(0.132) |
(0.0286) |
(0.0230) |
(0.200) |
(0.816) |
|
| logTA | -3.349** |
0.905*** |
-0.594** |
-2.195 |
1.303 |
(1.558) |
(0.337) |
(0.271) |
(2.357) |
(9.901) |
|
| FAtoTA | -569.7*** |
-128.7*** |
-64.72*** |
340.3** |
2,124*** |
(91.96) |
(19.91) |
(15.99) |
(139.2) |
(568.3) |
|
| 3.country1 | -6.176 |
-2.855*** |
-4.265*** |
-4.556 |
37.27 |
(4.542) |
(0.983) |
(0.790) |
(6.873) |
(30.54) |
|
| 4.country1 | 11.64** |
-0.624 |
-1.755* |
-0.586 |
-65.74* |
(5.840) |
(1.264) |
(1.016) |
(8.836) |
(36.68) |
|
| 5.country1 | -14.29** |
-2.392 |
-1.718 |
14.51 |
-11.13 |
(6.970) |
(1.509) |
(1.212) |
(10.55) |
(43.97) |
|
| 6.country1 | 1.167 |
-1.200 |
-2.031** |
-17.14** |
-25.69 |
(4.926) |
(1.066) |
(0.857) |
(7.454) |
(31.88) |
|
| 7.country1 | 0.878 |
0.759 |
-1.142 |
13.29 |
-44.71 |
(7.219) |
(1.563) |
(1.255) |
(10.92) |
(44.71) |
|
| 8.country1 | -12.53* |
-4.372*** |
-5.364*** |
16.04 |
-0.717 |
(6.555) |
(1.419) |
(1.140) |
(9.919) |
(46.67) |
|
| 9.country1 | -2.080 |
1.451 |
5.545*** |
-31.87** |
-37.79 |
(10.08) |
(2.181) |
(1.752) |
(15.25) |
(61.65) |
|
| 10.country1 | -7.958 |
-3.984*** |
-1.347 |
-8.764 |
7.634 |
(6.210) |
(1.344) |
(1.080) |
(9.397) |
(39.42) |
|
| 11.country1 | -10.13* |
-0.978 |
-2.656*** |
1.017 |
-5.075 |
(5.538) |
(1.199) |
(0.963) |
(8.380) |
(36.30) |
|
| 1995.bankyear | 3.663 |
1.159 |
1.823 |
-8.899 |
7.225 |
(9.547) |
(2.067) |
(1.660) |
(14.45) |
(56.60) |
|
| 1996.bankyear | 5.017 |
-0.463 |
1.740 |
-10.59 |
40.63 |
(8.637) |
(1.870) |
(1.502) |
(13.07) |
(51.17) |
|
| 1997.bankyear | 8.103 |
-0.637 |
1.590 |
-4.527 |
34.88 |
(14.70) |
(3.182) |
(2.557) |
(22.25) |
(87.10) |
|
| 1998.bankyear | 2.327 |
-0.501 |
2.525 |
-14.63 |
53.08 |
(8.914) |
(1.930) |
(1.550) |
(13.49) |
(53.23) |
|
| 1999.bankyear | -1.822 |
-0.508 |
2.743* |
-14.53 |
45.92 |
(9.252) |
(2.003) |
(1.609) |
(14.00) |
(55.30) |
|
| 2000.bankyear | -5.011 |
-1.057 |
2.360 |
-11.52 |
59.86 |
(8.600) |
(1.862) |
(1.496) |
(13.01) |
(51.27) |
|
| 2001.bankyear | -6.426 |
-1.283 |
1.452 |
-1.680 |
86.11* |
(8.350) |
(1.807) |
(1.452) |
(12.64) |
(49.52) |
|
| 2002.bankyear | -9.236 |
-0.889 |
1.481 |
5.507 |
63.38 |
(8.248) |
(1.785) |
(1.434) |
(12.48) |
(48.87) |
|
| 2003.bankyear | -5.110 |
0.0469 |
1.759 |
2.290 |
68.57 |
(7.782) |
(1.685) |
(1.353) |
(11.78) |
(46.44) |
|
| 2004.bankyear | -8.528 |
-0.784 |
1.525 |
8.109 |
97.01** |
(8.095) |
(1.752) |
(1.408) |
(12.25) |
(48.75) |
|
| 2005.bankyear | -1.948 |
0.197 |
2.780** |
-9.778 |
106.0** |
(7.922) |
(1.715) |
(1.378) |
(11.99) |
(48.13) |
|
| 2006.bankyear | -0.886 |
0.798 |
3.367** |
-19.96 |
52.11 |
(8.497) |
(1.839) |
(1.478) |
(12.86) |
(51.82) |
|
| 2007.bankyear | -1.581 |
0.441 |
3.410** |
-7.534 |
39.12 |
(8.261) |
(1.788) |
(1.437) |
(12.50) |
(49.64) |
|
| 2008.bankyear | 0.128 |
0.913 |
5.294*** |
-15.51 |
44.97 |
(8.567) |
(1.854) |
(1.490) |
(12.96) |
(51.49) |
|
| 2009.bankyear | -7.685 |
-1.133 |
4.364*** |
-11.88 |
27.78 |
(8.855) |
(1.917) |
(1.540) |
(13.40) |
(53.53) |
|
| 2010.bankyear | -9.551 |
-0.856 |
2.975* |
-6.252 |
79.58 |
(9.877) |
(2.138) |
(1.718) |
(14.95) |
(60.17) |
|
| 2011.bankyear | -7.491 |
-1.493 |
2.180 |
-15.23 |
86.16 |
(10.35) |
(2.240) |
(1.800) |
(15.66) |
(61.96) |
|
| 2012.bankyear | -3.404 |
-1.212 |
5.036** |
-14.28 |
110.0 |
(12.87) |
(2.786) |
(2.238) |
(19.48) |
(76.97) |
|
| Constant | 63.76*** |
-1.872 |
9.358*** |
72.35** |
-69.44 |
(18.62) |
(4.030) |
(3.238) |
(28.17) |
(120.2) |
|
| Observations | 154 |
154 |
154 |
154 |
143 |
| R-squared | 0.507 |
0.525 |
0.448 |
0.348 |
0.333 |
| Country FE | YES |
||||
| Year FE | YES |
Note: Standard errors in parentheses, *** p<0.01, ** p<0.05, * p<0.1
Moreover, NIM has a small negative beta-coefficient indicating decreased NIM as a result of privatization. This could show that the bank incurs more interest expense than interest revenue from its interest earning assets, or the bank is increasing its size (TA), which decreases the NIM ratio. Nevertheless, this result is also statistically insignificant. Thus, although ROAA and NIM have negative coefficients, it cannot be claimed that banks are not profitable as these results are statistically insignificant. Additionally, it cannot be claimed that ROAE improve after privatization as this result is also statistically insignificant. Thus, no clear results can be concluded on profitability with regards to the regression on privatized groups. The study proceeds to difference analysis in the next methodological steps to further validate results on profitability.
Furthermore, CTI increases after privatization with a relatively small coefficient with this result being statistically significant at the 5% level. This shows that total cost increases after the bank experiences privatization relative to total income. The beta-coefficient being small indicates that the magnitude of this increase is not large enough to indicate a major problem in managing banking costs. During and immediately after privatization, banks typically experience increased costs or lower income, with this effect projected on the ratio. Further DID analysis is conducted to come up with more valid and reliable results. Finally, the last regression result is concerned with the PLL ratio, which measures bank risk and asset quality. It is shown in Table (6) that PLL decreases after the bank gets privatized, thus showing lower risk due to bad loans. However, this result is not statistically significant.
Briefly, the empirical analysis focuses mainly on the relationship between the response variables and the privatization dummy, while other noteworthy results are outlined in the regression summary table. It is worth mentioning that there is a significant negative relationship between the FAtoTA ratio and all profitability ratios at the 1% level. This result may be interpreted that banks invested more in fixed assets after privatization instead of interest-earning assets, which reduces their liquidity and profitability.
Table (6) also reports the strength of the relationship between the model and the dependent variable. As shown in the table, the R-squared measures for ROAE, ROAA, and NIM are respectively 51%, 52%, and 45%, which indicates that approximately half of the variation in the dependent variables (ROAA, ROAE, and NIM) can be explained by the model (or the independent variables included in the model). For CTI and PLL ratios, the R-squared measures are respectively 35% and 33%, showing that less variation in the response data can be explained by the model. As for the F-test, which indicates the overall significance of the model, shows that the significance of the f-test for the regressions conducted on variables such as ROAE, ROAA, and NIM in Table (6) account to a significance level of 1%. Hence, it reports a significant F statistic. The last step in the methodology is the following DID analysis, which takes into account both the privatized banks group ‘treated’ and already private banks group ‘untreated’ as previously explained. Thus, the difference analysis produces the most robust results.
4.3. T-Test on Difference Group
The results of the two-sample paired t-test with equal variances conducted on the difference group are reported in Table (7). The t-test null hypothesis indicates that there is no difference between the mean performance of banks before privatization and the mean performance of these banks after privatization. The alternate hypothesis
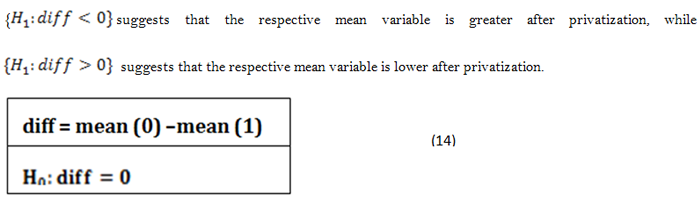
Table-7. Comparison of mean performance of difference variables by privatization dummy
| diff_Var. | Priv. dummy | Hypotheses | N | Mean | SE | SD | t-stat. | Df | P | 95% Confidence Interval |
| (1) diff_ROAE | 0 | 108 | -4.12 | 2.59 | 26.97 | - | - | - | -9.27 – 1.019 | |
| 1 | 108 | -0.432 | 1.65 | 17.16 | -3.70 – 2.84 | |||||
| Combined | 216 | -2.279 | 1.54 | 22.63 | -1.2 | 214 | 0.11 | -5.31 -0 .75 | ||
| Diff | - | -3.69 | 3.07 | - | - | - | - | -9.75 – 2.37 | ||
| (2) diff_ROAA | 0 | 108 | -0.235 | 0.486 | 5.053 | - | - | - | -1.19 - 0.728 | |
| 1 | 108 | -0.900 | 0.585 | 6.08 | -2.06 - 0.259 | |||||
| Combined | 216 | -0.568 | 0.380 | 5.58 | 0.873 | 214 | 0.80 | -1.31 - 0.181 | ||
| Diff | - | 0.664 | 0.761 | - | - | - | - | -0.835 – 2.16 | ||
| (3) diff_NIM | 0 | 105 | 0.885 | 0.451 | 4.62 | - | - | - | -.0097 – 1.78 | |
| 1 | 108 | 0.116 | 0.351 | 3.65 | -0.581 - 0.813 | |||||
| Combined | 213 | 0.4957 | 0.285 | 4.17 | 1.34 | 211 | 0.91 | -0.067 – 1.058 | ||
| Diff | - | 0.76 | 0.57 | - | - | - | - | -0.355 – 1.89 | ||
| (4) diff_CTI | 0 | 102 | -93.28 | 55.28 | 558.3 | - | - | - | -202.9 – 16.38 | |
| 1 | 108 | -371.3 | 203.6 | 2116.8 | -775.15 – 32.44 | |||||
| Combined | 210 | -236.2 | 108.3 | 1569.7 | 1.28 | 208 | 0.10 | -449.8 – -22.7 | ||
| Diff | - | 278.0 | 216.4 | - | - | - | - | -148.5 – 704.6 | ||
| (5) diff_PLL | 0 | 84 | 39.24 | 12.86 | 117.9 | - | - | - | 13.65 – 64.8 | |
| 1 | 87 | 5.26 | 7.23 | 67.52 | -9.12 – 19.65 | |||||
| Combined | 171 | 21.95 | 7.40 | 96.88 | 2.32 | 169 | 0.01 | 7.33 – 36.58 | ||
| Diff | - | 33.98 | 14.63 | - | - | - | - | 5.09 – 62.86 | ||
| (6) diff_RLL | 0 | 69 | 0.918 | 1.78 | 14.86 | - | - | - | -2.65 – 4.48 | |
| 1 | 78 | 0.354 | 1.17 | 10.34 | -1.97– 2.68 | |||||
| Combined | 0.619 | 1.041 | 12.62 | 0.269 | 145 | .393 | -1.43 – 2.67 | |||
| Diff | - | .5645073 | 2.093457 | - | - | - | - | -3.57 – 4.70 | ||
| (7) diff_IL | 0 | 3 | -2.075 | 0 | 0 | - | - | - | -2.075 – -2.075 | |
| 1 | 21 | 0.083 | 1.50 | 6.90 | -3.05 – 3.22 | |||||
| Combined | 24 | -0.186 | 1.32 | 6.47 | -0.53 | 22 | 0.69 | -2.92 –2.548 | ||
| Diff | - | -2.158 | 4.06 | - | - | - | - | -10.58 – 6.26 | ||
| (8) diff_logTA | 0 | 108 | 0.423 | 0.136 | 1.42 | - | - | - | 0.152 - 0.69 | |
| 1 | 108 | 0.361 | 0.125 | 1.30 | 0.113 - 0.610 | |||||
| Combined | 216 | 0.392 | 0.091 | 1.362 | 0.33 | 214 | 0.63 | 0.210 - 0.575 | ||
| Diff | - | 0.061 | 0.185 | - | - | - | - | -0.303 - 0.427 | ||
| (9) diff_FAtoTA | 0 | 108 | 0.002 | 0.001 | 0.015 | - | - | - | -0.0002 - 0.005 | |
| 1 | 108 | 0.002 | 0.001 | 0.020 | -0.001 - 0.006 | |||||
| Combined | 216 | 0.002 | 0.001 | 0.018 | 0.233 | 214 | 0.59 | 0.000 - 0.004 | ||
| Diff | - | 0.0005 | 0.002 | - | - | - | - | -0.0043 -0.005 | ||
The following graph visually illustrates the results of the t-test on the difference group.
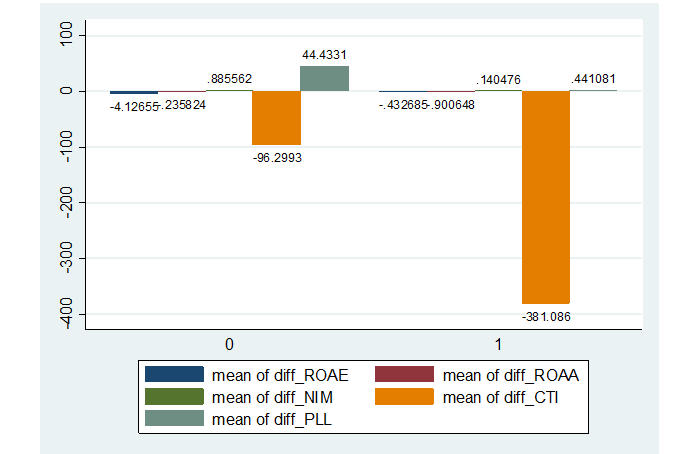
Figure-2. Graphical representation of Table (7) – comparison of average performance before and after privatization, by privatization dummy (difference group)
The t-test results show that CTI decreases after privatization, and this result is statistically significant at the 10% level, thus we reject the null hypothesis that there is no difference in mean performance before and after privatization, or mean difference = 0. Plus, CTI is shown to be lower in privatized banks than the already private banks, therefore, banks after getting treated ‘privatized’ exceed the performance of the untreated ‘already private’ group. As for ROAE, banks experienced a relatively higher ROAE after privatization. It is worth noting that the negative difference in ROAE between privatized and already private banks were higher before banks got privatized, and this difference decreases after privatization (where dummy=1), which shows that the mean performance of privatized banks in comparison with already private ones improve after privatization as the magnitude of the relative difference itself decreases. In other words, banks are able catch up more with the already private banks after privatization.
Additionally, although banks witness improved ROAE after getting privatized such result cannot be claimed to be statistically significant as it has a p-level of 0.1156. Additionally, both PLL and RLL decrease after privatization, conforming to the results of the t-test on privatized group in Table (5). The PLL result is statistically significant at the 1% level, thus we reject the null hypothesis; while RLL result was statistically insignificant. Also, IL results conform to the t-test results on the privatized group in Table (5) – IL increases after privatization with the result being statistically insignificant.
Furthermore, the mean difference of ROAA and mean difference of NIM are higher before privatization, indicating that banks performed less on average after privatization. However, in terms of differences between the privatized and already private banks, NIM in privatized banks exceeds that of the private banks in both scenarios before privatization and after privatization. It is when pre- and post- privatization performance as wholes are compared with each other, NIM is shown to be lower after privatization. However, this result is not statistically significant. We thus fail to reject the null hypothesis in this case. In case of ROAA, private banks performed overall better than privatized banks. Also, post-privatization performance declines, and evidence shows statistical insignificance. Thus we fail to reject the null hypothesis. A justification for the lower post-privatization NIM and ROAA could due to the state often starting with privatizing the larger banks making losses in order to seek an economic return from the privatization, as described in the literature review.
Finally, although privatized banks increase their logTA and FAtoTA as shown in Table (5) of the t-test on privatized banks group, both measures appear to decrease in Table (6), where the t-test is conducted on the difference group. This shows that bank size and asset composition indeed increase in privatized banks after privatization, but only when compared with already private banks The bank size and asset composition ratio remain slightly smaller in privatized banks than in already private ones. It appears to be that privatized banks are generally smaller in size and have less fixed assets in comparison to already private banks. Additionally, on average, privatized banks still witness increased size of total assets and fixed assets after getting privatized. It cannot be confidently claimed that this is true, since both sets of t-test results were not statistically significant. Results of regression can then be used to validate such assumptions.
4.4 Regression for Difference Analysis Group
Greatest emphasis is placed on the results of the difference group regression as previously explicated. As shown in Table (8), results of the regression on the difference group show that ROAA decreases, which conforms to the result of the regression on privatized group in Table (6); albeit ROAA decreases at the 10% significance level according to the regression conducted in the difference analysis.
Table-8. Difference group regression
| (1) | (2) | (3) | (4) | (5) | ||
| VARIABLES | diff_ROAE | diff_ROAA | diff_NIM | diff_CTI | diff_PLL | |
| pdummy_PVZ | 2.035 |
-4.455* |
-1.264 |
-1,480* |
-132.3** |
|
(8.897) |
(2.536) |
(0.989) |
(868.0) |
(61.50) |
||
| diff_RLL | 0.0372 |
0.0345 |
-0.0263 |
-12.22 |
3.667** |
|
(0.246) |
(0.0700) |
(0.0273) |
(26.20) |
(1.698) |
||
| diff_logTA | 4.509 |
1.549* |
-0.595* |
249.3 |
17.31 |
|
(2.862) |
(0.816) |
(0.318) |
(276.7) |
(24.44) |
||
| diff_FAtoTA | -1.469 |
-23.67 |
42.66* |
4,642 |
-270.7 |
|
(213.0) |
(60.71) |
(23.66) |
(21,651) |
(1,447) |
||
| 3.country_PVZ1 | -4.640 |
-7.797*** |
-3.469*** |
-1,077 |
-81.48 |
|
(9.622) |
(2.743) |
(1.069) |
(932.1) |
(73.87) |
||
| 4.country_PVZ1 | 7.403 |
-6.967 |
-6.044*** |
-1,180 |
-181.2 |
|
(14.72) |
(4.195) |
(1.635) |
(1,422) |
(109.8) |
||
| 5.country_PVZ1 | -3.997 |
-1.760 |
-1.162 |
497.5 |
68.20 |
|
(15.75) |
(4.491) |
(1.750) |
(1,522) |
(105.3) |
||
| 6.country_PVZ1 | -35.06*** |
-2.057 |
-4.623*** |
351.1 |
-74.04 |
|
(11.79) |
(3.362) |
(1.311) |
(1,140) |
(84.12) |
||
| 7.country_PVZ1 | 4.537 |
-3.650 |
-3.110 |
566.1 |
-158.4 |
|
(17.92) |
(5.109) |
(1.991) |
(1,749) |
(125.3) |
||
| 8.country_PVZ1 | 7.068 |
-4.596 |
-3.117* |
-124.8 |
-158.8 |
|
(14.74) |
(4.200) |
(1.637) |
(1,445) |
(115.5) |
||
| 9.country_PVZ1 | 6.602 |
-0.150 |
3.039 |
-525.9 |
-47.11 |
|
(22.91) |
(6.531) |
(2.546) |
(2,218) |
(142.6) |
||
| 11.country_PVZ1 | 3.369 |
-5.011 |
-3.630* |
-320.0 |
-146.6 |
|
(17.15) |
(4.890) |
(1.906) |
(1,659) |
(106.7) |
||
| 1995.bankyear_PVZ | -11.82 |
0.801 |
0.868 |
-23.53 |
28.30 |
|
(20.44) |
(5.825) |
(2.271) |
(1,976) |
(148.1) |
||
| 1996.bankyear_PVZ | 29.04 |
1.700 |
1.711 |
134.5 |
251.5* |
|
(19.96) |
(5.691) |
(2.218) |
(1,928) |
(135.2) |
||
| 1997.bankyear_PVZ | 114.4*** |
5.437 |
1.409 |
-369.2 |
-462.0** |
|
(32.32) |
(9.212) |
(3.591) |
(3,121) |
(204.6) |
||
| 1998.bankyear_PVZ | 33.58 |
4.337 |
2.228 |
1,329 |
136.5 |
|
(20.70) |
(5.900) |
(2.300) |
(2,000) |
(148.6) |
||
| 1999.bankyear_PVZ | 34.60 |
7.296 |
2.875 |
1,631 |
208.8 |
|
(23.35) |
(6.657) |
(2.595) |
(2,261) |
(161.1) |
||
| 2000.bankyear_PVZ | 28.55 |
4.027 |
2.383 |
888.3 |
144.4 |
|
(21.61) |
(6.159) |
(2.401) |
(2,089) |
(149.7) |
||
| 2001.bankyear_PVZ | 33.74 |
-0.0510 |
2.118 |
390.9 |
82.70 |
|
(20.46) |
(5.834) |
(2.274) |
(1,976) |
(140.4) |
||
| 2002.bankyear_PVZ | 27.57 |
0.496 |
2.562 |
125.7 |
-4.783 |
|
(18.95) |
(5.402) |
(2.105) |
(1,830) |
(138.2) |
||
| 2003.bankyear_PVZ | 30.57* |
2.367 |
2.311 |
639.9 |
34.58 |
|
(18.11) |
(5.164) |
(2.013) |
(1,752) |
(132.6) |
||
| 2004.bankyear_PVZ | 21.48 |
3.742 |
1.299 |
1,163 |
184.6 |
|
(19.01) |
(5.419) |
(2.112) |
(1,836) |
(144.4) |
||
| 2005.bankyear_PVZ | 28.77 |
2.373 |
1.979 |
819.1 |
314.3** |
|
(19.06) |
(5.432) |
(2.117) |
(1,857) |
(143.7) |
||
| 2006.bankyear_PVZ | 27.92 |
2.866 |
1.580 |
10.72 |
167.9 |
|
(20.34) |
(5.798) |
(2.260) |
(1,969) |
(153.2) |
||
| 2007.bankyear_PVZ | 24.88 |
6.012 |
2.186 |
749.5 |
170.8 |
|
(20.38) |
(5.810) |
(2.265) |
(1,985) |
(149.9) |
||
| 2008.bankyear_PVZ | 29.77 |
8.696 |
3.052 |
2,217 |
192.2 |
|
(20.98) |
(5.982) |
(2.332) |
(2,039) |
(159.0) |
||
| 2009.bankyear_PVZ | 27.83 |
9.975 |
2.899 |
2,839 |
186.9 |
|
(22.37) |
(6.377) |
(2.486) |
(2,164) |
(165.2) |
||
| 2010.bankyear_PVZ | 37.52 |
10.08 |
2.841 |
2,451 |
156.3 |
|
(25.32) |
(7.218) |
(2.814) |
(2,450) |
(209.6) |
||
| 2011.bankyear_PVZ | 38.26 |
10.16 |
2.430 |
2,637 |
210.6 |
|
(28.65) |
(8.168) |
(3.184) |
(2,769) |
(254.4) |
||
| 2012.bankyear_PVZ | 37.64 |
9.894 |
7.122** |
2,511 |
339.6 |
|
(31.42) |
(8.958) |
(3.492) |
(3,039) |
(225.1) |
||
| Constant | -29.66 |
1.497 |
1.567 |
-317.8 |
9.644 |
|
(20.20) |
(5.759) |
(2.245) |
(1,952) |
(150.1) |
||
| Observations | 119 |
119 |
119 |
115 |
82 |
|
| R-squared | 0.395 |
0.225 |
0.431 |
0.142 |
0.485 |
|
| Country FE | YES |
|||||
| Year FE | YES |
|||||
Note: Standard errors in parentheses, *** p<0.01, ** p<0.05, * p<0.1. PVZ refers to ‘privatized’, as the privatized controls are used in the regression.
Moreover, ROAE increased after privatization, but this result is not statistically significant. NIM decreased after privatization with this result also being not statistically significant, which is also the same result found in the regression output in Table (6). On the other hand, CTI decreased after privatization at a significance level of 10%. Therefore, we reject the null hypothesis and accept the alternate hypothesis that decreased CTI (or higher cost efficiency) is associated with privatization It can be inferred that the decreasing CTI indicates that privatized banks experience higher cost efficiency as a result of privatization, due to the fact that the total cost is managed more efficiently after privatization, showing that operating costs have decreased relative to operating income. Additionally, PLL decreases after privatization at a 5% significance level, thus we reject the null hypothesis and accept the alternate hypothesis that decreased PLL (or decreased bank risk) is associated with privatization. It can be said that privatized banks indeed face lower bank risk and improved asset quality, because they are subjected to less loan losses and consequently incur a lower PLL expense.
As shown in Table (8), the R-squared measures for diff_ROAE, diff_PLL, and diff_NIM are respectively 40%, 49%, and 43%, which indicates that almost half of the variation in the dependent variables can be explained by the model (or the independent variables included in the model). For diff_ROAA and diff_CTI ratios, the R-squared measures are respectively 14% and 23%, showing that less variation in the response data can be explained by the model.
As for the F-test, the significance of the f-test for the regressions conducted on variables such as diff_NIM, diff_ROAE, and diff_CTI in Table (8) account to the 1% significance level. This indicates that using the model is better than guessing the mean; the model is significant as the significance level is approaching zero.
4.5. Summary of Findings and Limitations
On account of all the empirical results discussed in the previous sections, these findings are summarized in Table (9), focusing on the five main dependent variables. The following table summarizes the empirical results which determine the main findings of the study.
Table-9. Results Summary
| Variable | Results of: | |||||||
| Privatized Group | Difference Group | |||||||
| Two-sample T-test with equal variances | OLS Regression FE: Time, Country |
Two-sample T-test with equal variances | OLS Regression FE: Time, Country |
|||||
| Post-privatization effect | p-level | β-coeff. | p-level | Post-privatization effect | p-level | β-coeff. | p- evel |
|
| ROAA (DV) | Decrease | insig. | -ve | insig. | Decrease | insig. | -ve | p<10% |
| ROAE (DV) | Increase | <5% | +ve | insig. | Increase | P<10% | +ve | insig. |
| NIM (DV) | Decrease | insig. | -ve | insig. | Decrease | insig. | -ve | i sig. |
| CTI(DV) | Increase | insig. | +ve | p<5% | Decrease | P< 0% |
-ve | p<10% |
| PLL (DV) | Decrease | p<5% | -ve | insig. | Decrease | P<1% | -ve | p<5% |
The results support the hypotheses (H1 and H2) that both cost efficiency (measured by CTI) and bank risk as well as asset quality (measured by PLL) improve after banks get privatized. This can be majorly observed in the DID analysis conducted. As shown in the results, CTI decreased at the 10% significance level according to the t-test and regression on the difference group. Additionally, PLL decreases according to all tests on both privatized group and difference group, at the highlighted significance levels displayed in Table (9). Both the analysis on privatized group and DID analysis confirm that bank risk decreases significantly as a result of privatization.
As for ROAE, t-test results on both privatized group and difference group show that ROAE increase at the 5% significance level for the former and the 10% significance level for the latter. However, ROAE results were not significant when regressions were done. Although the regression results show the desired positive change in ROAE after privatization, the significance levels were insignificant.
Consequently, on one hand it can be claimed that privatization has a positive impact on banking performance in terms of decreased CTI and bank risk, while on the other hand, the impact on profitability is inconsequential. In fact, ROAA appears to decrease according to all results (negative beta coefficient) with the results being statistically insignificant. However, for the regression conducted on the difference group, it showed that ROAA decreases after privatization at the 10% significance level. Nevertheless, ROAE increases significantly according to t-tests, but this increase is shown to not be significant according to regression results. As for NIM, it decreases according to all tests conducted on both privatized and difference group, however results are insignificant.
Finally, the insignificant profitability measures in our study could be interpreted as follows; first, data constraints when conducting the difference analysis- for instance, a bank in the privatized group could come from Bahrain and operates globally, while another bank in the already private group could come from Libya and operates locally. This could have some effect on robustness of results. Second, data limitations – published bank data involved many missing observations which led to loss of several privatization cases. Older historical bank data were difficult to retrieve, which once more led to drop of privatization cases. The small panel data set may have caused some noise in the data as a consequence. Third, type 2 Error – it could be that the alternate hypothesis is correct, but we fail to reject the null hypothesis. Fourth, even when controlling for bank size (log TA), there still may be extraordinary effect not corrected in the linear regression analysis. Fifth, compliance with theories: External factors could be affecting profitability. Although several studies from previous literature on more developed regions mainly state that there is increased profitability due to bank privatization, the study looks at MENA region, which has special characteristics; we do not find robust reasons that privatization increases bank profitability. This could be associated to the institutional environment, as suggested by the institutional theory. Sixth, on the long run, an increasing profitability trend could be observable, especially that governments may be first privatizing the banks that are performing the worst, such as suggested by Andrews (2005). Finally, many banks have been partially privatized with only minority stake transferred to the private sector. Thus, impact on banking performance may not be fully realized.
5. CONCLUSIONS AND IMPLICATIONS
New conclusions are found for the impact of privatization on banking performance privatization in the MENA region. After getting privatized, banks improve their cost efficiency and reduce banking risk significantly. Relationship between privatization and profitability remains uncertain and there is no robust reason that privatization in fact improves bank profitability as the study fails to reject the null hypothesis. However, the reduced government ownership enhances performance in banks.
The study raises additional questions in the beginning, such as: Does privatization imply that state-owned banks suffer from poor performance? To what extent does privatization affect bank performance? The following comprises the answers to these questions:
Findings claim that state ownership lags performance, especially in terms of cost and risk. For instance, this can be related to the unstable MENA region, where governments have highly burdened budgets. Banking has a crucial effect on the economic wellbeing, and the government can use privatization as a tool to take some cost off from the state budget and reduce the banking risk, through transferring its ownership to the private sector. With regards to the extent to which privatization affects performance, observing the amount of state ownership divested can lead to useful repercussions. Privatized banks could have a lower or higher effect on banking performance according to the percentage decrease in state ownership after privatization, especially because most privatized banks did not fully divest state ownership, as some privatizations were carried out on phases. This could also be tied to profitability results. These figures were included in Table (2) for that purpose.
These new facts specific to MENA region build on the privatization theories. For instance, the contingency theory suggests that the uniqueness of each country’s environment has an impact on the overall effectiveness of a privatization program and implementation success (Negandhi and Reimann, 1972). According to the World Bank, developing countries require application of stricter conditions and controls in order to achieve positive bank performance. This could explain the lower profitability in case of privatized banks of MENA in comparison with more successful models of privatization applied in developed regions – existence of a contingency problem. The financial system may not be harmonized with other subsystems in the country; such conflict may hinder progress of structural reforms. However, according to the institutional theory, the governments of the MENA countries focused on in this study may have gained public trust and acceptance necessary to shape the decisions regarding privatization. For instance, the state often resorts to privatization as an economic reform tool albeit maintaining a superior role in the economy to preserve a governmental role that is limited to a certain extent, for example, by applying a privatization program in phases or through specialized privatization committees. This is in fact often the case in countries of MENA, which could have contributed to the success of the studied privatization cases, as shown in the promising results on cost efficiency and bank risk.
Relying on the findings of this study, implications could be drawn for policymakers. As cost efficiency and bank risk improve significantly after privatization, it is recommended that policy makers and decision makers support privatization programs to reform the banking system in the MENA region. This could significantly reduce governmental costs, and thus reduce the burden on the state budget, especially as instability in the region requires that governments liberate their financial systems and focus on structural reforms. Moreover, it is recommended that measurement of privatization outcome is done over a longer time span as profitability may take time to significantly improve, especially when bureaucracy exists and heavy transformation is taking place. Finally, implementation of privatization programs on phases could be more effective, as it is more flexible in monitoring and controlling outcome.
| Funding: This study received no specific financial support. |
| Competing Interests: The authors declare that they have no competing interests. |
| Contributors/Acknowledgement: Both authors contributed equally to the conception and design of the study. |
REFERENCES
Andrews, M., 2005. State-owned banks, stability, privatization, and growth: Practical policy decisions in a world without empirical proof. IMF Working Paper No. 5/10: 1-55.
Baum, C., 2006. An introduction to modern econometrics using Stata. College Station, Tex.: Stata Press.
Beck, T., R. Cull and A. Jerome, 2005. Bank privatization and performance: Empirical evidence from Nigeria. Journal of Banking & Finance, 29(8): 2355-2379.View at Google Scholar | View at Publisher
Bonin, J.P., I. Hasan and P. Wachtel, 2004. Privatization matters: Bank efficiency in transition countries. Presented at World Bank Conference on Bank Privatization, Washington, D.C., November 20-21, 2003. William Davidson Institute Working Paper No. 679, April 2004. pp: 1-32.
Bonin, J.P., I. Hasan and P. Wachtel, 2005. Privatization matters: Bank efficiency in transition countries. Journal of Banking & Finance, 29(8-9): 2155-2178. View at Google Scholar | View at Publisher
Boubakri, N., J.C. Cosset, K. Fischer and O. Guedhami, 2005. Privatization and bank performance in developing countries. Journal of Banking & Finance, 29(8): 2015-2041. View at Google Scholar | View at Publisher
Carter, M.Z., 2013. Privatization: A multi-theory perspective. Journal of Management Policy and Practice, 14(2): 108-120. View at Google Scholar
Choi, S. and I. Hasan, 2011. Bank privatization and convergence of performance: International evidence. Journal of Financial Research, 34(2): 387-410. View at Google Scholar | View at Publisher
Clarke, G.R.G., R. Cull and M. Shirley, 2003. Empirical studies of bank privatization: an overview. In World Bank Conference on Bank Privatization in Low and Middle-Income Countries, 23: 1-39.
ElBannan, M.A., 2015. Do consolidation and foreign ownership affect bank risk taking in an emerging economy? An empirical investigation. Managerial Finance, 41(9): 874-907. View at Google Scholar | View at Publisher
Fahim, S.M. and K. Siddiqui, 2013. Privatization of Habib bank: Corporate governance compliance. IUP Journal of Corporate Governance, 12(4): 26-29. View at Google Scholar
Farabullini, F. and D.D. Hester, 2001. The performance of some recently privatized Italian banks. Social Systems Research Institute, University of Wisconsin: 1-28.
Farazi, S., E. Feyen and R. Rocha, 2013. Bank ownership and performance in the Middle East and North Africa Region. Review of Middle East Economics and Finance, 9(2): 159-196. View at Publisher
Fiorentino, E., A.D. Vincenzo, F. Heid, A. Karmann and M. Koetter, 2009. The effects of privatization and consolidation on bank productivity: Comparative evidence from Italy and Germany (Temi Di Discussione Series Working Paper No.722). Banca D'Italia.
Fries, S., D. Neven, P. Seabright and A. Taci, 2006. Market entry, privatization and bank performance in transition1. Economics of Transition, 14(4): 579-610. View at Google Scholar | View at Publisher
Ghosh, S., 2010. How did state-owned banks respond to privatization? Evidence from the Indian experiment. Annals of Public and Cooperative Economics, 81(3): 389-421. View at Google Scholar | View at Publisher
Ilyas, M., S. Ullah, O. Ullah and M. Fayaz, 2012. The impact of privatization on the financial performance of banking sector in Pakistan. Academic Journal of Scientific Research, 53: 122-140.
Kamaly, A., S. El-Ezaby and M. El-Hinawy, 2015. Does privatization enhance the performance of banks? Evidence from Egypt. Applied Social Science Association (ASSA) Conference.
Karas, A., K. Schoors and L. Weill, 2010. Are private banks more efficient than public banks? Evidence from Russia. Economics of Transition, 18(1): 209-244.View at Google Scholar | View at Publisher
Kobeissi, N. and X. Sun, 2010. Ownership structure and bank performance: Evidence from the Middle East and North Africa Region. Comparative Economic Studies, 52(3): 287-323. View at Google Scholar | View at Publisher
Kraft, E., R. Hofler and J. Payne, 2006. Privatization, foreign bank entry and bank efficiency in Croatia: A fourier-flexible function stochastic cost frontier analysis. Journal of Applied Economics, 38(17): 2075-2088. View at Google Scholar | View at Publisher
Megginson, W.J., 2003. The economics of bank privatization. Presented at World Bank Conference on Bank Privatization in Low and Middle Income Countries, Washington, D.C., November 20-21.
Naceur, S.B., S. Ghazouani and M. Omran, 2007. The performance of newly privatized firms in selected MENA countries: The role of ownership structure, governance and liberalization policies. International Review of Financial Analysis, 16(4): 332-353. View at Google Scholar | View at Publisher
Negandhi, A.R. and B.C. Reimann, 1972. A contingency theory of organization re-examined in the context of a developing country. Academy of Management Journal, 15(2): 137-146. View at Google Scholar | View at Publisher
Omran, M., 2007. Privatization, state ownership, and bank performance in Egypt. World Development, 35(4): 714-733. View at Google Scholar | View at Publisher
Rumler, F. and W. Waschiczek, 2012. Have changes in the financial structure affected bank profitability? Evidence from Austria (Oesterreichische National Bank Working Paper No. 180). Oesterreichische National Bank, Wien.
Rwegasira, K., 2000. Corporate governance in emerging capital markets: Whither Africa? Corporate Governance: An International Review, 8(3): 258-267. View at Google Scholar | View at Publisher
Shoaib, M. and M.J. Iqbal, 2012. Impact of privatization on banking sector of Pakistan. Retrieved from https://ssrn.com/abstract=2001706 or http://dx.doi.org/10.2139/ssrn.2001706 [Accessed February 8, 2012].
Tochkov, K. and N. Nenovsky, 2011. Institutional reforms, EU accession, and bank efficiency in transition economies: Evidence from Bulgaria. Emerging Markets Finance and Trade, 47(1): 113-129. View at Google Scholar | View at Publisher
Turk-Ariss, R., 2009. Competitive behavior in Middle East and North Africa banking systems. Quarterly Review of Economics and Finance, 49(2): 693-710. View at Google Scholar | View at Publisher