


INCOME DIVERSIFICATION AND BANK RISK-RETURN TRADE-OFF: EVIDENCE FROM AN EMERGING ECONOMY

1Newcastle Business School, Northumbria University, United Kingdom
2Faculty of Management and Finance, University of Colombo, Sri Lanka
ABSTRACT
This study examines the impact of bank income source diversification on risk-return trade off, of commercial banks in an emerging economy. Considering eleven commercial banks for the period from 2002 to 2015, the paper examines non-interest income and its components against the risk-adjusted returns to explore the relationships among them. Results confirmed that non-interest income is riskier than interest income, but offers potential diversification benefits to shareholders. This is followed by the negative correlation between the interest income and non-interest income. Moreover, risk adjusted return on equity is positively affected by higher non-interest income activities, indicating that a marginal increase in non-interest income improves the shareholders’ risk return trade off. However, interest income, which has a significant negative relationship with risk-adjusted return on equity indicate that increase in interest income has been associated with worsening the risk return tradeoff for shareholders. Further, comparative analysis of non-interest income and risk-adjusted returns shows that foreign exchange income and other income categories have major influence on the shareholders risk and return. However, fee based income has no explanatory power over risk adjusted return. The findings of the study have important policy implications on the regulators in the implementation of capital adequacy requirements which adjust with the bank’s risk exposure.
© 2017 AESS Publications. All Rights Reserved.
Keywords: Commercial Banks, Non-Interest Income, Interest Income, Diversification , Risk-return trade-Off., Sri Lanka
Article History: Received: 1 March 2017, Revised: 3 April 2017, Accepted: 24 May 2017, Published: 5 June 2017,
JEL Classification: G21.
Contribution/ Originality: The paper contributes the first logical analysis on the impact of income diversification on bank risk and return, in the commercial banking industry of Sri Lanka.
1. INTRODUCTION
Income source diversification is an important phenomenon, which shifts banks from its traditional, or loan based activities to non-traditional activities. The growth of non-intermediation activities suggests that intermediation activities are becoming less important part of banking business strategies and therefore strategically, banks have shifted their product mix by diversifying into other income sources (Allen and Santomero, 2010). A good number of reasons attract a commercial bank towards diversification. It is often viewed that diversification helps a bank to benefit from the economies of scale and scope, reduces unevenness in geographic reach, offers supermarket for its customers by offering variety of financial products and services. In Sri Lankan context, Non-Interest Income (Non-II) generated by non-traditional banking activities is one of the main indicator of the profitability in commercial banks, which is in rising since 2007, due to significant pressures of the declining interest rates (Fitch Rating Report, 2009 & 2014). Implications of bank’s diversified income on its profitability and risk exposure has been addressed by researchers, predominantly in developed economies (Lepetit et al., 2008; DeYong and Torna, 2013; Meslier et al., 2014). However, very few studies focus on this concern in developing economies (Sanya and Wolfe, 2011; Nguyen et al., 2012) where banks play a significant role in the financial system (Arun and Turner, 2004). Therefore, the main objective of this paper is to, investigate empirically, the extent to which these transformations in the income sources affect bank risk and return in the case of a developing economy. This study is the first of its nature to conduct in commercial banking industry of Sri Lanka.
The study incorporates preliminary investigation and multiple regression analysis to identify the relationship between diversification into Non-II and shareholder risk and return. At the preliminary investigation, researcher observes the behavior of Non-II and Net-Interest Income (Net-II), which includes descriptive statistics and further it elaborates with correlation analysis and the coefficient of variance analysis to examine the diversification benefits associated with Non-II and Net-II. Two multiple regression models have been used by the study. Model one incorporated, the value of Non-II and Net-II while second model, used the value of Non-II components to identify relationship between diversification into Non-II and shareholders risk and return. Secondary sources were utilized with data covering fourteen years from 2002 to 2015 of eleven domestic LCBs.
The findings indicate that, Non-II has a high degree of variability than the Net-II and becoming high risky income source. In addition, findings suggest that Non-II is a source of diversification for bank income, which has a positive relationship with risk adjusted ROE. Conversely, Net-II has negative relationship with risk adjusted ROE. From the Non-II components, foreign exchange income and other income have a significant relationship with risk adjusted ROE. However, fee and commission income has shown insignificant relationship with shareholders’ risk return tradeoff. The study revealed that, shareholders of banks benefit from increased bank exposure to Non-II, via diversification and foreign exchange income and other income are the two source of Non-II, which significantly affect upon the Non-II diversification and thereby improve shareholders’ risk return tradeoff.
The remainder of this paper proceeds as follows. Section two reviews the relevant literature. Section three provides a description about sampling and research methodology. Section four presents and discuss on research findings. Finally a summary of conclusion is presented with policy implications.
2. LITERATURE REVIEW
The portfolio theory of Markowitz (1952) points out that diversification can decrease risk when individual assets are not fully correlated. If activities that generate Non-II are uncorrelated or at least imperfectly correlated with those that produce interest income, diversification should stabilize operating income and give rise to a more stable stream of profits. The combination of banking, insurance and securities may lead to a more stable profit stream, since the revenues stemming from different products in a conglomerate organization are usually imperfectly correlated. While banks’ net interest margins are highly dependent on interest-rate movements and economic cycles, fee income provides diversification and greater stability for bank profits. If that is correct, it then follows that mixing interest and Non-II will reduce the volatility of earnings.
Many of the research findings suggest that the decision to diversify income sources is desirable for both efficiency and risk management. Existing theories of financial intermediation imply increasing returns to scale linked to diversification. As suggested by Saunders and Walters (1994) banks acquire customer information during the process of making loans that can facilitate efficient provision of other financial services, including underwriting of securities. Similarly, securities and insurance underwriting, brokerage and mutual funds services and other activities can produce information that improves loan making. Thus, banks that engaged in variety of activities could enjoy the economies scopes, which boost performance (Moon, 1996).
Some experts of diversification argue that banks are typically highly levered firms and diversification across sectors reduces their chance of costly financial distress. Similarly, conventional view is that greater competition in the banking industry has increased the need for banks to diversify as lower profits leave fewer margins for error, so diversification provides necessary reduction in risk. Templeton and Severiens (1992) in their study, examined that diversification is associated with lower variance of shareholder returns. As pointed by Mester (1992) mixing of traditional banking activities of originating and monitoring loans with non-traditional activities of loan selling and buying products leads to diseconomies of scope and some economies of scale. Thus, it can be demonstrate that these studies have found that combining traditional and non-traditional bank activities have the potential to reduce risk of bank. It is viewed that, non-interest earnings is more stable than interest income and that increasing share of fee-based activities in a traditional portfolio of banking products reduce overall earnings volatility via diversification effects. Nonetheless, some of prior works on Non-II versus interest income and bank risk have represented several arguments against this conventional wisdom. According to the study conducted by DeYoung and Karin (2001) when an average bank tilt its product mix toward fee-based activities and away from traditional lending activities, the bank’s revenue volatility, its degree of operating and financial leverage, and the level of its earnings increase.
Stiroh (2004a) has attempted to assess how Non-II affects bank’s profit and revenue and to find correlation between the non-traditional activities with the risk indicators. He states that the increase in Non-II in United States commercial banks has not only contributed to higher levels of bank revenue over the time, but also led to the belief that it could reduce the volatility of bank profits and could reduce risk. Further findings suggest that Non-II has become more correlated with Net-II and notes that not only does the increased Non-II negatively impact returns, but it also increases the bankruptcy potential implying that risk adjusted returns are negatively associated with Non-II shares. DeYoung and Karin (2001) and Stiroh (2004a) have found empirical evidence that reliance on non-interest activities increases the volatility of large United States banks. Most of the studies based on the United States and Europe suggest similar results (Stiroh, 2006; Stiroh and Rumble, 2006; Lepetit et al., 2008) and only few evidence on diversification benefits of Non-II and therefore lead risk reduction (Sanya and Wolfe, 2011; Nguyen et al., 2012; Pennathur et al., 2012). DeYoung and Rice (2004) developed an empirical model-determining link between bank Non-II, technological, regulatory and strategic drivers of Non-II. A shift to Non-II has provided banks with higher profits, more variable profits, and a worsening of risk-return trade off. They also suggest that while Non-II is becoming increasingly important for the banking industry, intermediation activities will continue to be the central focus of banks.
While many of the literature indicate a worse risk-return tradeoff for United States commercial banks venturing into Non-II sources of revenues, similar studies on Non-II for European banks provide somewhat different results. Smith et al. (2003) empirically confirmed that European banks are able to seek diversification benefits through combining interest and non-interest activities. In case of European banks, Non-II is indeed more volatile than interest income but, in contrast to United States studies, there are negative correlations between those two income streams. They conclude that non-interest activities potentially stabilize bank earnings. Chiorazzo et al. (2008) show that income diversification increases risk-adjusted returns. Diversification gains from Non-II diminish with bank size that is banks with very small Non-II shares record the most significant gains. Furthermore, their results provide econometric evidence consistent with the current studies of European Union banks, but do not support findings on the United States experience.
In the case of Australian studies most of the researchers (Williams and Prather, 2010; Edirisuriya et al., 2013; Williams and Rajaguru, 2013) confirmed that those banks with lower levels of Non-II and higher revenue concentration are less risky, contrary to mean-variance portfolio theory but consistent with previous international studies. Non-II claims for risk increasing, but some evidence proved that trading and investment income reduces risk in certain circumstances, particularly when bank specialization effects are considered. This means those banks with more concentrated revenue portfolios are best able to exploit this potential benefit, possibly due to closer control and monitoring information asymmetry as well as the positive benefits of specialization. However, this conclusion has the other side that means those banks with higher levels of Non-II will also be considered as riskier. Thus, the tradeoff between these two effects should be monitored (Williams and Prather, 2010).
The literature provides significant evidence of the different influence of Non-II on United States, Europe and Australian banks. However, the transportability of these results to the emerging markets remains an empirical question given the inconsistencies in these patterns evidenced in the western continents. Financial industry of developing economies differs from developed economies with respect to the ownership structure, financial liberalization level and accounting treatment of various sources of income (Thomas and Shawn, 2002). Similar to the backdrop of existing literature, many of the Asian researchers implied that there has a significance relationship between Non-II and the bank profitability (Sanya and Wolfe, 2011; Meslier et al., 2014). In the study of Pennathur et al. (2012) found that fee-based income significantly reduces risk, measured by profitability variables, for public sector banks.
Several researchers believe that bank size perhaps one of the most important characteristic when determining the extent of Non-II. Lepetit et al. (2008) consider the size effects and splitting non-interest activities into both trading activities and commission and fee activities and show, that positive link with risk is mostly accurate for small banks because of increased fee and commission income. A higher share of trading activities is never associated with higher risk and for small banks. Williams and Prather (2010) also suggest that smaller less diversified banks cloud improve their risk and return tradeoffs by increasing their Non-II share. Further, it is believe that revenue diversification interacts with market power which impact on individual bank stability. Banks with high market power become more stable when they diversify their revenue. Also as to the study done by Nguyen et al. (2012) on banks of selected Asian countries suggest that the banks with higher credit losses focus more on revenue diversification. They have concluded that market power and income diversification jointly impact upon the banks stability.
3. RESEARCH DESIGN
3.1. Sample Selection and Variables
This study has considered eleven commercial banks operating in Sri Lanka including six Systematically Important Banks (SIBs) which account for 80 percent of the commercial banking assets of the country as at the end of 2015. Fourteen years’ time was considered from 2002 to 2015 in data collection. An investigation was done to examine the diversification benefits associated with Non-II and Net-II of commercial banks. A comparative analysis was performed between SIBs and small private banks to study the differences of behavior in Non-II and Net-II.
To identify the nature of bank income sources, Net-II and Non-II are scaled by total assets and total operating revenue. Bank Net-II is measured as interest income less interest expense. Bank Non-II is computed as revenues from commissions and fee income, foreign exchange income and other income. In addition to the total assets and total operative revenue, shareholders’ fund used to scale bank Non-II and Net-II. The empirical analysis in this study emphasizes the performance measures scaled by shareholders’ equity for several reasons. First, it represents the returns to shareholders from providing traditional and non-traditional banking activities. Second, regulators, bank management and bank shareholders all have some exposure to bank total risk and so are concerned about returns on shareholders’ fund. This scaling is also consistent with study taken by DeYoung and Karin (2001).
The study employs a correlation analysis to identify the relationship between different scales of Non-II and Net-II. Researcher assumes banks’ revenue is a portfolio which consists with Non-II and Net-II. The study used Coefficient of Variation (CV) to measure the diversification benefits of combing Net-II and Non-II. The main purpose is to compare the riskiness of Non-II and Net-II. Following the analysis of Williams and Prather (2010) the coefficient of variation expresses the standard deviation of returns of income sources as percent of the mean.

Where, бi is the annual standard deviation of returns for income source i over the study period. The denominator of µi is average annual return for the income source i over the study period.
At the CV analysis, researcher has chosen the total assets measure in order to compare the riskiness of each income source. Since the study did not considered about the asset size of the domestic LCBs, combination of Non-II and Net-II are scaled by total assets to identify banks’ efficiency in using its assets to earn the Non-II and Net-II.
The Study employs the risk-adjusted performance ratio (SHARPE) to determine the shareholders risk return trade off. Risk-adjusted performance measurement is considered increasingly important, driven by regulatory pressures and far-sighted shareholder expectations (Piyasena and Corera, 2007). In the multiple regression analysis, SHARPE ratio measures the risk-adjusted ROE of domestic LCBs. This ratio is more or less similar to CV analysis, but provides an accurate measurement than CV analysis (Williams and Prather, 2010).
3.3. Regression Models Specification
The empirical investigation employs two regression models in order to give in depth analysis of Non-II. The model 01 examines the relationship between risk-adjusted performance of ROE with Net-II and Non-II of commercial banks. Model 02 identifies the impact of components of Non-II on the risk-adjusted performance. These two models are similar to the model developed by DeYoung and Rice (2004) which has used to identify the relationship between Non-II and financial performance of United States commercial banks. E-Views statistical software was used in order to run the multiple regressions.
Model 01

Where Net-IIit is the Net-II of bank i for the fourteen years periods, Non-IIit displays Non-II earned by bank i for the study period, αit represents the constant term and the eit measures the residual term of the model.
Model 02

Where, FEEit represents fee and commission income of bank i for the fourteen year period, FOREXit displays the foreign exchange income earned by bank i for the sample period, OTHERit shows the other income including dividend income, sale of property plant etc. of bank i for the sample period. The αit represents the constant term while eit measures the residual term of the model.
Both models incorporated one dependent variable called SHARPE ratio. SHARPE ratio developed by Sharpe (1966) that is used to measure risk-adjusted performance. This ratio adopted by DeYoung and Rice (2004) to gauge the how Non-II is related to bank financial performance. SHARPE was computed as the difference between ROE for bank i and annual return for risk free asset over the sample period, divide by the standard deviation of ROE for the sample period. To compute the risk free rate average of 91days, 182 days and 365 days Treasury bill rate obtained from the Central Bank of Sri Lanka (CBSL). Then ROE of each bank was deducted from annual return for Treasury bill rate.
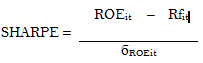
Where, ROEit represents Return on Equity before tax for bank i for the sample period, Rfi displays the average annual return of Treasury bill rate over the sample period and бROEit is the annual standard deviation of ROE for the sample period. Income source i displays for Non-II and the Net-II.
The SHARPE ratio expresses the average excess return as a percentage of the standard deviation of returns. By subtracting a risk-free return, the numerator represents a risk premium and a ratio can be interpreted as the excess return per unit of a risk. Thus given the coefficient of explanatory variables the dependent variable, SHARPE, describe the relationship between these two variables.
4. EMPIRICAL RESULTS
4.1 Descriptive Statistics
As to the descriptive statistics presented in table 1, interest income still provides the major proportion of bank total income, accounting for 66.55 percent. The standard deviation of 9.41 indicates that Net-II to total income can deviate by 9.41on average. The highest contribution of Net-II to total income is 89 percent while lowest is 19.03 percent. The contribution of Non-II to total income provides 33.44 percent on average. The maximum of Non-II to total income is 80.9 percent while lowest is 10.7 percent. The total assets measure describes the banks’ profitability in using its assets to generate Net-II and Non-II. The level of Non-II as a proportion of total assets holds on average 2.02 percent.
Table-1. Descriptive statistics of Non-II and Net-II
| Mean | Maximum | Minimum | Standard deviation | |
| Net-II/Total net income | 66.554 | 89.200 | 19.037 | 9.411 |
| Non-II/Total net income | 33.445 | 80.962 | 10.799 | 9.411 |
| Net-II/Total assets | 3.989 | 6.432 | 0.445 | 0.963 |
| Non-II/Total assets | 2.022 | 13.952 | 0.676 | 1.266 |
Number of observations 109
Net-II to total assets represents high profitability compared to Non-II and recorded as 3.98 percent on average. This means banks are effectively using its assets to generate earnings from intermediation activities than fee-based activities.
Table 2 represents Coefficient of Variation (CV) in order to compare the risk of assets with varying averages to their expected return. CV of Non-II to assets recorded a 62.61 percent indicating a risky income source relative to the Net-II to total assets while Net-II to total assets has a lower standard deviation of 0.963 with high mean value of 2.022. Hence, CV of Net-II to total assets presented a low value which is 27.16 percent indicating that Non-II is much more risky income source compared to Net-II. CV analysis is consistent with the international evidence, which suggest Non-II is indeed more volatile source of income relative to the Net-II.
Table-2. Risk and return of income sources
| ROE | Net-II/ | Non-II/ | (Net-II+Non-II)/ | |
| Assets | Assets | Assets | ||
| Mean | 36.703 | 3.989 | 2.022 | 6.01 |
| Standard deviation | 186.33 | 0.963 | 1.266 | 1.61 |
| CV | 507.664 | 27.16 | 62.616 | 26.796 |
Note: CV; coefficient of variation; б/µ* 100; these statistics are calculated using the overall (panel) means and standard deviations.
Furthermore, the combination of Non-II and Net-II to total assets has recorded a CV value as 26.79 percent. The degree of dispersion of both income sources is 1.61 while mean return is 6.01. Thus, the return gained from the combination of Non-II and Net-II are enabled to reduce the volatility of both income sources indicating that combination of income sources is better at maintaining the high return for shareholders in the commercial banks. The CV of ROE used to measure the relative variability of ROE. ROE has reported a CV of 507.66 percent and a low standard deviation of 186.33 representing that ROE of banks shows a high degree of profit variability.
For the entire sample the correlation between Non-II and Net-II consistently positive. Non-II scaled by equity shows a strong positive correlation with the Net-II. This provides negative signal for income source diversification. Further, the combination of Non-II and Net-II scaled by equity presents a strong correlation of 0.998 with Non-II which shows higher the Non-II higher the total net income. It is worth noting that ROE shows a positive correlation with Non-II scaled by equity. This implies returns to shareholders before tax are increased by increased Non-II for the domestic LCBs. In the case of Non-II scaled by total assets, displays low correlation, 0.025, between the Non-II and Net-II. The Non-II scaled by total assets presents a weak positive correlation with the Net-II while the combination of Non-II and Net-II shows the negative correlation with the Non-II.
The table 3 provides the results for regression equation of the model 01, which is tested for the 11 domestic commercial banks in order to determine the relationship between the risk-adjusted ROE with Non-II and Net-II.
Table-3. Effect of Non-II and Net-II on the risk adjusted ROE of domestic LCBs
Dependent Variable: SHARPE Method: Least squares Sample:1 154 |
||||
| Included observations: 153 | ||||
| Variable | Coefficient | Std. Error | t-Statistic | Prob. |
| C | 0.5571 | 0.1787 | 3.1161 | 0.0024** |
| Non-II | 0.0004 | 0.0001 | 4.1111 | 0.0001*** |
| Net-II | -8.80E- | 3.95E- | -2.2295 | 0.0279** |
| R-squared | 0.1916 | F-statistic | 12.5661 | |
| Adjusted R-squared | 0.1764 | Prob (F-statistic) | 0.0000*** |
Significant at ***=1, **=5 *=10 percent significance level.
Initially the regression model 01 estimate the goodness of fit to identify whether model could fit into data. Multiple regression analysis presents an F-value of 12.5 with probability value of 0.00001. It is statistically significant at 1percent significance level as the probability value is less than 0.01. This implies that as a whole all the independent variables have a significant impact upon the dependent variable, which means the shareholders risk return tradeoff has significant impact from Non-II and Net-II. The R-squared or Coefficient of determination is 19.1percent. It shows the other 80.9 percent variance in risk-adjusted ROE remains unexplained by Non-II and Net-II. Non-II is a significant variable in explaining the risk-adjusted return of the domestic commercial banks as the probability value is less than 0.01. The positive coefficient on Non-II indicates that marginal increase in Non-II insignificantly improve the risk adjusted ROE of commercial banks. Net-II has a significant relationship with risk-adjusted ROE of domestic commercial banks. The probability value and t-statistic value indicating that the relationship between Net-II and risk adjusted ROE statistically significant. Net-II presents a negative coefficient. Thus, increase in one percentage of Net-II which in turn leads to decrease the profit per unit of risk of domestic commercial banks. Overall the results indicate that Non-II has a significant influence on the risk-adjusted ROE of domestic commercial banks over the considered period.
Table-4. Effect of Non-II components on the risk adjusted ROE
Dependent Variable: SHARPE Methods: Least squares Sample: 1 154 |
||||
| Included observations: 153 | ||||
| Variable | Coefficient | Std. Error | t-Statistic | Prob. |
| C | 0.5624 | 0.1795 | 3.1326 | 0.0023** |
| FEE | 0.0004 | 0.0002 | 1.4287 | 0.1561 |
| OTHER | 0.0004 | 0.0001 | 2.3922 | 0.0185** |
| FOREX | 0.0007 | 0.0002 | 2.5067 | 0.0137** |
| R-squared | 0.2036 | F-statistic | 6.6468 | |
| Adjusted R-squared | 0.1729 | Prob(F-statistic) | 0.0000*** |
Significant at ***=1, **=5 *=10 percent significance level.
The above regression results were derived by using the independent variables which consist with three component of Non-II that is fee and commission income, foreign exchange income and other income. The objective is to determine that which Non-II component has a major influence on the risk-adjusted ROE of domestic LCBs. The regression model displays F-value of 6.646 with a probability value of 0.000 and it is statistically significant at 1 percent significance level. According to the R2 value the risk adjusted ROE of the domestic commercial banks explained by the four independent variables is 20.36 percent. This implies the other 79.64 percent remained as unexplained independent variables.
The results proved that the foreign exchange income has a statistically significant relationship with risk-adjusted ROE of domestic commercial banks. A marginal increase in foreign exchange income resulted in improving the risk-adjusted ROE by 0.0007. It is worth noting that fee and commission income is not statistically significant. The probability value and t-statistic value proves that the other income category is statistically significant .The positive coefficient of this category shows that a marginal increase will improve risk and return trade-off of shareholders of domestic commercial banks.
5. DISCUSSION OF FINDINGS
The empirical evidence suggests that Net-II is less risky than the Non-II. This is consistent with the previous research of DeYoung and Karin (2001) where they presents several arguments contending that Non-II may in fact be less stable than interest income. Similarly Smith et al. (2003) and Stiroh (2004b) found that Non-II is indeed more volatile than interest income for commercial banks. Though Non-II presents as risky income source the findings of the study suggests that Non-II is a source of diversification for bank income in Sri Lanka. This is differ from the United States studies such as Stiroh (2004a); Stiroh and Rumble (2006) but consistent with the European studies by Smith et al. (2003) and Davis and Tuori (2000) where they argue that venturing into Non-II generate diversification benefits thus stabilizing the variability of total income of commercial banks.
Therefore, this study confirms that there is a potential diversification benefits associated with the combination of Non-II and Net-II of domestic LCBs in Sri Lanka. This is borne out by comparing the CV of total income with those of Net-II and Non-II. The correlation analysis showed that there is a weak correlation between Non-II and Net-II. This is complied with the results laid down by Williams and Prather (2010) and Smith et al. (2003) where they found combining Non-II and interest income have the potential to reduce risk of a bank. They argue that weak correlation between those two income streams may enable to stabilize bank earnings. Findings of the current study, can be further validated by portfolio theory of the Markowitz (1952). He discussed the ideas of portfolio risk, diversification, and correlation of returns on assets. Using standard deviation of returns as the measure of portfolio risk, Markowitz (1952) confirmed that, by choosing assets whose returns are not perfectly positively correlated, the risk of a portfolio could be lowered while maintaining or increasing the expected return. Hence, if Non-II is uncorrelated or at least imperfectly correlated with those that produce interest income, diversification should stabilize operating income and give rise to a more stable stream of profits.
With regard to shareholders’ risk return tradeoff, Non-II and Net-II have statistical significant relationship with risk adjusted ROE. Non-II presents a positive relationship with risk-adjusted ROE, implying a marginal increase in Non-II which improves shareholders’ risk return tradeoff. This complied with the findings laid down by Chiorazzo et al. (2008). Further researcher suggests that bank size and loan quality are main drivers for this positive association. Interestingly, economies of scale and the capability of investing more intensively in information technology allow larger banks to manage the operating leverage associated with fee-based transactions (DeYoung and Karin, 2001) much better than small-sized banks. Banks with poor loan quality, as assessed by net non-performing advances to total advances, tend to rely on Non-II sources of income (Pennathur et al., 2012). This finding is important, particularly as Sri Lankan commercial banking sector is confronted with a burning issue of non-performing loan and advances (Ekanayake and Azeez, 2015; Ekanayake and Fernando, 2015).
Conversely, Net-II has a negative relationship with risk-adjusted ROE which indicates a marginal increase in Net-II worsening the shareholders’ risk return tradeoff. Researcher emphasises that the poor asset quality negatively affect the risk-adjusted ROE of commercial banks. The study suggests Non-performing loans and loan loss provisions have a positive relationship with Net-II and this positive association overcome the benefits exposed by the shareholders. It is evident from the table 5, that non-performing loans ratio has increased while risk-adjusted ROE has declined over the period .This is consistent with results presented by Kick and Busch (2009). They argued that loan loss provision has a positive relationship with Net-II which negatively impact upon the risk-adjusted returns of the commercial banks. Besides, this finding provides an important implication on the managers on maintaining proper risk management process and systems to mitigate adverse impact of non-performing loans.
Table-5. Risk adjusted ROE and asset quality measures
| Year | Risk-adjusted ROE | Non-performing assets/ total loans and advance |
| 2002 | 3.21 | 8.20 |
| 2003 | 3.81 | 12.5 |
| 2004 | 3.78 | 9.00 |
| 2005 | 3.13 | 6.80 |
| 2006 | 3.00 | 5.50 |
| 2007 | 1.75 | 5.00 |
| 2008 | 1.25 | 6.00 |
| 2009 | 2.56 | 8.20 |
| 2010 | 3.60 | 5.10 |
| 2011 | 3.79 | 4.10 |
| 2012 | 3.95 | 4.08 |
| 2013 | 3.57 | 5.40 |
| 2014 | 4.10 | 4.80 |
| 2015 | 3.68 | 4.35 |
Source: Researcher’s Creation
From the Non-II components, foreign exchange income and other income have a statistical significant relationship with risk adjusted ROE. As shown in the pie chart (Figure 1), foreign exchange income holds a considerable position in Non-II. Notably Sri Lanka has higher trend in foreign exchange income than other counterparts.
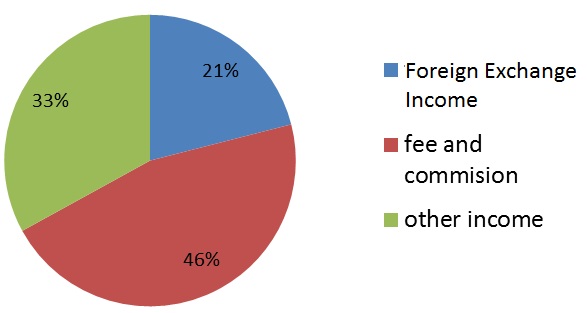
This is because large proportion for the foreign remittances section of the foreign exchange gains from the favorable economic condition in the country, particularly from the rupee depreciation. In Bank of Ceylon, one of a leading public commercial bank, foreign exchange income contributed 38 percent of total income in 2004 and increased by over 150 percent due to a greater depreciation of the Sri Lankan rupee (Bank of Ceylon Annual Report, 2010). However, fee and commission income has shown insignificant relationship with shareholders’ risk return tradeoff. However, this evidence is not consistent with that of United States carried out by DeYoung and Rice (2004) and in Australia done by Williams and Prather (2010) where they argue that fee based income has significant relationship with risk adjusted ROE of commercial banks. Consistent with the DeYoung and Rice (2004) the study suggest that fee based income is affected by regulatory factors, economic factors and bank characteristics. Hence, it remains possible that external factors will alter the relationship between fee income and shareholders’ risk return tradeoff. Therefore, empirical evidence of the study suggests that foreign exchange and other income are the most influential Non-II components which improve the risk adjusted ROE of commercial banks. Finally, these results provide important implication for bank stakeholders, in determining the potential diversification benefits associated with Net-II and Non-II.
6. CONCLUSION
This study attempts to identify the impact of income source diversification on the shareholders risk return tradeoff of commercial banking institutions in Sri Lanka. It has tested Non-II and risk adjusted performance of domestic commercial banks, through multiple regression analysis. The results give evidence of potential diversification benefits associated with the combination of Non-II and interest income. Further, it verifies that diversified income improves the risk adjusted ROE of commercial banks. A summary of the overall findings of this study is as follow.
Table-6. Summarized results of the study
Relationship with risk adjusted ROE NonII, NetII and Components of NonII |
Domestic LCBs
|
| NonII | Significant (positive)*** |
| NetII | Significant (Negative)** |
| foreign exchange income | Significant (Positive)** |
| fee and commission income | Not Significant |
| other income | Significant ( Positive)** |
Significant at ***1%, **5% and *10% significance level.
Overall, the results suggest that shareholders of banks benefit from increased bank exposure to Non-II via diversification of income. Predominantly, foreign exchange income and other income are the two source of Non-II which significantly impact upon the Non-II diversification and thereby improve shareholders’ risk return tradeoff. In addition to that fee and commission income, do not show statistical significant relationship with risk-adjusted return in domestic commercial banks. According to descriptive statistics, Sri Lankan commercial banking sector still identify interest income as a major source of bank income. In addition, CV analysis shows that Net-II less risky than the Non-II. Therefore, it remains possible that diversification benefits associated with Non-II will decline with the increased Non-II activities. However, it should be noted that shareholders should monitor the bank exposure to Non-II to ensure that they do not become over exposed to the point where the volatility outweighs the diversification benefits.
Findings of the study reveal several policy implications. In the light of the bank income source diversification, bank increased exposure to Non-II may be inevitable evolutionary process changing the nature of risk and return tradeoff in banking and this process should be monitored by regulators of the banks. Further, because of increased importance of activities generating Non-II, banks’ operational, reputational and strategic risks seem to be heightened. The increased relevance of these categories of risk has made the task of the supervisors more complex, which requires more focus on other categories of risk. With the view of Basel II, capital adequacy framework, the results of study may support arguments in favor of specific capital requirements for other categories of risk in addition to credit and market risks. Further, this study contributes in improving the understanding of market pricing of bank risk. Such an improved pricing for risk provides an avenue for potentially reducing a recurrence of a financial crisis.
| Funding: I wish to express my gratitude, to the staff of licensed commercial banks in Sri Lanka, which considered for this study, for their support in accessing the sources and materials in data collection. |
| Competing Interests: The authors declare that they have no competing interests. |
| Contributors/Acknowledgement: Both authors contributed equally to the conception and design of the study. |
REFERENCES
Allen, F. and A.M. Santomero, 2010. What do financial intermediaries do? Journal of Banking and Finance, 25(2): 271-294. View at Google Scholar | View at Publisher
Arun, T.G. and J.D. Turner, 2004. Corporate governance of banks in developing economies: Concepts and issues. Corporate Governance, 12(3): 371-377. View at Google Scholar | View at Publisher
Bank of Ceylon Annual Report, 2010. Sri Lanka.
Chiorazzo, V., C. Milani and F. Salvini, 2008. Income diversification and bank performance: Evidence from Italian banks. Journal of Financial Services Research, 33(3): 181–203. View at Google Scholar | View at Publisher
Davis, P.E. and K. Tuori, 2000. The changing structure of banks’ income: An empirical investigation. Economics and Finance Working Paper, Brunel University.
DeYong, R. and G. Torna, 2013. Nontraditional banking activities and bank failures during the financial crisis. Journal of Financial Intermediation, 22(3): 397-421. View at Google Scholar | View at Publisher
DeYoung, R. and P.R. Karin, 2001. Product mix and earnings volatility at commercial banks: Evidence from a degree of total leverage model. Journal of Financial Intermediation, 10(1): 54 -84. View at Google Scholar | View at Publisher
DeYoung, R. and T. Rice, 2004. Non–interest income and financial performance at US commercial banks. Financial Review, 39(1): 101-127. View at Google Scholar
Edirisuriya, P., A. Gunasekarage and M. Dempsey, 2013. Australian specific bank features and the impact of income diversification on bank performance and risk. Australian Economic Papers, 54(2): 63-87. View at Google Scholar | View at Publisher
Ekanayake, E.M.N.N. and A.A. Azeez, 2015. Determinants of non-performing loans in licensed commercial banks: Evidence from Sri Lanka. Asian Economic and Financial Review, 5(6): 868-882. View at Google Scholar | View at Publisher
Ekanayake, E.M.N.N. and W.D.I. Fernando, 2015. Do commercial banks use loan loss provisions to smooth their income? Empirical evidence from Sri Lankan commercial banks. Journal of Finance and Bank Management, 3(1): 167-179. View at Google Scholar | View at Publisher
Fitch Rating Report, 2009 & 2014. Sri Lankan banking sector. [Accessed 17 May 2014].
Kick, T. and R. Busch, 2009. Income diversification in the German banking industry. Journal of Financial Services, 33(4): 181-203. View at Google Scholar
Lepetit, L., E. Nys, P. Rous and A. Tarazi, 2008. Bank income structure and risk: An empirical analysis of European banks. Journal of Banking and Finance, 32(8): 1452-1467. View at Google Scholar | View at Publisher
Markowitz, H.M., 1952. Portfolio selection. Journal of Finance, 7(1): 77–91. View at Google Scholar
Meslier, C., R. Tacneng and T. Amine, 2014. Is bank income diversification beneficial? Evidence from an emerging economy. Journal of International Financial Markets, Institutions and Money, Elsevier, 31(C): 97-126. View at Google Scholar | View at Publisher
Mester, L., 1992. Traditional and non-traditional banking: An information-theoretic approach. Journal of Banking and Finance, 16(3): 545-566. View at Google Scholar | View at Publisher
Moon, G., 1996. Efficient banking under interstate branching. Journal of Money Credit and Banking, 28(4): 1045-1071. View at Google Scholar | View at Publisher
Nguyen, M., M. Skully and S. Perera, 2012. Bank market power and revenue diversification: Evidence from selected ASEAN countries. Journal of Asian Economies, 23(6): 688-700. View at Google Scholar | View at Publisher
Pennathur, A.K., V. Subrahmanyam and S. Vishwasrao, 2012. Income diversification and risk: Does ownership matter? An empirical examination of Indian banks. Journal of Banking & Finance, 36(8): 2203–2215. View at Google Scholar | View at Publisher
Piyasena, B. and A. Corera, 2007. Is it worth the risk? A framework for pricing credit risk. Paper Presented at the 20th Anniversary Convention of Association of Professional Bankers in Sri Lanka.
Sanya, S. and S. Wolfe, 2011. Can banks in emerging countries benefit from revenue diversification? Journal of Financial Services Research, 40(1-2): 79-101. View at Google Scholar | View at Publisher
Saunders, A. and I. Walters, 1994. Universal banking in the United States: What could we gain? What could we lose? New York: Oxford University Press.
Sharpe, W.F., 1966. Mutual fund performance. Journal of Business, 39(1): 119–138. View at Google Scholar
Smith, R., C. Staikouras and G. Wood, 2003. Non-interest income and total income stability. London: Bank of England, Working Paper No. 198.
Stiroh, K., 2004a. Diversification in banking: Is non-interest income the answer? Journal of Money, Credit and Banking, 36(4): 853-882.
Stiroh, K., 2004b. Do community banks benefit from diversification? Journal of Financial Services Research, 25(2): 135-160.
Stiroh, K., 2006. New evidence on the determinants of bank risk. Journal of Financial Service Research, 30(3): 135-160. View at Google Scholar
Stiroh, K. and A. Rumble, 2006. The dark side of diversification: The case of US financial holding companies. Journal of Banking and Finance, 30(8): 2131-2161. View at Google Scholar | View at Publisher
Templeton, W. and J.T. Severiens, 1992. The effect of non-bank diversification on bank holding companies. Quarterly Journal of Business and Economics, 31(4): 3-16. View at Google Scholar
Thomas and Shawn, 2002. Firm diversification and asymmetric information: Evidence from analysts' forecast and earnings announcements. Journal of Financial Economics, 64(3): 373-396. View at Google Scholar | View at Publisher
Williams, B. and L. Prather, 2010. Bank risk and return: The impact of bank non-interest income. International Journal of Managerial Finance, 6(3): 220-244. View at Google Scholar | View at Publisher
Williams, B. and G. Rajaguru, 2013. The chicken or the egg? The trade-off between bank fee income and net interest margins. Australian Journal of Management, 38(1): 99-123. View at Google Scholar | View at Publisher
| Views and opinions expressed in this article are the views and opinions of the author(s), Asian Economic and Financial Review shall not be responsible or answerable for any loss, damage or liability etc. caused in relation to/arising out of the use of the content. |