


DETERMINANTS OF EXPORTS COMPETITIVENESS: AN EMPIRICAL ANALYSIS THROUGH REVEALED COMPARATIVE ADVANTAGE OF EXTERNAL SECTOR OF PAKISTAN

1Ph.D Scholar at College of International Education, Tianjin University of Finance and Economics, Tianjin China
2President of College of International Education, Tianjin University of Finance and Economics, Tianjin, China
ABSTRACT
In this paper, we have endeavored to analyze a sector-wise export performance of Pakistan using Revealed Comparative Advantage with the global market. Data for the period 2003-2015, Harmonized System (HS) 1988/92 developed by the World Customs Organization (WCO) are employed in the analysis. We have observed that Pakistan foreign trade concentrated limited products and markets for many years and there are no serious attempts to diversify its export share to the world. Empirical results show that Pakistan is not a major trading player in the international trade. However, it is a major trading player in some of its export items such as, textile and clothing sector, Vegetable, and hides and skins sector which have prominent revealed comparative advantage. Pakistan should diversify its exports and improve its trade diplomacy.
© 2017 AESS Publications. All Rights Reserved.
Keywords : Revealed comparative advantage, Determinants of exports, Pakistan exports competitiveness, Pakistan foreign trade.
Article History : Received: 16February 2017, Revised: 15March 2017, Accepted: 29March 2017, Published: 24April 2017
Contribution/ Originality: The paper's primary contribution is finding of export performance of Pakistan using Revealed comparative advantage (Balassa index) for all external sectors. Empirical results revealed that some sectors in Pakistan have export potential with the world that can help Pakistan to reduce its chronic trade deficit.
1. INTRODUCTION
Apart from foreign direct investment exports has been one of the determinants of upholding higher economic growth, better schooling and life expectancy due to their assimilation in the world economy. Developing countries like Pakistan can enlarge their markets by allowing firms exporting and achieving economies of scale. Exporting is one of the prominent channels of technology transfer to other nations (Pack, 1993). Normally industrial policies are prepared to stimulate exports (see figure A intheappendix for foreign trade flow of Pakistan). The export competitiveness or export performance generally can be measured by several factors, for instance, real exchange rate, comparative advantage, terms of trade, geographic concentration, trade policies, world income etc. We have employed Revealed Comparative Advantage (RCA) to check export competitiveness of Pakistan. This study will examine the determinants of export performance of external sector of Pakistan with help of RCA Balassa index. Trade policy in Pakistan has a significant role in growing or lessening overall exports of Pakistan. Pakistan’s economy has depended on the agricultural sector in the premature stages of development, because of lacking in industrial base and infrastructural capability in the early stage of development. Consequently, efforts were put to construct a strong industrial base for industrial and as well as for Pakistan’s development. Due to favorable export policies for example reduction in tariffs and other nontariff measures changed and modestly improved the export pattern of Pakistan. The export patterns of various exports are altering globally owing to liberalization and technological improvements. These adjustments have caused changing the comparative advantage and additions in productivity of different commodities and sectors of world economies.
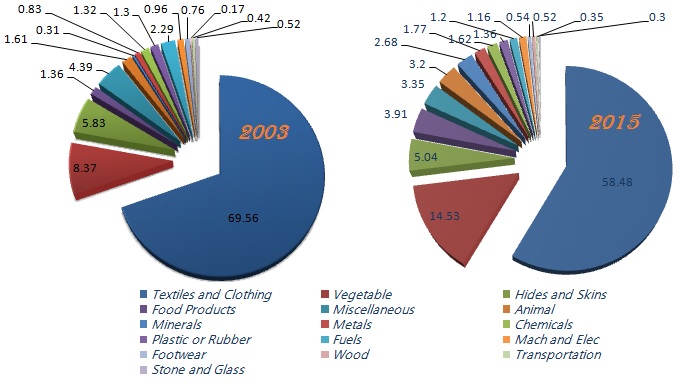
Figure-1. Comparative analysis of total Exports by product share of Pakistan to World market (Percentage Share)
Source: Authors own calculations based on World Integrated Trade Solution 2016.
Figure 1 demonstrates the story behind product exported by Pakistan to the global World. Textile and clothing sector prominent and haveamajor share in Pakistan’s exports since many years. Pakistan's export commodities do not prove any noteworthy change over the years. For the last few years, Pakistan’s exports are showing a waning trend. International trade without any quota restrictions has formed opportunities for developing and emerging countries. Several countries availed this opportunity and strengthened their exports, whereas others abortive to take advantage. Pakistan was among the latter category. Economic hypothesis and empirical evidence have obviously established the relations between trade, productivity, and economic development. Countries that have bulky internal markets have also gained from desegregation into the global economy and opening up their economies (Muhammad, 2017).
Pakistan has been aggressively pursuing an open gate economic policy over the past decades. It was the first country in South Asia that adopted a liberal economic policy by deregulating and lessening government control, encouraging theprivate sector, and privatizing state’s assets and liabilities (Muhammad, 2016). Pakistan at present faces big threats from the major giants’ competitors in the region. Some Asian economies like Bangladesh, India, China, Thailand, South Korea and Malaysia are enjoying a better share of exports in the present circumstances across the world, predominantly after liberalization. In these changing circumstances, fast global changing in export pattern and economic achievements of several Southeast Asian economies present an example to Pakistan to follow up export-led growth strategies. Pakistan’s external sector such as textile and clothing has a potential to compete in both hindered and unhindered markets and to accomplish higher productivity growth. Certainly, trade liberalization generates competitiveness and transfers technology that directs to productivity growth. Consequently, it was thought that quota elimination would have led to changes in export structures of textile and clothing sector of Pakistan through comparative advantage (Nawaz and Rukhsana, 2013). The export competitiveness or export performance generally can be measured by several factors, for instance, real exchange rate, comparative advantage, terms of trade, geographic concentration, trade policies, world income etc. However, the standard practice is to use revealed comparative advantage index. This part of the study examines the determinants of export performance of external sector of Pakistan with help of RCA Balassa index. RCA index determines export performance and export pattern of countries.
2. REVIEW OF LITERATURE
There are some studies done by researcher and policy makers to highlight the determinants of exports competitiveness such as Mahmood (2004)used RCA Balassa index to calculate comparative advantage for the nonagricultural sector of Pakistan. RCA index can be used for commodity specific and region specific but cannot conclude the future comparative advantage. Rahmaddi and Ichihashi (2012) investigated competitiveness of manufacturing exports and export’s structure for Indonesian economy by using RCA measure. Their study concluded that export performance of Indonesia deteriorated due to product concentration or deficiency of diversification product composition. Amongst other causes of deteriorating the export performance of Indonesian economy was the specialty in those products which utilize abundant natural resources and unskilled labor. Hence study concluded that Indonesian economy depends on the export of stumpy and intermediate technology which was not successful in improving its export performance.
A country’s share in the global market can be diverse by a number of factors. Deficiency of infrastructure and macroeconomic volatility may deteriorate country’s export performance. In addition, poor governess, resources endowments and degree of technology affect overall performance and export competitiveness of an economy. The geographic position of a country, cultural similarities and its relation with the trading partner also influence the export performance of a country. A study conducted by Amador and Cabral (2008) using constant market share analysis of Portuguese economy for the time 1968-2006. Explains the results of a market share of Portugal to the world export were compared with benchmark countries such as Ireland and countries of South Europe. The study also compared manufactured exports enlargement and world exports expansion and originate that if Portuguese exports growth is higher than the world export growth than its share will be higher in the world market. A stable market share analysis fragmented country’s growth of its exports into four core components. Foremost component explains that boost in world exports also affects the export level of a country. The second factor explains production composition effect which may transform country’s competitive advantage because of specialization in products. Thirdly export concentration that is calculated by market distribution effect which amplifies actual exports due to elevated share in the market. The study also revealed that market distribution effect is a most important component in measuring market share.
Today’s World in the epoch of globalization seeing as the beginning of the third millennium because economies started out to be integrated since then in terms of goods, traditions, trade, investments and various others factors (Muhammad, 2016). Despite, export demand and export supply play a significant role in changing export shapes through comparative advantage. Theoretically,comparative advantage occurs from factor endowments and from differences in technology (Ruffin, 1988). In a market economy, export ascertains revealed comparative advantage and this way is compatible with the traditional approach of factor endowment of comparative advantage. The RCA calculation does not differentiate factor endowment effect as of trade policy effect. Furthermore, it provides a signal on the movement in the comparative advantage of every region. Nevertheless, different trade theories provide dissimilar determinants of comparative advantage, for instance, Ricardian considered cost and technological dissimilarities as determinants of comparative advantage. Alternatively, Samuelson (1948) measured factor price differences as determinants of comparative advantage. The Neo-Factor-Proportion theory paying attention to factor efficiency while product cycle model by Posner (1961) enlightened that technological innovation is a cause of differences in comparative advantage. In the later time, Memedovic (1994) explained a type of state for example (organizational capacity, mode of intervention and class base) and regime (Government) intervention can bring alterations in comparative advantage. The trade policies differentials between Latin American along with East Asian region are responsible for variation in comparative advantage and not caused by factor endowment.
3. OBJECTIVES OF THE STUDY
The objective of the study is to distinguish the competitiveness of Pakistan’s external sector over the period 2003 to 2015 with theglobal market and various selected Asian countries. This study examines comparative advantage of Pakistan’s external sector through revealed comparative advantage (RCA)(Balassa, 1965) at Harmonized System (HS 2-digits, 1988/92) aggregative level. The Present study goal is to provide a qualified position of leading sectors such as textile and clothing, Hides and Skins, aVegetable sector of Pakistan in the foreign markets and with major trading partners.
4. THEORETICAL FOUNDATION OF REVEALED COMPARATIVE ADVANTAGE
To estimate a country’s comparative advantage or comparative disadvantage in commodities, industries or sectors many researchers uses standard approach or methodology for RCA index. Theoretically, we can measure comparative advantage in requisites of relative prices, when there is no trade. We have borrowed theoretical foundation of RCA from Nawaz and Rukhsana (2013). In accordance with Ricardian theory, comparative advantage happens due to technological dissimilarities across nations, whereas the H-O theory considers cost dissimilarities occurs due to differences in factor prices across countries, assuming constant technology. Hence, we summarize that trade theories in the classical framework are based on the pre-trade relative price differentiations across countries. Although measuring comparative advantage through H-O theory has several constraints, predominantly,thepre-trade relative price is immeasurable (Balassa, 1989). Because of these difficulties,Balassa (1965) suggested that it is not essential to observe all ingredients disturbing comparative advantage of any country rather one should examine patterns of trade. Consequently, data on exports clarifies revealed comparative advantage, which is practicable and commonly accepted the measure. Balassa Index is only paying attention to estimating comparative advantage of any nation instead of focusing on determining its sources. Nevertheless, after (Balassa, 1965) number of studies improved the definition of RCA such as Memedovic (1994);Donges and James (1977);Vollrath (1991)andBowen (1983) etc. Another range of RCA indices comprises Normalized Revealed Comparative Advantage Index (NRCA) that gives comparison over time and space (Yu et al., 2009). A number of measures estimate comparative advantage in bilateral trade such as Dimelis and Gatsios (1995). Nevertheless, Liesner (1958) first time empirically studied RCA by subsequent measure

Where Xij is the export of country i for j commodity or industry and n represent set of countries.
Balassa (1965) considered a comprehensive measure that is widely accepted in literature. The RCA Balassa index is expressed as following
 .
.
Where Xij is the export of country i, for, j commodity and n is a set of all exported commodities of country i, while Xwj represents the export of world for same commodity j and Xwn is a world export of all n commodities. According to the results of this index if RCA2>1 then a country has a comparative advantage, if RCA2<1 then a country has a comparative disadvantage in that commodity or industry. Another RCA by Balassa explains Net Export Ratio (NER) takes into account the possibility of imports and exports simultaneously but it checks trade performance its own not with any reference country or rest of the world. This index is shown as following.

This index ranges from -1 to +1 and in the case of Xij = 0 there will be revealed comparative disadvantage but if Mij = 0 there will comparative advantage. However, zero value creates ambiguity (Greenaway and Milner, 1993). Another version derived from the Balassa index captures the effect of imports and this index can be written as following.

Here Xij ,Mij are exports and imports of country i for j commodity or industry respectively, while Xit ,Mit are exports and imports of i country fort set of commodities or industries.
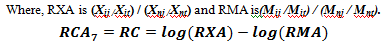
In another index derived from Balassa (1965) logarithm of export to import ratio is taken. This index can be shown as following

Vollrath (1991)suggested three alternative indices for the measurement of comparative advantage. These indices are called Relative Trade Advantage (RTA) Revealed competitiveness (RC) and Relative Export Advantage (REA). The positive values obtained in theses indices indicate comparative advantage while negative values point out comparative disadvantage. But these indices have a drawback of distorting trade patterns when government intervenes in trade policies through export subsidies and import restrictions. Greenaway and Milner (1993) suggested using a price-based measure of RCA to avoid these distortions in trade pattern caused by policy intervention and this measure is called implicit revealed comparative advantage (IRCA). Vollrath (1991) confesses that revealed export advantage index may be used commonly because it reduces the effects of distortions. One must remember that indices suggested by Balassa and Vollrath are not comparable as these are based on different circumstances and concepts. RTA shows the difference between relative export and relative import advantage is calculated as mentioned below.

Vollrath (1991) published another measure of comparative advantage in Logarithm form. Where captures the difference of relative export and import advantage in logarithm. Some authors tried to overcome the problems of Balassa (RCA) including Laursen (2000);Proudman and Stephen (1998);Hoen and Oosterhaven (2006). Although authors at thedifferent time provided alternative measures but no one succeeded in rule out all shortcomings and still Balassa index is recognized as astandard index, Yu et al. (2009). The index developed by Yu et al. (2009) estimates the degree of deviation of its actual export over time from neutral level i.e. (comparative advantage). This index is called normalized revealed comparative advantage index (NRCA). In the present study, we prefer using Balassa index because foreign trade sector of Pakistan exports and its commodities to the rest of the world under conditions imposed by World Trade Organization (WTO) but not by any strong domestic trade policy intervention. Therefore, factors determined by domestic policies may not influence exports data. According to Balassa exports data is enough to measure RCA. On the other hand,Balassa is also considered standard index for comparative advantage.
5. METHODOLOGY AND SOURCE OF DATA
The Balassa (1965) of RCA is defined as a country’s share in global exports of a commodity/product divided by its share of total worldwide exports. First, we will estimate RCA of all external sectors of Pakistan against global market. Second, calculate top three sectors where Pakistan has a comparative advantage over competitors in the region and in the end to compare top three sectors of Pakistan with major competitors in the region. Finally, we will categorize the comparative analysis of Pakistan with his competitors such as India, China, Bangladesh, Indonesia, Thailand, Malaysia, Vietnam, and Taiwan. For this purpose, annual data has been taken from the website of WTO, WITS, and UNCTAD. Data is taken in million USD for RCA analysis. The study may also facilitate in understanding the composition of goods traded between Pakistan and global market. The outcomes will also help to realize if Pakistan has RCA for the same goods in its bilateral trade with other countries as in the trade with the whole world. We have shortlisted the commodity categories at the HS-2 digit level. We have analyzed all external sectors of Pakistan time period 2003 to 2015. This index is calculated as follows;
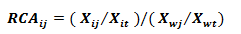
Where Xijis the export of country i, for, j commodities and t is set of all exported commodities of country i, while Xwj represents the export of world for same commodity j and Xwt is a world export of all t commodities. According to the results of Balassa index if RCA2> 1 then a country has acomparative advantage, if RCA2< 1 then a country has acomparative disadvantage in that commodity or industry.
6. ECONOMETRIC RESULTS OF RCA
The Export pattern of Pakistan is enormously concentrated in few of product classification such as textiles and clothing sector which cover 60 percent of Pakistan’s exports to the world. The cause behind is a dependency on agricultural based commodities such as cotton.
Table-1. Pakistan Revealed comparative advantage for Sector wise products exports to World (HS 1988/92)
| HS | Product Group | 03 | 04 | 05 | 06 | 07 | 08 | 09 | 10 | 11 | 12 | 13 | 14 | 15 |
| 50-63 | Textiles and Clothing | 12.7 | 14.1 | 14.7 | 15.4 | 15.8 | 14.5 | 13.8 | 13.87 | 14.5 | 14.3 | 15.07 | 14.6 | 16.6 |
| 41-43 | Hides and Skins | 8.21 | 8.31 | 8.73 | 8.46 | 9.41 | 10.1 | 9.21 | 8.91 | 8.11 | 8.14 | 8.79 | 8.62 | 8.47 |
| 06-15 | Vegetable | 2.87 | 2.69 | 3.65 | 3.79 | 3.39 | 3.88 | 2.95 | 4.4 | 3.89 | 3.23 | 3.99 | 3.54 | 2.37 |
| 01-05 | Animal | 0.81 | 0.82 | 0.73 | 0.9 | 0.86 | 0.92 | 0.88 | 0.96 | 1.05 | 1.03 | 1.25 | 1.21 | 0.81 |
| 64-67 | Footwear | 0.66 | 0.74 | 0.77 | 0.71 | 0.72 | 0.69 | 0.65 | 0.59 | 0.61 | 0.76 | 0.8 | 0.86 | 0.8 |
| 16-24 | Food Products | 0.53 | 0.69 | 0.46 | 0.6 | 0.57 | 1.1 | 0.77 | 0.64 | 0.79 | 0.96 | 1.33 | 1.05 | 0.79 |
| 90-99 | Miscellaneous | 0.47 | 0.48 | 0.55 | 0.55 | 0.5 | 0.58 | 0.49 | 0.45 | 0.45 | 0.44 | 0.47 | 0.5 | 0.52 |
| 39-40 | Plastic/Rubber | 0.37 | 0.29 | 0.34 | 0.27 | 0.25 | 0.38 | 0.33 | 0.37 | 0.35 | 0.41 | 0.35 | 0.33 | 0.28 |
| 68-71 | Stone and Glass | 0.32 | 0.32 | 0.27 | 0.31 | 0.56 | 1.13 | 2 | 1.79 | 1.4 | 2.46 | 0.7 | 0.34 | 0.11 |
| 25-26 | Minerals | 0.29 | 0.36 | 0.31 | 0.31 | 1.26 | 2.76 | 1.9 | 1.34 | 1.13 | 1.22 | 1.58 | 1.58 | 1.67 |
| 72-83* | Metals | 0.17 | 0.2 | 0.22 | 0.27 | 0.29 | 0.26 | 0.34 | 0.37 | 0.38 | 0.5 | 0.39 | 0.32 | 0.32 |
| 28-38 | Chemicals | 0.13 | 0.08 | 0.14 | 0.13 | 0.09 | 0.1 | 0.13 | 0.13 | 0.13 | 0.13 | 0.18 | 0.15 | 0.08 |
| 27 | Fuels | 0.13 | 0.09 | 0.11 | 0.2 | 0.23 | 0.21 | 0.12 | 0.17 | 0.18 | 0.16 | 0.16 | 0.26 | 0.24 |
| 44-49 | Wood | 0.06 | 0.05 | 0.05 | 0.06 | 0.05 | 0.05 | 0.05 | 0.13 | 0.1 | 0.09 | 0.11 | 0.1 | 0.05 |
| 84-85 | Mach and Elec | 0.03 | 0.03 | 0.03 | 0.03 | 0.03 | 0.04 | 0.05 | 0.04 | 0.05 | 0.03 | 0.03 | 0.03 | 0.03 |
| 86-89 | Transportation | 0.02 | 0.02 | 0.03 | 0.04 | 0.03 | 0.03 | 0.04 | 0.03 | 0.03 | 0.03 | 0.03 | 0.02 | 0.02 |
(*Excluding 77) Source: Author own calculations based on WITS database 2016
Hence, cotton-oriented manufactured products for example yarn, knitted, cotton clothes and woven products of Pakistan captured the demand of overseas markets. Product concentration deteriorated overall exports earning not merely for Pakistan but for other developing countries too. Lower tendencies in exports are the consequences of mutually supply and demand side factors. On the supply side, structural impediments in commodity producing sector, an elevated cost of production, low-level expertise and in competitiveness have also hurled the exports. Investment both domestic and foreign in exporting sectors has lingered disturbingly low, as aggressive competitions with economies like Vietnam and Bangladesh, bestows tough time to Pakistan’s exports. On the demand side, the leading factors impeding Pakistan’s exports growth is the slouch in the economies of major trading partners, like China and EU. In the case of USA, although its import demand remained modest through these years, Pakistan has not been proficient to supply into this market for the reason that of change in market preferences (Pakistan Economic Survey 2015-16). Textile and clothing sector of Pakistan witnessed highest share in exports similarly it has amaximumcomparative advantage among other product groups. Hides and skins also show revealed comparative advantage for many years (see table 1).
A careful analysis of table 1 reveals that textiles and clothing sector have clear RCA over the year following are hides and skins, vegetable also has prominent RCA throughout the years. The results are also indicating amounting but constant trend in comparative advantage of textile and clothing sector, hides and skins, and vegetable sector. While there has been a mixed trend in comparative advantage of animal and food products sector. Animal sector of Pakistan is showing volatility in comparative advantage because its values over the period remained unstable. The composition and size of global trade have witnessed major changes during the previous two decades. Trade liberalization, growing income, and technological advancementshave been the major determinants. Against the backdrop of a rapidly shifting global export pattern, and the economic achievements of Southeast Asian economies, there is a well-built case for Pakistan to practice an export-led growth strategy that leads eventually to improve living standards. Nonetheless, given Pakistan’s past macroeconomic performance and its existing export structure, such a turnaround would demand a major structural revolution and transformation of the economy and changes in its export specialization patterns.
In the Asia region, many other countries are aspecialist in the textile and clothing related goods such as China, India, Bangladesh, Thailand, and Vietnam. Pakistan faces gigantic competition market environment in theexport market while exporting to the same regions as competitors’. We have calculated the RCA of top three exports of Pakistan in the major competitor country’s exports. International trade is important to the economy of Pakistan because thecountry needs to import a variety of products to fulfill the increasing demands resulting from its economic recovery and expansion (Muhammad and Qi, 2015).
Table-2. RCA Comparative analysis with major competitors in the region
Product ---> Group |
Textiles and clothing | Hides and Skins | Vegetable | ||||||
| 2005 | 2010 | 2015 | 2005 | 2010 | 2015 | 2005 | 2010 | 2015 | |
| RCA of Pakistan | 14.7 | 13.87 | 16.6 | 8.73 | 8.91 | 8.47 | 3.65 | 4.4 | 2.37 |
| RCA of China | 2.67 | 2.72 | 2.21 | 3.62 | 2.95 | 2.22 | 0.36 | 0.25 | 0.22 |
| RCA of India | 3.62 | 3.34 | 3.61 | 3.11 | 2.45 | 2.87 | 1.94 | 1.54 | 1.76 |
| RCA of Bangladesh | 18.20 | 22.63 | 23.36 | 3.7 | 2.36 | 2.28 | 0.19 | 0.18 | 0.16 |
| RCA of Thailand | 1.19 | 0.94 | 0.73 | 0.92 | 0.74 | 0.77 | 1.31 | 1.39 | 1.36 |
| RCA of Malaysia | 0.26 | 0.29 | 0.26 | 0.06 | 0.06 | 0.06 | 1.63 | 2.22 | 1.63 |
| RCA of Indonesia | 1.84 | 1.78 | 2 | 0.55 | 0.51 | 0.58 | 2.59 | 3.49 | 4.05 |
| RCA of Vietnam | 3.40 | 4.68 | 4.10 | 2.82 | 3.23 | 3.19 | 3.74 | 2.98 | 1.84 |
| RCA of South Korea | 0.92 | 0.68 | 0.61 | 0.56 | 0.39 | 0.44 | .07 | 0.05 | 0.04 |
| RCA of Sri lanka | 11.03 | 12.45 | 13.58 | 0.89 | 0.53 | 0.50 | 6.29 | 5.55 | 4.35 |
Source: Author own calculations based on WITS data base 2016
Table 2 reveals the comparative advantage of three major sectors in Pakistan exports where Pakistan has ahighest comparative advantage and other competitors also witnessing revealed comparative advantage in the same sectors. Exports of Bangladesh in textile and clothing sector are higher than Pakistan and have a bigger figure in RCA results too. The share of China exports in world market accounts USD 273.64 billion compared to the Pakistan USD 13 billion in thesame year 2015 (see table B in theappendix). China also has a clear RCA in textile and clothing sector and hides and skins sector but in vegetable, sector showing disadvantage. China being a major player in world trade and has thehighest share of world exports (Qi, 2014).While Bangladesh got thebenefit of Generalized Scheme of Preference (GSP) plus status that was given to 49 Least Developed Countries by EU in early 2001 includingBangladesh. EU permitted complete access to quota and tariff free exports from these Least Developed Countries to EU, and Bangladesh improved his level textiles and clothing sector to get maximum output which will help the economy to reduce balance of payments and Bangladesh boosts his exports and almost doubled than Pakistan in the2015 year which was less than Pakistan in the textile and clothing sector (see table B in appendix). China had analmost stable position in clothing sector too, while India has alow comparative advantage than its competitor and RCA of Indian clothing sector remained volatile and declined after liberalization. Similarly, for Hides and Skins Pakistan has high comparative advantage followed by China, India, Bangladesh, and Vietnam. Vegetable sector of Pakistan also has anincreasing trend in comparative advantage and chase by Sri Lanka, Indonesia, Vietnam, and India. China’s international trade has witnessed brisk growth in recent years. China's emergence as a major player in world trade is a significant development in the global trade system (Muhammad and Qi, 2015).
7. CONCLUSION AND POLICY RECOMMENDATIONS
After critically examine the external trade sector of Pakistan, we have identified that there have been structural and repeated changes in external sector of Pakistan. Internally there has been a gigantic increase in import demand due to economic growth. Conversely, the world economy grew by approximately 5 percent during same time period except for world economic crises year and brought an extensive expansion in world's trade. This rapid growth in worldwide trade has been a motivating energy for growth in almost every country of the world.
Pakistan's economic growth has been impressive since 2000, mainly in consequence of its moderate macroeconomic strategies and structural reforms. The government of Pakistan should protect infant industries through tariffs and various tax concessions. Pakistan still lags behind in export diversification. Textiles and clothing sector still contributes more than 65 percent of the total exports. This sector is now experiencing greater competition in international markets. There is a great need to concentrate on the issues that make obstacles in securing market access and economic associations with global markets especially with friend countries if Pakistan really wants to chase the policy of export-led growth profitably. Reducing industrial and non-industrial expenditures of manufacturing, improving labor productivity and growing industrial productivity are significant factors for persistent economic growth in Pakistan.
The estimations for the year 2003 to 2015 provide evidence on the movement in the pattern of revealed acomparative advantage for Pakistan’s all external sectors at HS-2 digit level and comparison analysis with selected countries such as China, India, Bangladesh, Thailand, Malaysia, Indonesia, Vietnam, South Korea and Sri Lanka. Pakistan has a growing movement in comparative advantage in textiles and clothing sector following by hides and skins and Vegetable sectors. The revealed comparative advantage index is greater than other countries for Pakistan’s top three product group and nearly stable over the years.
The dominance of the textiles and clothing sector is reliable with Pakistan’s existing natural and human factor endowments. Conversely, Pakistan has failed to move from low value-added unqualified labor-intensive to technology-intensive high-value-added manufacturing. Presently climate of rapid trade liberalization, Pakistan’s textiles and clothing sector and the rest prominent sectors will come under increasing competitive pressure from lower cost producers. The extent to which Pakistan can be achieved in its drive to shift into high-value-added export industries, in which information and technology intensive industries play an essential role, depends upon an importance of research and development, technology capacity, and pace of technology transfer. Likewise, the capability of Pakistan’s institutional and socio-economic infrastructure to provide supportive conditions for industrial restructuring should not be underestimated. The quality and nature of human capital desired for an industrial transformation would become an essential issue to overcome.
APPENDIX
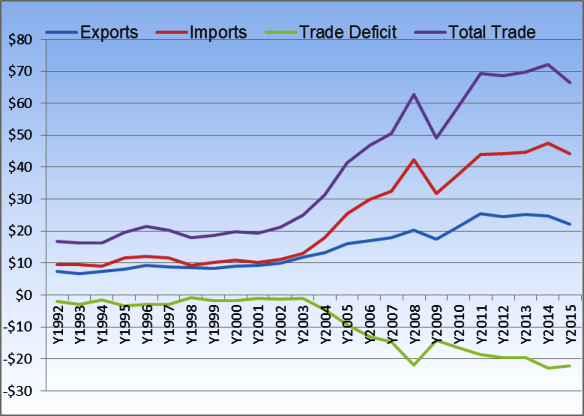
Figure-A. Foreign Trade Flow of Pakistan (US$ billions)
Source: Author’s own calculations based on ITC & UN COMTRADE statistics
Table-A. Sector wise exports of Pakistan (US$ Million)
| Product Group | 2003 | 2004 | 2005 | 2006 | 2007 | 2008 | 2009 | 2010 | 2011 | 2012 | 2013 | 2014 | 2015 |
| All Products | 11930 | 13379 | 16050 | 16933 | 17838 | 20279 | 17555 | 21413 | 25344 | 24614 | 25121 | 24722 | 22089 |
Textiles and Clothing |
8298 | 8917 | 10259 | 10870 | 10739 | 10628 | 9640 | 11610 | 13582 | 12921 | 13671 | 13773 | 12918 |
| Vegetable | 999 | 1019 | 1591 | 1618 | 1769 | 3020 | 2357 | 2904 | 4138 | 3344 | 3569 | 3438 | 3210 |
| Hides and Skins | 695 | 783 | 999 | 998 | 1084 | 1150 | 849 | 1035 | 1150 | 1132 | 1274 | 1290 | 1113 |
| Food Products | 162 | 211 | 244 | 294 | 305 | 571 | 350 | 429 | 590 | 656 | 1275 | 1054 | 863 |
| Miscellaneous | 524 | 658 | 576 | 592 | 520 | 646 | 558 | 601 | 669 | 954 | 702 | 768 | 739 |
| Animal | 192 | 166 | 207 | 241 | 259 | 337 | 361 | 458 | 581 | 616 | 720 | 711 | 706 |
| Minerals | 37 | 66 | 144 | 159 | 349 | 769 | 644 | 679 | 689 | 841 | 858 | 797 | 592 |
| Metals | 100 | 128 | 201 | 202 | 273 | 307 | 314 | 414 | 523 | 641 | 536 | 545 | 391 |
| Chemicals | 158 | 162 | 293 | 231 | 206 | 249 | 335 | 308 | 376 | 371 | 400 | 421 | 358 |
| Plastic or Rubber | 155 | 173 | 307 | 299 | 203 | 306 | 315 | 418 | 559 | 535 | 467 | 376 | 301 |
| Fuels | 273 | 362 | 675 | 841 | 994 | 1230 | 715 | 1203 | 1312 | 331 | 527 | 648 | 265 |
| Mach and Elec | 114 | 148 | 215 | 233 | 287 | 446 | 321 | 393 | 349 | 290 | 294 | 353 | 256 |
| Footwear | 91 | 106 | 156 | 136 | 115 | 135 | 119 | 95 | 114 | 104 | 111 | 135 | 119 |
| Wood | 20 | 30 | 31 | 33 | 32 | 52 | 54 | 60 | 87 | 100 | 126 | 135 | 114 |
| Transportation | 50 | 378 | 80 | 101 | 527 | 126 | 87 | 170 | 100 | 83 | 89 | 82 | 77 |
| Stone and Glass | 63 | 72 | 71 | 83 | 178 | 305 | 535 | 637 | 524 | 1694 | 502 | 197 | 67 |
Source: Author own calculations based on WITS data base 2016
Table-B. Comparative analysis of Pakistan with Competitors’ export to the world in the same sector and their percentage share in total world exports (Values in US$ billions)
| Product Group | Year/ Percentage Share in World Total exports |
Pakistan | China | India | Bangladesh | Thailand | Malaysia | Indonesia | Vietnam | Sri Lanka | Total |
| Textiles and clothing | 2005 | 10 | 108 | 17 | 8 | 7 | 3 | 13 | 5 | 5 | 542 |
| % share | 1.8 | 19.9 | 3.1 | 1.5 | 1.3 | 0.6 | 2.4 | 0.9 | 0.9 | 100 | |
| 2010 | 12 | 200 | 27 | 17 | 8 | 3 | 11 | 13 | 4 | 678 | |
| % share | 1.8 | 29.5 | 4 | 2.5 | 1.2 | 0.4 | 1.6 | 1.9 | 0.6 | 100 | |
| 2015 | 13 | 274 | 37 | 21 | 7 | 3.1 | 9 | 25 | 5 | 880 | |
| % share | 1.5 | 31.1 | 4.2 | 2.4 | 0.8 | 0.4 | 1 | 2.8 | 0.6 | 100 | |
| Hides and Skins | 2005 | 1 | 16 | 2 | .24 | 1 | .06 | .5 | .42 | .02 | 80 |
| % share | 1.3 | 20 | 2.5 | 0.3 | 1.3 | 0.1 | 0.6 | 0.5 | 0 | 100 | |
| 2010 | 1.1 | 23 | 2 | .3 | .8 | .07 | .4 | 1 | .02 | 104 | |
| % share | 1.1 | 22.1 | 1.9 | 0.3 | 0.8 | 0.1 | 0.4 | 1 | 0 | 100 | |
| 2015 | 1.2 | 35 | 4 | .4 | 1 | .13 | .3 | 3 | .02 | 148 | |
| % share | 0.8 | 23.6 | 2.7 | 0.3 | 0.7 | 0.1 | 0.2 | 2 | 0 | 100 | |
| Vegetable | 2005 | 2 | 9 | 6 | .16 | 4 | 6 | 27 | 3 | 2 | 256 |
| % share | 0.8 | 3.5 | 2.3 | 0.1 | 1.6 | 2.3 | 10.5 | 1.2 | 0.8 | 100 | |
| 2010 | 3 | 16 | 10 | .15 | 9 | 18 | 19 | 8 | 2 | 470 | |
| % share | 0.6 | 3.4 | 2.1 | 0 | 1.9 | 3.8 | 4 | 1.7 | 0.4 | 100 | |
| 2015 | 3.2 | 23 | 17 | .2 | 10 | 15 | 7 | 13 | 2 | 630 | |
| % share | 0.5 | 3.7 | 2.7 | 0 | 1.6 | 2.4 | 1.1 | 2.1 | 0.3 | 100 |
Source: Author own calculations based on WITS data base 2016
| Funding: This study received no specific financial support. |
| Competing Interests: The authors declare that they have no competing interests. |
| Contributors/Acknowledgement: Both authors contributed equally to the conception and design of the study. |
REFERENCES
Amador, J. and S. Cabral, 2008. The portuguese export performance in perspetcive: A constant market share analysis. Economic Bulletin, 14(3): 201-221.View at Google Scholar
Balassa, B., 1965. Trade liberalization and ‘revealed’ comparative advantage. Manchester School, 33(2): 99-123.View at Google Scholar
Balassa, B., 1989. Comparative advantage, trade policy and economic development. 1st Edn., London: Harvester/ Wheat Sheaf.
Bowen, H.P., 1983. On the theoretical interpretation of indices of trade intensity and revealed comparative advantage. Weltwirtschaftliches Archiv, 119(3): 464-472.View at Google Scholar | View at Publisher
Dimelis, S. and K. Gatsios, 1995. Trade with central and Eastern Europe: The case of Greece. In R. Faini and R. Portes (Eds.), EU trade with Eastern Europe: Adjustment and opportunities. London: CEPR.
Donges, J.B. and R. James, 1977. The expansion of manufactured exports in developing countries: An empirical assessment of s upply and demand issues. Review of World Economics, 113(1): 58-87.View at Google Scholar | View at Publisher
Greenaway, D. and C. Milner, 1993. Trade and industrial policy in developing countries: A manual for policy analysis. The Macmillan Press, esp. Part IV Evaluating Comparative Advantage. pp: 181-208.
Hoen, A.R. and J. Oosterhaven, 2006. On the measurement of comparative advantage. Annals of Regional Science, 40(3): 677-691.View at Google Scholar
Laursen, K., 2000. Do export and technological specialization patterns co-evolve in terms of convergence or divergence? Evidence from 19 OECD countries, 1971-1991. Journal of Evolutionary Economics, 10(4): 415-436.View at Google Scholar | View at Publisher
Liesner, H.H., 1958. The European common market and British industry. Economic Journal, 68(270): 302-316.View at Google Scholar | View at Publisher
Mahmood, A., 2004. Export competitiveness and comparative advantage of Pakistan’s non-agricultural production sectors: Trends and analysis. Pakistan Development Review, 43(4): 541-561.View at Google Scholar
Memedovic, O., 1994. On the theory and measurement of comparative advantage: An empirical analysis of Yugolslav trade in manufactures with the OECD countries 1970-1986, Amsterdam, Thesis Publishers.
Muhammad, 2016. Deltoid analysis of Pakistan-ASEAN-China free trade agreements and opportunities for Pakistan. Asian Economic and Financial Review, 6(5): 228-237.View at Google Scholar | View at Publisher
Muhammad, 2016. The role of charismatic world trade organization and the expansion of free international trade. International Journal of Management Science and Business Administration, 2(3): 17-23.View at Google Scholar | View at Publisher
Muhammad, 2017. SWOT Analysis of Pakistan-China free trade agreement: Pros and Cons. International Journal of Asian Social Science, 7(1): 45-53.View at Google Scholar | View at Publisher
Muhammad, S.I. and X. Qi, 2015. Rising trend in imports and exports of Pakistan’s FTA partners in recent years. Academic Research International, 6(4): 320-331.View at Google Scholar
Muhammad, S.I. and X. Qi, 2015. Pakistan-China free trade agreement (PCFTA) treaty model: Capability, prospects and disputes. Academic Research International, 6(3): 53-60.View at Google Scholar | View at Publisher
Nawaz, A. and K. Rukhsana, 2013. Changing revealed comparative advantage of textile and clothing setors of Pakistan: Pre and Post Quota analysis. Pakistan Journal of Commerce and Social Sciences, 7(3): 520-544.View at Google Scholar
Pack, H., 1993. Technology Gaps between industrial and developing countries: Are there dividends for latecomers? in World Bank (Ed), Proceedings of the World Bank Annual Conference on Development Economics 1992. Washington DC.
Posner, M.V., 1961. International trade and technical change. Oxford Economic Papers, 13(3): 323-341.View at Google Scholar | View at Publisher
Proudman, J. and R. Stephen, 1998. Evolving patterns of internationals trade. Retrieved from http://www.nuffield.ox.ac.uk/economics/papers/1998/w11/evnuffa.
Qi, 2014. Boon or bane: Assessing the environment of China’s free trade agreements with other nations. International Journal of Business and Management Review, 2(5): 1-13.View at Google Scholar
Rahmaddi, R. and M. Ichihashi, 2012. How do export structure and competitiveness evolve since trade liberalization? An overview and assessment of Indonesian manufacturing export performance. International Journal of Trade, Economics and Finance, 3(4): 272-280.View at Google Scholar | View at Publisher
Ruffin, R., 1988. The missing link: The Ricardian approach to the factor endowment theory of trade. American Economic Review, 78(4): 759-772.View at Google Scholar
Samuelson, P.A., 1948. International trade and equalization of factor prices. Economic Journal, 58(230): 165-184.View at Google Scholar
Vollrath, T.L., 1991. A theoretical evaluation of alternative trade intensity measures of revealed comparative advantage. Review of World Economics, 127(2): 265-280.View at Google Scholar | View at Publisher
Yu, R., C. Junning and L. PingSun, 2009. The normalized revealed comparative advantage index. Annals of Regional Science, 43(1): 267-282.View at Google Scholar | View at Publisher
| Views and opinions expressed in this article are the views and opinions of the author(s), Asian Economic and Financial Review shall not be responsible or answerable for any loss, damage or liability etc. caused in relation to/arising out of the use of the content. |