


EDUCATION, EMPLOYMENT AND GENDER GAP IN MENA REGION

1Post Doctorate Researcher, Interdisciplinary Centre of Social Sciences, University of Minho/Portugal - Associate professor, PhD .of economics, Albalqa Applied University/Jordan
2Associate Professor, PhD of Sociology (University of Minho/Portugal), Senior Researcher, Interdisciplinary Centre of Social Sciences (CICS. NOVA. UMinho)
ABSTRACT
Education is central to human capital capacity‐building, and major determinant of economic development, as it has long been considered as an important investment both for social and economic development. The Middle East and North African countries have been aware of the importance of education therefore considered it as a key part of their strategies and future planning; enrollments at different levels of education have improved dramatically over the past few decades. This study is an empirical investigation to the impact of different level of education attainment on employment level, labor force participation rate and gender gap of employment. For that purpose the cross section time series or panel data set consisting of 15 countries – where the data is comparable -has been taken. Panel data regression analysis has been carried out to find out the magnitude and direction of relationship between dependent and independent variables. Further Hausman test of specification has been applied for the selection between fixed effect model and random effect model. The main finding of this study, that there is negative relationship between educational attainment and male labor participation rate, while it is positive in case of females labor force. The study found also that with the improvement of educational attainment there has been a decrease employment gender gap.
© 2017 AESS Publications. All Rights Reserved.
Keywords, MENA, Gender gap, Education, Labor market, Employment gap, Education and labor market.
Article History, Received: 20 December 2016, Revised: 20 January 2017, Accepted: 2 March 2017, Published: 10 April 2017
Contribution/ Originality: This study is one of the few studies which have examined the impact of educational attainment on employment, labor force participation rate and its role in closing the labor market gender gaps in MENA countries.
1. INTRODUCTION
Women’s empowerment is one of the main targets of human development in the MENA region, as this region has the lowest average women participation rate, and has the highest gender gap in term of employment and participation in the labor market in the world (Spierings et al., 2008).
Gender inequality and disparities between males and females have serious cost implications. They negatively affect human and economic development by creating more poverty. Less economic growth with bad governance leads to lower level living standards for their citizens (World Bank, 2003). The most effected factor to element gender inequality and promote economic activity is investment in human capital formation where education can play a major role in achieving greater goals, and has long been seen as an important investment both for individuals and societies. It has wide-ranging benefits, particularly for women, which promotes not only gender equality, but it is about fairness and equity which includes many other economic, political, social and cultural dimensions. It is a core value of the international community and a fundamental human right. Investment in human capital through education is one of the most important policies that can be adopted in the fight against poverty. Which leads to better access to the jobs that raise their labor earnings and contribute directly to the improvement of living standard of the society (Alina, 2012).
The Middle East and North African countries have been aware of the importance of education therefore considered it as a key part of their strategies and future planning; enrollments at different levels of education have improved dramatically over the past few decades, at the primary school level enrollment is 100% in most MENA countries. And the gender gap in term of enrollment has disappeared in many countries of the region, while the ratio of female students at the tertiary education has improved at faster rate (Farzaneh and Moghadam, 2003). This resulted into many unprecedented changes and transformations in most of the MENA countries. Women’s participation in this process of transformation and changes has not been crucial in highlighting their important roles in society only, but also their aspirations for real gender equality.
The main focus of this study is to investigate the paradoxical situation in the MENA’s labor market gaps and the impact of education on that. Most countries of this region have increased women’s educational levels through investments in this sector and could reach a good level of educational attainment, as this progress should lead to further improvement in the female economic activities, but it the real situation in the MENA region might be different, where it seems that the connection between education and labor market is still lacking. The female labor force participation rate has not shown as much growth as expected. This point brings up the main question of the study, “what is the impact of education on female labor force participation rate and employment in the MENA region?
1.1. Objectives of the Study
The study attended to:
Examine the educational attainment of women in the MENA countries.
Critically examine the participation rate of female population in the labor market.
Examine the relationship between educational attainment and the labor force participation rate by gender.
Find out the impact of educational attainment on the employment by gender.
Find out the impact of educational attainment on employment gap.
1.2. Source of Data
One of the main obstacles that researchers face is data collection, especially when the research is related to the gender studies in MENA countries. Generally, there is a real weaknesses and gaps in the data, as many countries don’t provide data in annual basis even some of these countries don’t have a strong or reliable national datasets, and some are not willing to share them with international statistical agencies, and moreover The statistical coverage of the gender issues are very limited, as very few countries provide statistical data in gender basis. Therefore, this study will depend completely on international statistical sources of women’s position and gender inequalities in employment and labor force, such as ILO and World Bank. The study will use the descriptive and analytical methods to examine the data related to the MENA labor market which will be explained in detail, when we come to the data analysis.
2. LITERATURE REVIEW
That gender equality plays an important role in economic development has long been understood in the literature.
Many studies have shown how lower or weak female labor force participation drags down economic growth and how women empowering has significant economic benefits in addition to promoting gender equality (Duflo, 2012). Katrrin (2013) and other in The Staff Discussion Note of IMF summarized the economic implications of gender participation gaps by stating that, “There is ample evidence that when women are able to develop their full labor market potential, there can be significant macroeconomic gains (Dollar and Gatti, 1999; Loko and Mame, 2009). GDP per capita losses attributable to gender gaps in the labor market have been estimated at up to 27 percent in certain regions (Cuberes and Teignier, 2012). Aguirre et al. (2012) suggest that raising the female labor force participation rate to country-specific male levels would, for instance, raise GDP in the United States by 5 percent, in Japan by 9 percent, in the United Arab Emirates by 12 percent, and in Egypt by 34 percent. Based on International Labor Organization (ILO) data, Aguirre et al. (2012) estimate that of the 865 million women worldwide who have the potential to contribute more fully to their national economies; 812 million live in emerging and developing nations” (Katrrin, 2013). Tansel (2002) concluded that the female labor force participation rate exhibits a u-shape during the period 1980–1990, which is characterized by notable economic development. While , unemployment discourages female from participation in the labor market, whereas education increases it. The World Economic Forum’s 2014 Global Gender Gap Report found a positive relation between gender equality and per capita GDP, the level of competitiveness, and human development indicators. Pike (1982) and Psacharopoulos and Tzannatos (1989) concluded that Low female labor market participation has important economic repercussions, as half of the able to work population is not fully contributing to productivity, leading to decreased economic efficiency. Studies have indicated that women are more likely to be found in low paying jobs, which cause a decrease of around three and ten percent in GNP due to labor market efficiency losses.
Other scholars studied the relation of education to labor participation like Chamlou et al. (2011) who provided evidence that women who have tertiary or post-secondary school educational attainment are more likely to participate in the labor market. Katie (2013) in her study ( Education and Female Labor Market Participation in the Middle East: A Case Study of Turkey and Saudi Arabia)concluded that there are other factors than education that determine female labor market participation in either Saudi Arabia or Turkey, these factors act as barriers to women’s economic participation. These factors include limited economic opportunities for women, and cultural and traditional norms that discourage women from participation in the labor market.
3. AN OVERVIEW OF THE MENA REGION
MENA- refers to the Middle East and North Africa; this term has no standardized definition. Different organizations define the region as consisting of different territories and countries. Therefore, in our study, we will consider the most common definition of the term to include: Algeria, Bahrain, Egypt, Iran, Iraq, Israel, Jordan, Kuwait, Lebanon, Libya, Morocco, Oman, Palestine, Qatar, Saudi Arabia, Syria, Tunisia, United Arab Emirates and Yemen and West Bank and Gaza. The Middle East and North Africa form a vast region stretching from the Atlantic Ocean to the Arab Gulf. The region’s countries share many common themes. First, Islam as the main religion and Arabic as the main language, are key factors in the identity formation of the region (Akkari, 2004) except for Israel and Iran where Arabic is one of the official languages ,but they share many common social structure with other countries in the MENA.
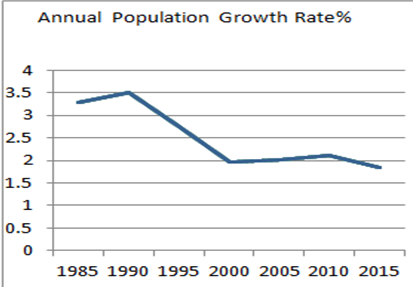
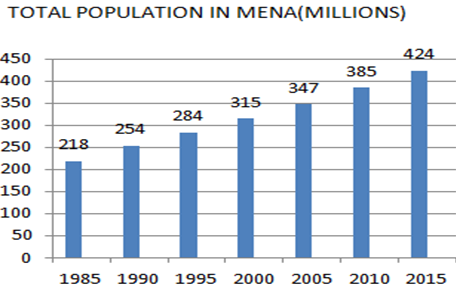
The MENA region commands a huge human and natural resources. It has the largest share of world’s petroleum production and reserves. It enjoys a reasonable standard of living. At the same time, intra-regional interaction is weak, with limited trade in goods and services (El-Erian, 1997). Most of the MENA countries are experiencing high population growth, with high dependency ratios. The average annual rate of population increase during 1990-2014 was about 2 percent (see diagram No.1), declining from the average of 3.3 percent during the 1980’s. Though there has been a significant decline in the average population growth rate in the region, we find that during the period 1985 to 2015, the population was almost doubled .The following diagram shows how the population increased from 218 million in 1985, to 424 million in 2015.
Diagram No-1.
Source: World Development Indicators
Source: World Development Indicators
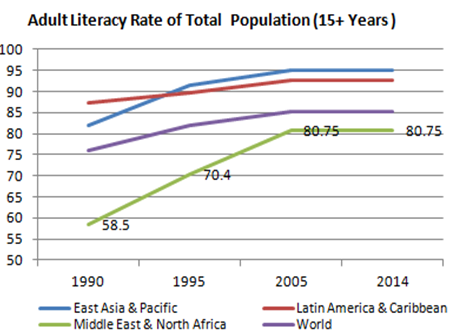
Despite high population growth in the region, traditional indicators of human resource development in the region are fairly satisfactory. Average life expectancy from birth increased from 58.9 years in 1980 to 72.9 years, in 2014. This was higher than the world average of 71.5 in 2014. During the recent decades, this region has made notable improvement in raising the educational level of their citizens. The average literacy rate in the region has been increasing at a faster rate than any other region in the world. This might have resulted because this average was already low during the past decades when other regions already had a higher literacy rate. However, the average literacy rate was 58.44 percent in 1990 and improved by nearly 22 percentage points in 2014, when it had reached to 80.26 percent (World Bank Data, n.d).
The quality of education is harder to measure, but it has been assumed that progress in MENA’s education system has been limited to the quantity of education (years of schooling), and little has been achieved in terms of quality (Isfahani et al., 2014). Though there has been inter country differences in terms of educational attainment, over all, this variation in performance suggests that country circumstances, institutions and policies have played a role in enhancing education achievement (Iqbal and Youssouf, 2014).
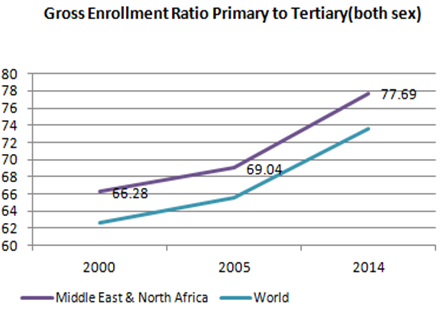
Diagram No.2 shows the overall enrollment in all educational levels from primary to tertiary education as stated in the World Bank educational statistics shows a great deal of improvement. It has improved from 67.2 percent in 2000 to 78.1 percent in 2013; this is above that of the world average and developing countries with comparable per capita income.
Diagram No-2.
Source: World Bank, Education Statistics
Source: World Bank, Education Statistics
The adult literacy rate by gender and enrollment at different levels of education is given diagram (No.3), which shows that the enrollment rates for both the genders have improved dramatically during the past three decades. Countries in the region could almost close the gap in enrollment ratios between the two genders. Even with the enrollment ratio for tertiary level of education, the female enrollment ratio exceeded that of male population. However this improvement in enrollment ratios has lead to further improvement in literacy, which was larger than in any other region in the Third World, but in terms of educational levels, still male population enjoys a higher level of educational attainment.
Diagram No-3.
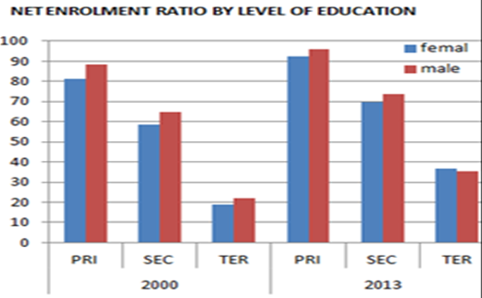

Source: World Bank, Gender Statistics
Source: World Bank, Gender Statistics
Generally, it is believed that with the improvement in the educational level of population, especially the female population, it is expected that labor force participation will increase, but in the case of MENA region that not happened. Women’s labor force participation rates have not shown significant improvement in this region since 1990. As of 2014, it is shown in ILO’s estimations, only two out of ten women, aged 15 years and above (21.9 percent) worked outside the home, which makes it the lower than the world’s average of 55.3 percent in 2014. Compared with 76 percent of men’s labor force participation in 1990 and 75 percent in 2014, which is comparable to other regions and close to the world’s average of 76.75 percent. Women’s share of the total labor force was 18.4 percent in 1990 and 21.3 percent in 2014 which means that only one fifth of the MENA’s labor force are females, compared to 39.7 percent of the world’s average (ILO estimation).
Diagram No-4.
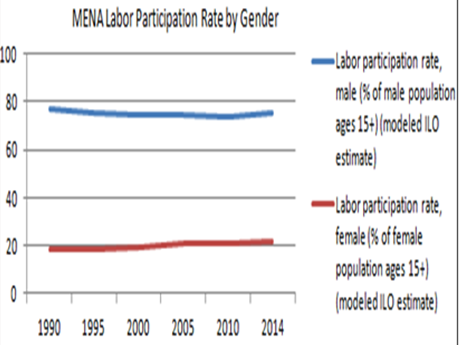
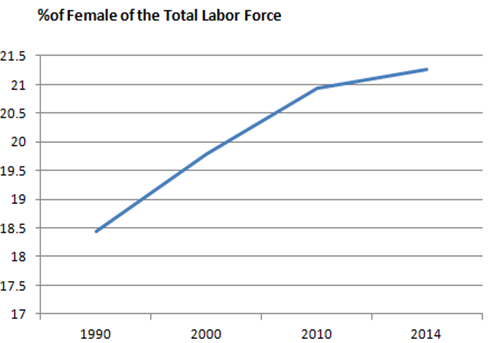
Source: World Bank, Gender Statistics
Source: World Bank, Gender Statistics
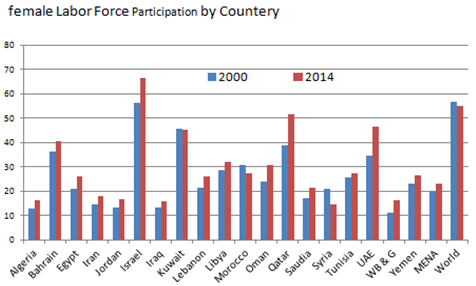
The statistical data given in diagram No.5, shows great variations within MENA in terms of women’s participation, and the extent to which it has changed during the 2000–2014 time periods, United Arab Emirates and Qatar witnessed the most substantial increases in their female labor participation rates; additions of 12.6 and 12.7 percentage points, respectively. In 2014, women’s economic activity rate remained the highest in Israel (57.7 percent) then Qatar (50.7 percent including the non-native workforce) and was the lowest in the Syria (13.6) percent in 2014) and Iraq (15 percent). The actual rates may be substantially higher as many women work in the informal sector. However Syria and Iraq have registered a decline in their female participation rate which is expected due the political and social wars these countries have.
Diagram No-5.
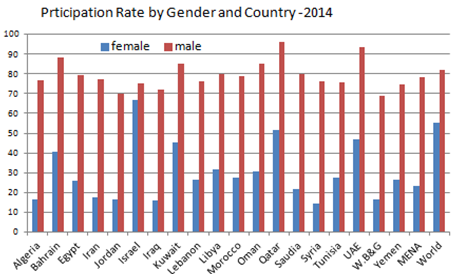
Source: World Bank, Gender Statistics
Source: World Bank, Gender Statistics
However, statistics show that fifteen Arab countries were out of the twenty countries with the lowest female labor force participation rates in 2011, these low participation rates has been attributed to the influence of conservative social norms and the value placed on female modesty in Islam (Spierings et al., 2008) Other researchers have attribute it to the effect of oil, or reducing demand for female labor force especially in the eastern part of the region (Karshenas and Moghadam, 2001; Ross, 2008).
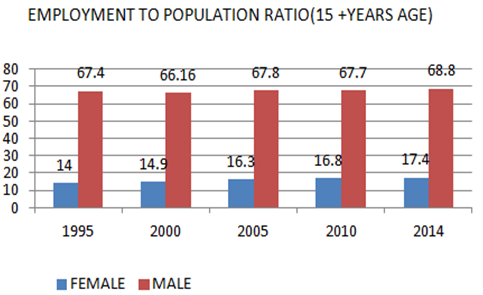
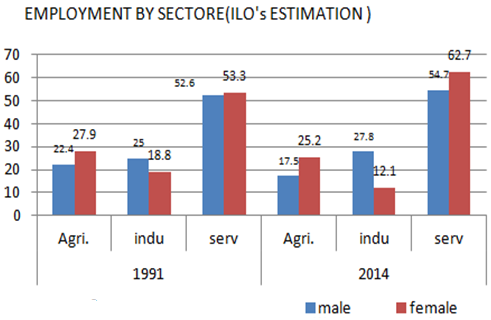
The statistics related to female employment in the region tell an even more dramatic story. Women educational enrollment in MENA has made great deal of improvement; even now their proportion is higher than that of men at the tertiary level. However, their accomplishments have not translated into employment gains. The ratio of female employment to total female population aged 15 years and above is only 14 percent in 1995 and improved slightly to 17.4 percent in 2014, compare to 67.4 percent and 68.8 percent for males of the same age group in 1995 and 2014 respectively (WBD, n.d). MENA’s women work mostly in the public sector (education and health sectors), as the private sector does not provide the same wage and nonwage benefits. Women work mainly in services; where almost two thirds of women are engaged in service sector in 2014. This proportion was lower than53.3percent in 1995. MENA was like other regions of the world; where women’s employment in agriculture declined significantly. It declined from 27.9 percent of total female employment in 1995, to 12.1 percent in 2014, according to ILO estimation. It is important to note that male employment in agriculture decreased in the same time period; from 22.4 percent to 17.5 percent of male employment in 2014,while Women’s employment in industry accounts for a small proportion of all female employment in MENA.
Diagram No-6.
Source: world Bank, Gender Statistics
Source: KILM,ILO
Note: This figures are average of the Arab countries and North Africa countries that indicated in the ILO KILM
4. EMPIRICAL METHODOLOGY
The study has been carried out for finding out the impact of different level of education attainment on employment level, labor force participation rate and gender gap of employment. For that purpose the cross section time series or panel data set consisting of 15 countries namely Algeria, Bahrain, Egypt, Israel, Iran, Islamic Republic of Iraq, Jordan, Kuwait, Libya, Morocco, Qatar, Saudi Arabia, Syrian Arab Republic, United Arab Emirates and Republic of Yemen has been taken. Panel data regression analysis has been carried out to and to find out the magnitude and direction of relationship between dependent and independent variables. Further Hausman test of specification has been applied for the selection between fixed effect model and random effect model.
Total of five different panel data regressions has been executed to obtain the objectives. Where’s the first regression is about to find out the impact of different level of education attainment on the male labor force participation rate, second regression is about to find out the impact of different level of education attainment on female labor force participation rate. Third regression is concern with finding out the relationship between different levels of education attainment of Male employment; fourth regression is concern with examining that how changes in different level of education could affect female employment level in the region. And finally last section of the analysis shows that how changes in the education level can affect the gender gap of employment between male and female for the whole region on the average.
4.1. Impact of Education Attainment on the Male Labor Force Participation Rate
To find out the impact of education attainment on male labor force participation rate the following equation has been set.
 (1)
(1)
In the above regression M_LFPR is the male labor force participation rate for the region which is the dependent variable for the current equation, the independent variables for the current model are P_Edu which is primary level education, S_Edu is secondary level education and T_Edu is Tertiary education level.
4.1.1. Hausman Test Results for First Regression
Below table: 1 show Hausman Specification test results, the second column of the table shows the coefficients for the fixed model third column shows the coefficients for the random model and their respective differences for each variable is shown in forth column. Whether the difference between the two estimations is significant or not we have to look at chi2 probability value, if that value is significant i.e. less than 0.05 will conclude that the difference is significant and hence will use fixed effect model if the alternative is the case i.e. if the chi2 probability value come out to be insignificant we will use random effect model.
Table-1. Hausman Test Results for First Regression
Coefficients: 
| (b) | (B) | (b-B) | sqrt(diag(V_b-V_B)) | |
| Variables | Fixed | Random | Difference | Std.Err |
| P_Edu | -.0765838 | -.0862071 | .0096233 | .0087845 |
| S_Edu | -.1745171 | -.1669603 | -.0075568 | .012556 |
| T_Edu | -.321771 | -.3209412 | -.0008298 | .0258116 |
b = consistent under Ho and Ha; obtained from xtreg B = inconsistent under Ha, efficient under Ho; obtained from xtreg Test: Ho: difference in coefficients not systematic chi2(3) = (b-B)'[(V_b-V_B)^(-1)](b-B)= 1.27 Prob>chi2 = 0.7362 |
Looking at the chi2 probability value of 0.7362 which is grater then 0.05 so we are having insignificance result and hence will use the random effect model which is given next
4.1.2. Random Effect Model Results
Random effect model results for first model are provided in table: 2, in which dependent variable is male labor force participation rate and independent variables are primary education, secondary education and tertiary education.
Table-2. Random Effect Model Results
Random-effects GLS regression Number of Obs = 75 Group variable: panel Number of groups = 15 R-sq: within = 0.3037 Obs per group: min = 5 between = 0.0631 avg = 5.0 overall = 0.0727 max = 5 Wald chi2(3) = 26.12 corr(u_i, X) = 0 (assumed) Prob > chi2 = 0.0010 |
| M_LFPR | Coef. | Std.Err. | Z | P>IzI | [95% Conf. Interval] |
| P_Edu | -.0862071 | .0425978 | -2.02 | 0.043 | -.1696974 -.0027169 |
| S_Edu | -.1669603 | .0583132 | -2.86 | 0.004 | -.2812521 -.0526685 |
| T_Edu | -.3209412 | .1195774 | -2.68 | 0.007 | -.5553086 -.0865738 |
| _Cons | 84.12847 | 2.610911 | 32.22 | 0.000 | 79.01118 89.24577 |
sigma_u sigma_e rho |
8.6187114 1.6272034 .96558181 (fraction of variance due to u_i) |
P-values 0.000 0.043 0.004 0.007 |

The sign of all partial coefficients shows that there is negative relationship between dependent and all independent variables, where the p-values for the partial coefficients are less than 0.05 which means that the relationships are significant as well.
The magnitude of the primary education coefficient is  meaning that any single unit increase in primary education will leads to decrease male labour force participation rate by 0.086 units and vice versa. The partial coefficients for secondary and tertiary level education shows that any single unit change in male secondary and tertiary level education will respectively brought about 0.17 and 0.32 unit changes in male labor force participation rate in inverse direction.
The coefficient of determination shows that changes in dependent variable are more sensitive to changes inside the cross-section rather than to changes in between the cross-section. The test for overall significance of the model shows that overall model is significant.
4.2. Impact of Education Attainment on Female Labor Force Participation Rate
To analyze the impact of education attainment on female labor force participation rate the equation has been set as:
 ……………… (2)
In the above regression F_LFPR represent female labor force participation rate for the region which is the dependent variable in the equation, the independent variables are P_Edu which is primary level education, S_Edu is secondary level education and T_Edu is Tertiary education level.
4.2.1. Hausman Test Results for the Second Regression
Hausman test results for the second model suggest that the difference between fixed effect and random effect estimations is significant and hence we will use fixed effect model.
Table-3. Hausman Test Results for the Second Regression
Coefficients: 
| (b) | (B) | (b-B) | sqrt(diag(V_b-V_B)) | |
| Variables | Fixed | Random | Difference | Std.Err |
| P_Edu | -.0493382 | -.1216498 | .0723116 | . |
| S_Edu | .1369576 | .1257463 | .0112113 | .0086643 |
| T_Edu | .7861827 | .9529437 | -.166761 | . |
b = consistent under Ho and Ha; obtained from xtreg B = inconsistent under Ha, efficient under Ho; obtained from xtreg Test: Ho: difference in coefficients not systematic chi2(3) = (b-B)'[(V_b-V_B)^(-1)](b-B)= 141.60 Prob>chi2 = 0.0000 |
4.2.2. Fixed Effect Model Results
Fixed effect model results for the second regression are provided in table: 4, where the dependent variable is is female labor force participation rate and independent variables are again primary level education, secondary level education and tertiary level educations.
The significance level of partial slope coefficient for the variables shows female primary level education and secondary level education are insignificantly linked with the female labor force participation rate.
Table-4. Fixed Effect Model Results
Fixed-effects (within) regression Number of Obs = 75 Group variable: panel Number of groups = 15 R-sq: within = 0.3854 Obs per group: min = 5 between = 0.5389 avg = 5.0 overall = 0.5086 max = 5 F(3,57) = 11.92 corr(u_i, Xb) = 0.4136 Prob > F = 0.0000 |
| F_LFPR | Coef. | Std.Err. | t | P>ItI | [95% Conf. Interval] |
| P_Edu | -.0493382 | .1006041 | -0.49 | 0.626 | -.2507944 .1521179 |
| S_Edu | .1369576 | .1048229 | 1.31 | 0.197 | -.0729466 .3468617 |
| T_Edu | .7861827 | .2043027 | 3.85 | 0.000 | .3770737 1.195292 |
| _Cons | 17.97503 | 1.898842 | 9.47 | 0.000 | 14.17267 21.7774 |
sigma_u sigma_e rho |
9.0336539 2.9132333 .90579901 (fraction of variance due to u_i) |
||||
| F test that all u_i=0: F(14, 57) = 27.65 Prob > F = 0.0000 |
P-values 0.000 0.626 0.197 0.000 |

The sign of Partial slope coefficient and probability value of the tertiary level education shows a significantly positive impact of tertiary level on female labor force participation rate. The magnitude for the tertiary level education shows that any single unit change in tertiary level education will leads towards 0.78 unit changes in the female labor force participation rate on the average in the overall region.
The coefficient of determination R2 values indicate that larger portion of the variation in the dependent variable i.e. female labor force participation is explained by changes between different countries rather than changes within the values for one country, as between Cross-section R2 is 53% and with the country R2 value is 38%.
The overall significance of the model is shown by the F-statistics. The F-statistics significance value leads us to the conclusion that overall model is significance, that is individually some of the partial coefficient may be insignificant but taking all the variables simultaneously will significantly affect the dependent variable.
4.3. Impact of Education Attainment on Male Employment
As education is considered a basic determinant for employment the current section analyse the impact of different level of education on employment status of male in region under consideration.
For that purpose the following regression equation has been estimated using panel data regression procedure
 …………………………………...... (3)
In the above equation M_Emp represent male employment level for the region which is the dependent variable in the equation, the independent variables are P_Edu which is primary level education, S_Edu is secondary level education and T_Edu is Tertiary education level.
4.3.1. Hausman Specification Test Results
The probability value of the Hausman specification test suggest the use random effect model as the p-value is greater than 0.05 which indicate that the difference between fixed effect and random effect model is insignificant.
Table-5. Hausman Specification Test Results
Coefficients:
| (b) | (B) | (b-B) | sqrt(diag(V_b-V_B)) | |
| Variables | Fixed | Random | Difference | Std.Err |
| P_Edu | -.098598 | -.1168782 | .0182802 | .0098056 |
| S_Edu | -.1589346 | -.1461294 | -.0128052 | .0154586 |
| T_Edu | -.0764777 | -.0737745 | -.0027032 | .0304352 |
b = consistent under Ho and Ha; obtained from xtreg B = inconsistent under Ha, efficient under Ho; obtained from xtreg Test: Ho: difference in coefficients not systematic chi2(3) = (b-B)'[(V_b-V_B)^(-1)](b-B)= 4.36 Prob>chi2 = 0.2252 (V_b-V_B is not positive definite) |
4.3.2. Random Effect Model Results
To find out the relationship between male employment and different levels of male education equation 3 has been calculated through panel data random effect procedure and the outcome is then recorded in table 6. The sign of the partial slope coefficients shows that all of the three levels of education are negatively linked with the male employment level.
Table-6. Random Effect Model Results
Random-effects GLS regression Number of Obs = 75 Group variable: panel Number of groups = 15 R-sq: within = 0.1238 Obs per group: min = 1 between = 0.0664 avg = 4.7 overall = 0.1135 max = 5 Wald chi2(3) = 8.75 corr(u_i, X) = 0 (assumed) Prob > chi2 = 0.0328 |
| M_Emp | Coef. | Std.Err. | z | P>IzI | [95% Conf. Interval] |
| P_Edu | -.1168782 | .0580441 | -2.01 | 0.044 | -.2306425 -.0031138 |
| S_Edu | -.1461294 | .0791727 | -1.85 | 0.065 | -.301305 .0090462 |
| T_Edu | -.0737745 | .1616266 | -0.46 | 0.648 | -.3905568 .2430078 |
| -Cons | 75.62071 | 3.247066 | 23.29 | 0.000 | 69.25658 81.98484 |
sigma_u sigma_e rho |
10. 742256 2.1871926 .96019457 (fraction of variance due to u_i) |
 |
The probability valued of the partial slope coefficients indicate that only male primary education level is significantly linked with the employment level where’s the male secondary and tertiary levels education are insignificantly linked with the male employment level.
The partial coefficient for the primary education shows that any single unit changes in primary education will affect male employment by 0.12 units in inverse direction significantly.
The partial slope coefficient of male secondary education shows that any singly unit changes in total secondary level education will bring about 0.14 unit insignificant changes in male employment in opposite direction i.e. if secondary level education increases by 1 unit it lower down the male employment by 0.14 units and vice versa.
The coefficient of determination estimates shows that the changes in male employment are more sensitive to changes within the cross-section rather than the changes among cross-sections. That is the “within” R2 value is 16 percent in comparison to “between” R2 value of 6 percent.
4.4. Impact of Education Attainment on Female Employment Level in the Region
To find out the impact of female education attainment on female employment level equation is set below:
 …………………………………...… (4)
In equation 4 female employments F_Emp for the region is taken as dependent variable where female primary, secondary and tertiary levels education for the region is taken as independent variables which are represented by P_Edu, S_Edu and T_Edu respectively.
4.4.1. Hausman Specification Test Results
The Hausman specification test probability value of 0.4452 leads us to the conclusion that we are not having sufficient evidence to reject our null hypothesis and hence we will use random effect model.
Table-7. Hausman Specification Test Results
Coefficients: 
| (b) | (B) | (b-B) | sqrt(diag(V_b-V_B)) | |
| Variables | Fixed | Random | Difference | Std.Err |
| P_Edu | .0555023 | .0301281 | .0253742 | . |
| S_Edu | .1456347 | .1381732 | .0074615 | .0148116 |
| T_Edu | .6000193 | .7046268 | -.1046075 | .0258926 |
| b = consistent under Ho and Ha; obtained from xtreg B = inconsistent under Ha, efficient under Ho; obtained from xtreg Test: Ho: difference in coefficients not systematic chi2(3) = (b-B)'[(V_b-V_B)^(-1)](b-B)= 2.74 Prob>chi2 = 0.4452 (V_b-V_B is not positive definite) |
4.4.2. Random Effect Model Results
To find out what whether female education attainment could affect female employment level or not equation 4 has been executed through utilizing the procedure of random effect procedure and the results are than provided in table 8. The results of the model are as per the expectation. The partial coefficients of female primary, secondary and tertiary level educations provide the support for a positive link with the female employment level.
The probability values indicate that female primary and secondary level educations are insignificantly linked with the female employment where’s the female tertiary level education is significantly linked with the female employment level in the region.
Table-8. Random Effect Model Results
Random-effects GLS regression Number of Obs = 75 Group variable: panel Number of groups = 15 R-sq: within = 0.1762 Obs per group: min = 1 between = 0.2593 avg = 4.7 overall = 0.2171 max = 5 Wald chi2(3) = 16.32 corr(u_i, X) = 0 (assumed) Prob > chi2 = 0.0010 |
| F_Emp | Coef. | Std.Err. | z | P>IzI | [95% Conf. Interval] |
| P_Edu | .0301281 | .0805189 | 0.37 | 0.708 | -.1276862 .1879423 |
| S_Edu | .1381732 | .1093177 | 1.26 | 0.206 | -.0760856 .3524321 |
| T_Edu | .7046268 | .2234206 | 3.15 | 0.002 | .2667304 1.142523 |
| _Cons | 13.17079 | 3.491267 | 3.77 | 0.000 | 6.328029 20.01354 |
sigma_u sigma_e rho |
9.4117454 2.9910807 .90826626 (fraction of variance due to u_i) |
 |
The partial slope coefficient of female primary education is 0.03 units meaning that any single unit change in female primary level education will bring about 0.03 units direct changes in the female employment in the region.
The partial slope coefficient and significance value for the secondary level education suggests that any single unit change in the female secondary level education will leads towards 0.13 unit changes in female employment, but the relationship between female secondary level education and female employment in the region is insignificant.
Female Tertiary level education is directly and significantly linked with the female employment level in the region. The slope coefficient of tertiary level education shows that any single unit change in the tertiary level education will bring about 0.70 units changes in female employment in the region.
The coefficient of determination statistics shows that change in the female employment in the region are more sensitive to changes in education level across the cross-section rather than the changes in within the cross-section.
4.5. Impact of Education Attainment on Gender Gap of Employment
The unequal employment opportunities for male and female are great obstacle in the way of economic development for any region it is assumed that higher level of education in an economy can work to diminishes this job discrimination. To test the hypothesis of higher level of education leads towards lower job discrimination for the current region the following regression has been set:
 ……………………………………… (5)
Where dependent variable is G_GAP which is gender gap of employment in the region, P_Edu, S_Edu and T_Edu are total primary, secondary and tertiary level educations in the region.
4.5.1. Hausman Specification Test Results
The Hausman test probability value of 0.0000 suggests that the difference between fixed effect and random effect estimations is significant and hence we will use fixed effect model.
Table-9. Hausman Specification Test Results
Coefficients:
| (b) | (B) | (b-B) | sqrt(diag(V_b-V_B)) | |
| Variables | Fixed | Random | Difference | Std.Err |
| P_Edu | -.1202715 | -.1363296 | .0160581 | .0163311 |
| S_Edu | -.3770098 | -.3315375 | -.0454723 | .0275664 |
| T_Edu | -.507809 | -.5810469 | .0732379 | .0390326 |
| b = consistent under Ho and Ha; obtained from xtreg B = inconsistent under Ha, efficient under Ho; obtained from xtreg Test: Ho: difference in coefficients not systematic chi2(3) = (b-B)'[(V_b-V_B)^(-1)](b-B)= 111.90 Prob>chi2 = 0.0000 (V_b-V_B is not positive definite) |
4.5.2. Fixed Effect Model Results
To check whether education can play a vital role in eradication of gender discrimination of employment or not, equation 5 has been untied and the fixed effect model results are given in table 10. The signs of the partial slope coefficients show that all three level of education can work to lower down the gender gap discrimination of employment in the region. That is any increase in the primary, secondary and tertiary level education will decrease gender gap of discrimination.
Table-10. Fixed Effect Model Results
Fixed-effects (within) regression Number of Obs = 75 Group variable: panel Number of groups = 15 R-sq: within = 0.3956 Obs per group: min = 5 between = 0.1595 avg = 5.0 overall = 0.1805 max = 5 F(3,57) = 12.44 corr(u_i, Xb) = -0.0509 Prob > F =0.0000 |
| G_GAP | Coef. | Std.Err. | T | P>ItI | [95% Conf. Interval] |
| P_Edu | -.1202715 | .0861436 | -1.40 | 0.168 | -.2927711 .0522282 |
| S_Edu | -.3770098 | .1068864 | -3.53 | 0.001 | -.5910461 -.1629735 |
| T_Edu | -.507809 | .1983867 | -2.56 | 0.013 | -.9050716 -.1105464 |
| -Cons | 61.71489 | 2.146935 | 28.75 | 0.000 | 57.41573 66.01405 |
sigma_u sigma_e rho |
9.5393144 2.8229543 .91947797 (fraction of variance due to u_i) |
||||
| F test that all u_i=0: F(14, 57) = 45.81 Prob > F = 0.0000 |
P-values 0.000 0.168 0.001 0.013 |

The significance level of primary level education indicates that it is insignificantly linked with the gender gap of employment.
Any single unit increase in the secondary level education in the region is will lowers the gender gap of employment by 0.38 units. Similarly the tertiary level education is negatively and significantly linked with the gender gap of employment, the partial slope coefficient for the tertiary level education suggests that any single unit increase will leads towards 0.50 unit more equal job opportunities for male and female.
The coefficient of determination statistics shows that variation in the gender gap of employment is more explained by the variations within the cross-section rather than the variation among the cross-sections. Also the F-statistics of the model suggest that overall model is significant.
5. SUMMARY AND CONCLUSION
The current work has been carried out to analyze the nexus between education attainment, employment and gender gap in Middle East and North African (MENA) region. In contemporary world Investment in human capital or education is consider as main source of economic growth and Development. Assessing education quality in MENA region is hard but the quantitative statistics are showing good sings, the overall enrolment in region increases from 67.2 percent in 2000 to 78.9 percent in 2013. The average literacy rate during the period of 1990-2014 increases from 58.44 percent to 80.26 percent.
Gender inequalities have twin type negative effects on Economic growth of the economy and ultimately the economic development. On one side it discourages the female labor force by not providing fair job opportunities and on another hand gender inequalities at a large lowers the moral of female labor force for self-development, thus keeping the actual economic growth too much lowers than the potential economic growth by not allowing a larger portion of the labor force to practically and physically participate in the production process. The MENA region situation in respect on Gender gap in not as per expectations and past projections, though female education on the average has increased in the region also health related indicators showed improved trends but the female labor force participation rate has not increased to that extent. The international labor organization ILO’s statistics shows that only 2 percent of age 14 to 64 years worked in the labor market. Total women labor force slightly increases from 18.4 percent in 1990 to 21.3 percent in 2014, it does mean that only one fifth of total labor force are female labor force which is too much lowers then the world average female labor force participation rate of 39.7 percent. The data related to female employment reveals even more tragic condition of the MENA region. Female employment as a ratio of total female population of age 15 and above was only 14 percent in 1995 which only slightly has increased to 17.4 percent in 2014, in comparison to that male employment was 67.4 percent in 1995 and 68.8 in 2014.
The study shows that MENA region has experienced a high pace of population growth leading to high dependency ratios, for the period 1990-2014 population on the average increases by 2 percent annually during the said time period .The average life expectancy from 1980 to 2014 increases 58.9 years to 72.9 years.
The analytical portion of the paper shows that primary, secondary and tertiary level educations are all negatively linked with the male labor force participation rate, i.e. as the primary, secondary and tertiary level education increases it will leads to increases male labor force participation rate. The same results are shown by the male education attainment and male employment analysis for the MENA region.
The analysis about the female education attainment and female labor force participation rate shows that except primary level both secondary level and tertiary level education are positively linked with female labor force participation rate. The regression about the impact of all level of female education attainment on female employment suggests that any increase in all three levels of female education will positively affect female participation rate.
The econometric examination about the link between total education and gender gap of employment leads us to quite genuine and logical conclusion i.e. any increase in total education level will lowers the Gender gap of employment.
6. POLICY IMPLICATIONS
In the light of about analysis and summary and conclusion it is genuine to suggest the following policy implication.
The MENA Countries should focus on making arrangements for female labor force to bring them to the market so that to convert education to employment.
The MENA countries should invest in female education, and adopt gender responsive budgeting policy as that will leads to greater equality and will lead to increase female labor force participation which will ultimately increases their overall economic output.
Investment in total education will leads towards greater employment opportunities for both genders, so Governments should allocate larger portions of their budgets to Education sector.
The MENA countries should remove all discriminative obstacles that preventing women to participate in the labor market.
| Funding: The authors would like to extend my deepest gratitude to Erasmus Mundus PEACE II project (3rd Cohort) for supporting this research in the Interdisciplinary Centre of Social Sciences- University of Minho (Portugal). |
| Competing Interests: The authors declare that they have no competing interests. |
| Contributors/Acknowledgement: Both authors contributed equally to the conception and design of the study. |
REFERENCES
Aguirre, D., H. Leila, R. Christine and S. Karim, 2012. Empowering the third Billion. Women and the world of work in 2012. Booz and Company. Retrieved from http://www.strategyand.pwc.com/media/file/Strategyand_Empowering-the-Third-Billion_Full-Report.pdf.
Akkari, A., 2004. Education in the Middle East and North Africa: The current situation and future challenges. International Education Journal, 5(2): 144-153. View at Google Scholar
Alina, M.I., 2012. How does education affect labor market outcomes? Review of Applied Socio- Economic Research, 4(2): 130.
Chamlou, N., S. Muzi and H. Ahmed, 2011. Understanding the determinants of female labor force participation in the Middle East and North Africa region, the role of education and social norms in Amman. Almalaurea Working Papers No. 31. Retrieved from https://www2.almalaurea.it/universita/pubblicazioni/wp/pdf/wp31.pdf.
Cuberes, D. and M. Teignier, 2012. Gender gaps in the labor market and aggregate productivity. Sheffield Economic Research Paper SERP 2012017. Retrieved from https://www.bancaditalia.it/pubblicazioni/altri-atti-seminari/2013/paper-Cuberes.pdf.
Dollar, D. and R. Gatti, 1999. Gender inequality, income, and growth. Are good times good for women? Policy Research Report On Gender and Development Working Paper Series, No. 1, World Bank.
Duflo, E., 2012. Women empowerment and development. Journal of Economic Literature, 50(4): 1051–1079. View at Google Scholar | View at Publisher
El-Erian, 1997. Growth and stability in the Middle East and North Africa, IMF Publication, 1997. Available from www. Google books.com.
Farzaneh, R.-F. and M.V. Moghadam, 2003. Empowering women, developing society: Female education in the Middle East and North Africa population reference bureau. Retrieved from http://www.prb.org/pdf/EmpoweringWomeninMENA.pdf.
Gangl, M., 2000. Education and labor market entry across Europe: The impact of institutional arrangements in training systems and labor ,markets. MZES working Paper: No. 25. University of Mannheim, 2000 ILO .KILM. Retrieved from http://www.ilo.org/.
Iqbal, F. and K. Youssouf, 2014. Education attainment in the Middle East and North Africa success at a cost. Policy Research Working Paper No. 7127. World Bank, 2014 ILO estimates and projections. Retrieved from http://www.ilo.org/ilostat.
Isfahani, S.-D., N. Belhaj-Hassine and R. Assaad, 2014. Equality of opportunity in educational achievement in the Middle East and North Africa. Journal of Economic Inequality, 12(4): 489-515. View at Google Scholar | View at Publisher
Karshenas, M. and V.M. Moghadam, 2001. Female labor force participation and economic adjustment in the MENA region. In the economics of women and work in the Middle East and North Africa. Emerald Group Publishing Limited. pp: 51–74.
Katie, P., 2013. Education and female labor market participation in the Middle East: A case study of Turkey and Saudi Arabia University of Colorado Boulder Undergraduate Honors Theses, 2013. Retrieved from https://pdfs.semanticscholar.org/dce7/709041c36284c384dd4a7683d96fd8ebdd82.pdf.
Katrrin, E., 2013. Women, Work, and the Economy: Macroeconomic gains from gender equity. IMF Staff Discussion Note, SDN/13/10, (2013). Retrieved from http://www.imf.org/external/pubs/ft/sdn/2013/sdn1310.pdf.
Loko, B. and D.A. Mame, 2009. Revisiting the determinants of productivity growth: What’s new? IMF Working Paper, WP/09/225, IMF, 2009. Retrieved from https://www.imf.org/external/pubs/ft/wp/2009/wp09225.pdf.
Pike, M., 1982. Segregation by sex, earnings differentials and equal pay: An application of a job crowding model to UK data. Applied Economics, 14(5): 503 – 514. View at Google Scholar | View at Publisher
Psacharopoulos, G. and Z. Tzannatos, 1989. Female labor force participation: An international perspective. World Bank Research Observer, 4(2): 187 – 201. View at Google Scholar | View at Publisher
Ross, M., 2008. Oil, islam, and women. American Political Science Review, 102(1): 107–123. View at Google Scholar | View at Publisher
Spierings, N., S. Jeroen and V. Mieke, 2008. Micro and macro-level determinants of women’s employment in six MENA countries, NiCE Working Paper No. 08-104 June 2008. Retrieved from www.ru.nl/publish/pages/516298/nice_08104.pdf.
Tansel, A., 2002. Economic development and female labor force participation in Turkey: Time-series evidence and cross-providence estimates. Economic Research Center Working Papers: 1 – 37. Retrieved from http://citeseerx.ist.psu.edu/viewdoc/download?doi=10.1.1.462.9820&rep=rep1&type=pdf.
World Bank, 2003. Gender equality and the millennium development goal. Retrieved from http://siteresources.worldbank.org/INTGENDER/Publications/20169280/gendermdg.pdf.
World Bank Data, n.d. Retrieved from http://databank.worldbank.org/data/home.aspx.
| Views and opinions expressed in this article are the views and opinions of the author(s), Asian Economic and Financial Review shall not be responsible or answerable for any loss, damage or liability etc. caused in relation to/arising out of the use of the content. |