


DECOMPOSED EFFECTS OF AGRICULTURAL POLICIES: A SOCIAL ACCOUNTING MATRIX APPROACH IN BURKINA FASO

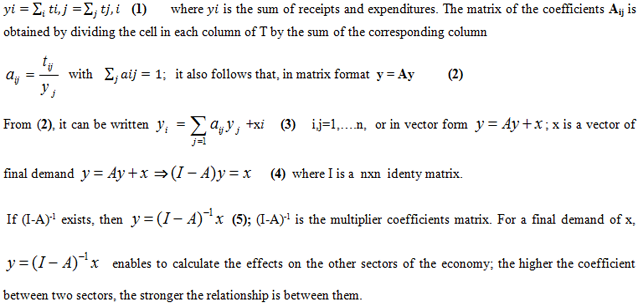
1Agricultural Economist, Center for the Analysis of Economic and Social Policies, Ouagadougou Burkina Faso
ABSTRACT
This paper analyzed the effects of an increase in rice, maize, poultry and cattle demand in Burkina Faso. A SAM of Burkina Faso was used and the technique of effects decomposition developed. The findings clearly show that maize records more effects in terms of income redistribution to households than rice. In contrast, the effects are more important for traded rice; payment to capital is higher than payment to labor in the case of an increase in maize demand. Poultry has a greater potential compared to cattle; it records larger effects in terms of income redistribution to households and factor payment. Recommendations include the implementation of policies that promote village poultry (a relatively low investment, easy gain and short-term payback activity), maize (which can be cropped all year round) and rice in order to better fight poverty, promote inclusive growth, create permanent rural employment and contribute to food security.
© 2017 AESS Publications. All Rights Reserved.
Keywords: SAM, Effect decomposition, Rice, Maize, Cattle, Poultry, Burkina Faso.
Received: 21 November 2016/ Revised: 24 December 2016/ Accepted: 3 January 2017/ Published: 10 January 2017
Contribution/ Originality
This study contributes in the existing literature about Burkina Faso which has a Social Accounting Matrix for the first time. It is one of very few studies which use this SAM estimation methodology to investigate policy impact on the economy. The main findings of this study are that promoting village poultry, rice and maize is able to better fight poverty, to promote inclusive growth, to create permanent rural employment and to contribute to food security in Burkina Faso.
1. INTRODUCTION
Burkina Faso is a West Africa country and agriculture is the main sector of its economy. A major part of the population is living in rural areas and agriculture employs more than 80% of the nation’s labor force; the poverty line is of 40.9% [1]. Despite the importance of this sector, the country experiences food insecurity on an annual basis; therefore, it heavily depends on food imports, mainly rice and milk. Since the structural adjustment programs of the 90s, the government initiated policies and strategies in order to develop cereals and animal products.
In response to food prices increase which ended up with the so-called food crisis in 2008, the government should implement agricultural policies aiming to reverse this food price escalation. Usual government policies consist of (i) subsidizing staple food prices, agricultural inputs and equipment or alternatively (ii) transferring incomes to households. However, the effects of such policies, a priori positive, should be assessed, in order to make sure that objectives are really achieved.
Given inter-linkages between sectors, institutions (households) and production factors in the economy, it is clear that any policy will affect the whole economy but at different levels for the stakeholders.
The present paper assesses the effects of some possible agricultural policies of Burkina Faso using a Social Accounting Matrix (SAM) approach. Section 2 presents the methodology of the analysis: it gives the analytical framework, describes the SAM model in Burkina Faso and the effect decomposition technique. Section 3 discusses the effects of a few agricultural policies that the Government could conduct; the last section draws conclusions and makes some policy recommendations.
2. METHODOLOGY
2.1. The Theoritical Framework
The Social Accounting Matrix was the analytical framework for the study. Several studies used this tool to analyze policies in the agricultural sector in many developing countries. Among others, Powell and Round [2]; Dorosh, et al. [3] and Pyatt and Roe [4] and Arndt, et al. [5] conducted studies in Ghana, Madagascar, Sri Lanka and Mozambique respectively.
The relevance of the approach stems from the shortcomings of previous models, mostly from the partial equilibrium one. Many economic analyses focused on individual households, particularly in rural areas, in order to explain their behavior in terms of demand, production or labor supply. Such partial equilibrium analyses aimed to identify the relationships between different variables and to predict policy impacts.
Similarly, econometric models or mathematical programming methods are developed in order to derive parameters related to different variables under the assumptions that (i) the households are 'price-takers' (prices are given by the market), and that (ii) there is no market imperfection (markets are pure and perfect). In addition, these models are typically "separable" that is, the households’ decisions in terms of production are hardly affected by their consumer characteristics (their preferences for instance).
As it can be seen, the household-based approach has the following shortcomings:
- it ignores the general equilibrium effects of policies on households: these models are able to identify the policy direct effects but not those induced in the whole economic sphere. It is true that any policy has indirect effects at several levels beyond the only households? arising from the interactions between factors of production, activities and households (as decision units), in the form of multiplier effects;
- it does not take into account the interactions, internal to the group of households or those between the latter and the other economic agents. As long as the interrelationships exist between the categories of households as this is the case in practice, the household approach will produce confusing results because based on biased estimates.
The Social Accounting Matrix (SAM) was developed to remedy such shortcomings. Furthermore, another advantage of the SAM is its better capacity to capture policy impact in the agricultural sector. SAM multipliers are larger than those in Leontief input-output models in this sector, due to the stronger income and consumption linkages [6].
Basically, the SAM is a square matrix whose columns and rows represent the receipts and expenditures of economic agents. The cell located at the intersection of a column and a row represents the payment of this column to the agent on this line.
Let Tij be the matrix of transactions; tij is the payment from column j to row i. According to the accounting principle of double-entry, total receipts (income) of each actor must be equal to its expenditures; this means that for the whole matrix, the sum of each line must be equal to the sum of the corresponding column, that is:
Being an enlargement of the model (I-O), the SAM includes socio-economic structures in the analysis and to measure policy effects. Changes in the final demand are the starting point of the simulations using the SAM model after excluding the exogenous accounts. It is then possible, among others, to calculate the effects of policies on the level of activities, income (from activities and factors), to follow the policy effects across the whole economy. However, it is to be noted that policies related to price changes cannot be accounted for by the SAM because it is only a photograph of the situation for a given level of prices. SAM multipliers are able to provide the possible effects of an exogenous injection on different accounts which follow paths through the whole economy [7, 8].
2.2. Data Used: SAM of Burkina Faso
The study used a Social Accounting Matrix of Burkina Faso in 20081 obtained from the national agricultural data directorate. It contains 89 accounts distributed as follows (Table 1):
- 32 production activities different crops: cereals (sorghum, millet, maize, rice), vegetables, fruits, cotton, other cash crops (groundnuts, sesame for example), livestock (cattle, poultry, other activities), fishing activities and forestry;
- 38 commodities;
- 5 factors of production, namely different labor categories (in the public and private sectors) and capital;
- 8 categories of households (households of employees from the public and private (formal and informal) sectors and different types of households (cotton, livestock, food crops producers) as well as independents and inactive households.
- Government with 4 types of taxes
- Savings/investment; and,
- The rest of the world.
Table-1. Accounts of Burkina Faso Social Accounting Matrix, 2008
| Activities(a) | Commodities (c) | Labor and capital(f) | Household categories (h) | Government | Savings-investment | Stock Variation | Rest of the world |
| Rice | Rice | Labor | Households | Government | Savings-investment | Dstk= Stock vari ation | Rest of world |
| Maize | Maize | f_lnpub | h_sprf | Activity tax | |||
| Millet | Sorghum | f_lbpf | h_sprif | Sales taxes | |||
| Sorghum | Millet | f_lapif | h_agcot | Import tariffs | |||
| Fonio | fonio | Capital | h_agviv | Direct taxes | |||
| Vegetables | Vegetables | h_elvag | |||||
| Fruit | Fruit | h_indep | |||||
| Other food crops | Other food stuff | h_inact | |||||
| Cotton | Cotton | ||||||
| Other cash crops | Other cash crops | ||||||
| Cattle breeding | Cattle | ||||||
| Poultry breeding | Poultry | ||||||
| Other livestock breeding | Other livestock commodities | ||||||
| Forest | Forestry | ||||||
| Fisheries | Fisheries | ||||||
| Drinks and tobacco | Drinks and tobacco | ||||||
| Cotton ginning | Fiber Cotton and seeds | ||||||
| Slaughter | Slaughter | ||||||
| Sugar, milk and chocolate | Sugar, milk and chocolate | ||||||
| Oil production | Oils | ||||||
| Other modern food industries | Other modern food commodities | ||||||
| Chemicals production | Chemical products | ||||||
| Textiles and clothes | Agro-chemical products | ||||||
| Other non food industries | Textiles and clothes | ||||||
| Informal food industries | Other modern non-food commodities | ||||||
| Informal non- food industries | Petrolium products | ||||||
| Modern trade | Informal food commodities | ||||||
| Informel Trade | Informal non-food commodities | ||||||
| Modern Transportation | Modern trade | ||||||
| Informal transportation | Informel Trade | ||||||
| Post and télécommunications | Modern Transportation | ||||||
| Financial Services | Informal transportation | ||||||
| Post and télécommunications | |||||||
| Financial Services | |||||||
| Private non-trade services | |||||||
| Public non-trade services | |||||||
| Formal Trade marginal | |||||||
| Informal Trade marginal | |||||||
Source: Translated from the Social Account Matrix of Burkina Faso
2.3. Decomposition of Effects
For a given effect of an injection on any account of the SAM, we investigate the decomposition of such an effect on the different sectors of the economy of Burkina Faso, through the analysis of direct, open-loop (indirect) and closed-loop (circular) effects. The decomposition is done by partitioning the Social Accounting Matrix into endogenous and exogenous accounts; the endogenous accounts can be written in the following form (see Kaboré [8]; Whyeth [9]) for the algebra of the multiplier decomposition).
Let S be the matrix of the SAM coefficients; S=  (6) where A is the matrix of coefficients for production activities, V the matrix of value-added coefficients (factors), Y the matrix of value-added distribution coefficients, E the matrix of expenditure coefficients and H the matrix of household distribution.
The supply and demand balance equations can be written in a vector notation as:
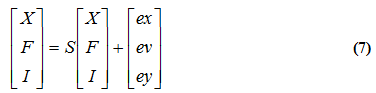
where X is the sector supply, F the vector of value-added by category of factor, I the vector of households, ex the vector of exogenous commodity demand, ev the vector of value-added and ey the vector of exogenous household incomes.
The algebraic manipulation comes up with the SAM multiplier Ma=M3M2M1 (3) (see Kaboré [8] and Whyeth [9]) for intermediate manipulations).
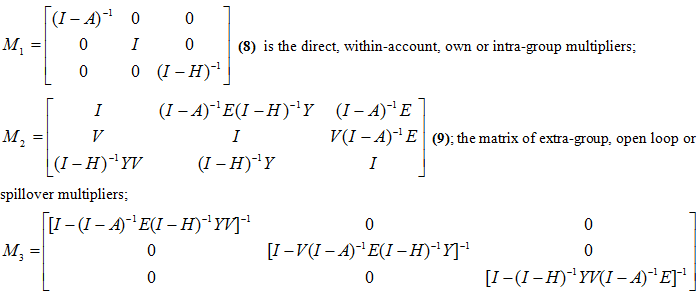
(10) known as inter-group, between-block, circular or closed loop multipliers.
For sake of handiness, the above multiplicative form can be rewritten in the so-called Stone additive version Stone [10]; Pyatt [11]; Shantong, et al. [12] as:
Ma= I+ (M1-I) + (M2-I) M1+ (M3-I) M2M1= I+T+O+C (11) where I is the identity matrix, T= (M1-I), the net direct effects; O= (M2-I) M1, the net indirect, extra-groups effects and C= (M3-I) M2M1, the net circular effects after the original injection.
It can be seen that separating the identity matrix (I) which represents the initial injection from the overall effect, we get the net contribution of the transfers (direct effects) represented by the T matrix, the net cross-effects (matrix O) and finally the net circular effects through the matrix C. The decomposition of multipliers enables to identify the effects of an exogenous shock on the whole economy and therefore to draw policy recommendations.
An injection on a given account in a block (a demand increase for example), will have the following decomposed effects:
- Net direct effects, intra-groups or transfer effects (M1-I): they are felt inside the same block (production block) and are similar to those measured in the Leontief model;
- Net indirect effects, induced or extra-groups effects [(M2-I) M1]: they arerecorded in the same block (sector of production for example) and take end in other blocks;
- Net circular, intergroup or open effects [(M3-I) M2M1]: they go through the whole economy andreturn to the starting block.
It is important to notice that the direct effects are only recorded in the production sector and at institutions level; indirect, cross effect are only present in the relations between different groups, while circular effects go through the whole economy (see Figure 1 for illustration).
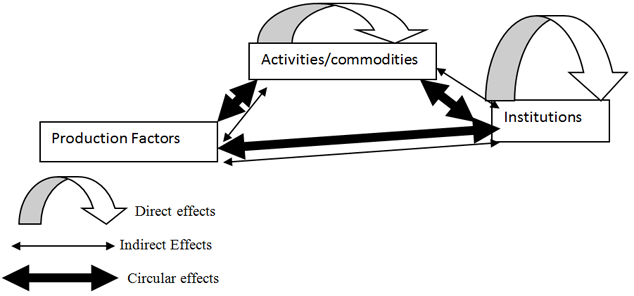
Figure-1. The three types of decomposed effects
Source: adapted from Shantong, et al. [12]:
3. RESULTS AND DISCUSSIONS
Four policy experiments were analyzed: a demand increase in the agricultural sector, namely two (2) in crop production (maize and rice) and two (2) in animal production (cattle and poultry).
3.1. Maize and Rice Demand Increase Experiment
If the rice crisis of 2008 was due to a decline in the supply of rice imported, this was an opportunity for local rice production which should increase in order to meet national needs. Similarly, maize demand increases every year, due to a tremendous urbanization rate (rate of 25-30% by 2020) and to overall changes in eating habits [13].
The increase in the demand for these two commodities induces effects on production, trade and factors of production (labor and capital) as well as on households (workers in the public and private sectors and agricultural producers).
Table 1 shows the effects of an injection of 100 FCFA2 in rice and maize production. Total effects (Ma) indicate that rice demand increase has a larger effect than maize: 378.7 FCFA against 340. In the production segment, the effects boil down to 118.3 FCFA rice against 122 FCFA for maize. For trade, the effects are 36 FCFA for rice and 29 FCFA for maize. The effects on production factors are higher for rice: 97.4 FCFA against 39 FCFA for maize. In contrast, the effects on households are stronger for maize: 140 FCFA against 127 FCFA for rice. In all cases, employees of the private sector and inactive households benefit less from an increase in the demand for the two crops: 4-5FCFA for rice and 2 FCFA for maize.
Beyond the above global picture, a more detailed analysis reveals the following points:
- Direct effects (M1-I): for both crops, effects are higher in the trade sector than in the production one: 16 FCFA against 3.3 FCFA.
- Indirect effects [(M2-I)M1]: they are the most important for households (producers, employees of the public and the private sector and inactive households): 81 FCFA against 68 FCFA for the rice. It is thus apparent that maize contributes to distribute more income to households and highly impacts the production sector. The trend is reversed with respect to the factor payment (labor and capital): an injection of 100 FCFA in rice production induces a 75.4 FCFA payment against only 25 FCFA for maize. It is clear that the capital benefits more from an increase in rice demand than labor: 63 FCFA against 10 FCFA for labor in the agricultural sector. In contrast, labor benefits more from an injection in maize production: 18 FCFA for a total effect of 25 FCFA. Regarding effects on households, one can notice that food crop producers benefit most from an increase in the demand of both commodities: 24FCFA for a total of 68 FCFA for rice against 30FCFA (for a total of 81 FCFA) for maize. Cotton producers and livestock breeders are the second beneficiaries: 12FCFA for rice and 14 FCFA for maize, which is 17-18% of the total payment.
- Circular effects [(M3-I) M2M1]: they are the most important for households: 59 FCFA for both rice and maize. Food producers are the greatest beneficiaries among all households: 17FCFA against 9 FCFA and 11FCFA for cotton producers and animal producers, respectively. The trade sector is the second recipient: 20FCFA for rice and 24FCFA for maize; they are the lowest for production factors for both crops (18FCFA for labor and capital).
Table-1. Selected multiplier effects of an injection of 100 FCFA in rice and maize production, Burkina Faso
Account affected by injection |
I |
M1-I |
(M2-I)M1 |
(M3-I)M2M1 |
Ma |
I |
M1-I |
(M2-I)M1 |
(M3-I)M2M1 |
Ma |
|
Rice |
Maize |
||||||||||
Rice production |
100 |
3,3 |
0 |
1 |
104,3 |
0 |
0 |
1 |
1 |
||
Maize production |
0 |
0 |
6 |
6 |
100 |
4 |
0 |
7 |
111 |
||
Cattle production |
0 |
0 |
4 |
4 |
0 |
0 |
5 |
5 |
|||
Poultry production |
0 |
0 |
4 |
4 |
0 |
0 |
5 |
5 |
|||
Total effects on production |
100 |
3,3 |
0 |
15 |
118,3 |
100 |
4 |
0 |
18 |
122 |
|
Rice trade |
16 |
0 |
3 |
19 |
0 |
0 |
4 |
4 |
|||
Maize trade |
0 |
0 |
7 |
7 |
5 |
0 |
8 |
13 |
|||
Cattle trade |
0 |
0 |
5 |
5 |
0 |
0 |
6 |
6 |
|||
Poultry trade |
0 |
0 |
5 |
5 |
0 |
0 |
6 |
6 |
|||
Total effects on trade |
16 |
0 |
20 |
36 |
5 |
0 |
24 |
29 |
|||
Labor in the agricultural sector |
0 |
10 |
3 |
13 |
0 |
15 |
3 |
18 |
|||
Labor Public sector |
0 |
2 |
4 |
6 |
0 |
3 |
4 |
7 |
|||
Labor formal private sector |
0 |
0,4 |
2 |
2,4 |
0 |
0 |
2 |
2 |
|||
Labor formal private sector |
0 |
4 |
4 |
8 |
0 |
6 |
4 |
10 |
|||
Capital |
0 |
63 |
5 |
68 |
0 |
7 |
5 |
12 |
|||
Total effects on factors |
0 |
79,4 |
18 |
97,4 |
0 |
31 |
18 |
49 |
|||
Public sector employees |
0 |
4 |
6 |
10 |
0 |
5 |
6 |
11 |
|||
Formal private employees |
0 |
2 |
3 |
5 |
0 |
2 |
3 |
5 |
|||
Informal private employees |
0 |
4 |
4 |
8 |
0 |
6 |
4 |
10 |
|||
Cotton producers |
0 |
12 |
9 |
21 |
0 |
14 |
9 |
23 |
|||
Food crops producers |
0 |
24 |
17 |
41 |
0 |
30 |
17 |
47 |
|||
Livestock producers |
0 |
12 |
11 |
23 |
0 |
14 |
11 |
25 |
|||
Independents |
0 |
8 |
7 |
15 |
0 |
8 |
7 |
15 |
|||
Inactive households |
0 |
2 |
2 |
4 |
0 |
2 |
2 |
4 |
|||
Total effects on households |
0 |
68 |
59 |
127 |
0 |
81 |
59 |
140 |
|||
Source: Computation from the SAM by the author.
3.2. Cattle and Poultry Demand Increase Experiment
This experiment relates to a livestock policy including poultry and livestock production. The effects of an increase in the demand (i) for poultry (including the so-called ‘poulet bicyclette’3 or guinea fowl) and (ii) for cattle meat are analyzed. The end of the embargo on poultry exports to Côte d’Ivoire, along with an aggressive marketing policy to promote poultry exports to Central Africa and the development of the mining industry in Burkina Faso, would result in a substantial increase in the demand for poultry. Of course, such a substantial demand increase will have direct, indirect and circular effects. Similarly, any increase in the demand of cattle meat in the coastal countries (Côte d'Ivoire, Ghana, Nigeria) or in other countries such as Algeria or even in Burkina Faso as a result of the mining boom, will end up with a supply boost that will enable producers to avail of those new opportunities.
Table-2. Selected multipliers effects of an injection of 100 FCFA of income in cattle and poultry production, Burkina Faso
Account affected by injection |
I |
M1-I |
(M2-I)M1 |
(M3-I)M2M1 |
Ma |
I |
M1-I |
(M2-I)M1 |
(M3-I)M2M1 |
Ma |
Cattle |
Poultry |
|||||||||
Rice production |
0,04 |
0 |
0,7 |
0,74 |
0 |
0 |
0,8 |
0,8 |
||
Maize production |
0 |
0 |
6 |
6 |
3 |
0 |
7 |
10 |
||
Cattle production |
100 |
0 |
0 |
5 |
105 |
0 |
0 |
5 |
5 |
|
Poultry production |
0 |
0 |
5 |
5 |
100 |
0 |
0 |
5 |
105 |
|
Total effects on production |
100 |
0,04 |
0 |
16,7 |
116,74 |
100 |
3 |
0 |
17,8 |
122 |
Rice trade |
0,2 |
0 |
4 |
4,2 |
3 |
0 |
4 |
7 |
||
Maize trade |
0 |
0 |
8 |
8 |
0 |
0 |
8 |
8 |
||
Cattle trade |
0 |
0 |
5 |
5 |
0 |
0 |
5 |
5 |
||
Poultry trade |
0 |
0 |
6 |
6 |
0 |
0 |
6 |
6 |
||
Total effects on trade |
0,2 |
0 |
23 |
23,2 |
3 |
0 |
23 |
26 |
||
Labor in the agricultural sector |
0 |
0 |
4 |
4 |
0 |
0 |
4 |
4 |
||
Labor Public sector |
0 |
0,2 |
5 |
5,2 |
0 |
0,3 |
5 |
5,3 |
||
Labor formal private sector |
0 |
0,1 |
3 |
3,1 |
0 |
0 |
3 |
3 |
||
Labor formal private sector |
0 |
0,1 |
5 |
5,1 |
0 |
0,6 |
5 |
5,6 |
||
Capital |
0 |
1 |
6 |
7 |
0 |
97 |
6 |
103 |
||
Total effects on factors |
0 |
1,4 |
23 |
24,4 |
0 |
97,9 |
23 |
120,9 |
||
Public sector employees |
0 |
4 |
7 |
11 |
0 |
4 |
7 |
11 |
||
Formal private employees |
0 |
2 |
4 |
6 |
0 |
2 |
4 |
6 |
||
Informal private employees |
0 |
0,5 |
5 |
5,5 |
0 |
0,9 |
5 |
5,9 |
||
Cotton producers |
0 |
15,3 |
11 |
26,3 |
0 |
15,4 |
11 |
26,4 |
||
Food crops producers |
0 |
25 |
19 |
44 |
0 |
26 |
19 |
45 |
||
Livestock producers |
0 |
19 |
12 |
31 |
0 |
19 |
12 |
31 |
||
Independents |
0 |
12 |
8 |
20 |
0 |
12 |
8 |
20 |
||
Inactive households |
0 |
3 |
2 |
5 |
0 |
3 |
2 |
5 |
||
Total effects on households |
0 |
80,8 |
68 |
148,8 |
0 |
82,3 |
68 |
150,3 |
||
Source: Computation from the SAM by the author.
Table 2 gives a picture of effects of an injection of 100 FCFA on cattle and poultry. The total effects (Ma) of an increase in the demand for poultry of 419.2 FCFA are higher than effects on cattle (313.14 FCFA); this means that poultry has a larger potential compared to cattle. In all segments of the economy, effects are more important on poultry: in terms of (i) household income redistribution (150.3 FCFA against 148.8 FCFA for cattle); (ii) on production (122 FCFA against 116.74 FCFA); (iii) on factors (120.9 FCFA against 24.4 FCFA); (iv) on trade, where effects are smaller (26 FCFA against 23.2 FCFA).
Analyzing decomposed effects the following can be highlighted:
- Direct effects (M1-I): poultry records more important effects both in the production than in the trade sector: 3 FCFA against less than 1 FCFA for cattle.
- Regarding indirect effects [(M2-I) M1] they are higher for poultry than for cattle, both for factors (97.3 FCFA against 1.4 FCFA) and households (82.3 FCFA against 80.8 FCFA).
- In terms of circular effects [(M3-I) M2M1], households record the highest effects both for poultry and cattle: 68 FCFA against 23 FCFA in the trade sector and for factors; 17.8 FCFA against 16.7 FCFA for the production segment.
The details show that food crop producers are the greatest recipients: 19 FCFA both for cattle and poultry. Cotton and livestock producers are the second recipients while households in the informal sector, in the public and the private sector and the inactive record the lowest effects.
4. CONCLUSION AND RECOMMENDATIONS
This study aimed to analyze the effects of some policies in Burkina Faso, in particular the effects of an increase of 100 FCFA in rice, maize, poultry and cattle demand.
The findings clearly show that maize records more effects in terms of income redistribution to households than rice. In contrast, the effects are more important for traded rice; payment to capital is higher than payment to labor in case of increase in maize demand.
Poultry has a greater potential compared to cattle; it records larger effects in terms of income redistribution to households and factor payment.
Given the above findings based on hypothetical policies, it appears sound to draw the following recommendations:
- Promote poultry and the maize in order to better fight poverty and promote inclusive growth; that is growth benefiting the largest number of people, particularly in the rural areas. Village poultry breeding which is a relatively low investment, easy gain and of short-term payback activity should be promoted;
- Promote maize cropping: maize demand increased on a long-term basis in Burkina Faso and is expected to keep increasing in the future. Maize can be cropped during the rainy season as well as under irrigation; its cropping could therefore contribute to create permanent rural employment and to food security.
- Given that rice has high payment to capital, it is recommended that the Government take necessary actions to develop rice cropping in order to increase profitability of water control infrastructures in the country and contribute to food security.
| Funding: This study received no specific financial support. |
| Competing Interests: The author declares that there are no conflicts of interests regarding the publication of this paper. |
REFERENCES
[1] Burkina Faso, Plan national de développement economique et social 2016-2020. Burkina Faso: Prime Ministry, 2016.
[2] M. Powell and J. Round, Structural and linkage in the economy of Ghana: A SAM approach in Economic reforms in Ghana: The miracle and the Mirage, edited by Aryeety E., Harrigan J. and Nissanke M. Trenton NJ 08607: Africa World Press Inc, 2000.
[3] P. A. Dorosh, R. A. Bernier, R. Randrianarivony, and C. Rasolomanana, A social accounting matrix for madagascar: Methodology and results. Ithaca, NY: CFNPP, Working Paper Nr. 6, 1991.
[4] G. Pyatt and A. R. Roe, A social account matrix for development planning with special reference to Sri Lanka. England: Cambridge Press, Cambridge University, World Bank and Universiy of Waerwick, 1977.
[5] C. Arndt, T. H. Jensen, and F. Tarp, Structural characteristics of the economy of Mozambique: A SAM-based analysis. Copenhagen, Denmark: DERG, University of Copenhagen, 1998.
[6] E. Sadoulet and A. De Janvry, Quantitative development policy analysis. Baltimore and London: Johns Hopkins University Press, 1995.
[7] E. Thorbecke, "The use of social accounting matrices in modeling," presented at the 26th General Conference of The International Association for Research in Income and Wealth Cracow, Poland, 2000.
[8] D. P. Kaboré, "Conflicts over land in the Niger River Delta Region of Mali: Exploring the usefulness of SAM and CGE models to study participatory natural resource management in agricultural and pastoral systems," Ph.D Thesis, The Netherlands: University of Groningen, 2008.
[9] P. Whyeth, SAM multipliers, their decomposition, interpretation and relationship to input-output multipliers; Research bulletin XB1027, college of agriculture and home economy research center. USA: Washington State University, 1993.
[10] R. Stone, The disaggregation of the household sector in the national accounts in social accounting matrices: A basis for planning. Pyatt, G; Round, J.I Eds. Washington DC: World Bank, 1985.
[11] G. Pyatt, "Some early multiplier models of the relationship between income distribution and production structure," Economic Systems Research, vol. 13, pp. 139-163, 2001. View at Google Scholar | View at Publisher
[12] L. Shantong, G. Ying, and H. Jianwu, "SAM-based multipliers for China’s economy, development research center the state council, P.R.C," presented at the XIIINFORUM World Conference In Marina di Ascea-Velia, Italy, 2004.
[13] J. A. Kaminski, Elbehri, and J. P. Zoma, "Analyse de la filière du maïs et compétitivité au Burkina Faso: Politiques et initiatives d’intégration des petits producteurs au marché dans." Reconstruire Le Potentiel Alimentaire de l’Afrique de l’Ouest, A. Elbehri (Ed.), FAO/FIDA, 2013.
| Views and opinions expressed in this article are the views and opinions of the author(s), Journal of Asian Scientific Research shall not be responsible or answerable for any loss, damage or liability etc. caused in relation to/arising out of the use of the content. |