


OVERRΕACTION ANALYSIS IN STATE-OWNED EQUITIES

1,2Department of Public Administration, Panteion University, Kalithea, Athens, Greece
ABSTRACT
This paper challenges the research hypothesis that psychological factors and market sentiment can influence and alter the trajectory of state-owned equities. For this purpose, an overreaction analysis was performed in a wide data spectrum consisting of daily returns of 184 state-owned enterprises operating in countries from three continents, over a ten year period divided in five biannual test periods. Portfolio separation and Cumulative Abnormal Returns generated no evidence towards the existence of overreaction phenomena across all test-periods. Average and Median Cumulative Abnormal Returns, tested with parametric and nonparametric statistical analysis, did not exhibit reversal patterns in the behavior of loser and winner portfolios, thus neutralizing the possibility of earlier overreaction in the state-owned stocks under study. The outcome concerning state-owned enterprises contrasts with the corresponding research hypothesis and outcomes in the literature regarding behavioral economics and overreaction effects in private enterprises.
© 2017 AESS Publications. All Rights Reserved.
Keywords: Behavioral economics, Overreaction, Stock return, Public sector, State-owned enterprises.
JEL Classification: D03, G0, C1.
Received: 15 August 2016/ Revised: 1 December 2016/ Accepted: 20 December 2016/ Published: 4 January 2017
Contribution/ Originality
This study contributes in the theoretical and empirical investigation of the differences and similarities between state and private owned companies regarding reversal patterns in their stock behavior and overreaction phenomena. It presents and analyzes the results of an empirical survey addressing a wide data spectrum consisting of daily returns of 184 state-owned enterprises operating in countries from three continents, over a ten year period. Statistical methodology, commonly used in the literature of behavioral economics in the private sector, is applied here in order to provide inference for the public sector as well.
1. INTRODUCTION
Neoclassical economics and the rational choice theory (Becker, 1976) are based on three key assumptions: i) people make rational choices among different solutions, ii) people tend to maximize utility and firms tend to maximize profits and iii) people act on their own, making use of all available, relevant information. Furthermore, the neoclassical theory led to the Efficient Market Hypothesis (Fama, 1970) supporting the belief that market movements and trends can be viewed as results of the rational investment thinking and careful analysis of all available and relevant data. Recently, many researchers have challenged the core principles of the Efficient Market Hypothesis and the modern neoclassical “faultless” description of the markets. Bayes' rule violations noted by Kahneman and Tversky (1977); Schiller (1981) argument of irrational disagreement in dividends variation compared to aggregate stock volatility and Basu (1977) price-earnings ratio anomaly noted as P/E ratio discordance to future stock returns are only few examples of criticism to neoclassical theory and the pure rational thinking in economics.
Behavioral economics study the concepts, effects and results beyond the limits of rationality arguing that social, psychological, and emotional mechanisms form the investors’ unique characteristics and drive them to reactions and decisions, not always in tandem with the neoclassical maximum utility and profit principal. The three major issues in behavioral economics (Shefrin, 2002) heuristic and biased decision making ii) framing by stereotypes, filters and personal boundaries resulting in irrational decisions and iii) market inefficiencies such as mis-pricings and counter-productive procedures that push or drive to abnormal results. Back in the early days of the economic theory foundation, Smith (1761) and Keynes (1936;1937) were among the first to mention the psychological and sentimental effects, including morality, ethics, philosophy as well as psychological states such as optimism and pessimism, as possible solutions to economic functions and financial behaviors. Furthermore, Keynes (1930) introduced social factors, such as imitation and joining the crowd, as possible market forces.
On the other hand, stated-owned enterprises comprise an economic sector that has not yet been thoroughly tested for behavioral economics' implementation. The OECD (2014) defines a state-owned enterprise as any autonomous public entity i) involved in commercial activities and ii) controlled, directly or via other government-controlled institutional units, by the central or federal government. State, in most countries, is a major factor in the local economy, participating in almost every aspect of daily life and economic activity. Moreover, stated-owned companies are a basic element of a nation’s integrated financial interactions, although the volume and degree of integration varies among different countries. The purpose of this paper is to test the research hypothesis that psychological factors and market sentiment can influence and alter the trajectory of state-owned equities.
The presented overreaction quantitative research contributes in academic literature concerning stated-owned companies and behavioral economics. It also provides managers and decision makers in stated-owned companies with data, methods and tools that can be implemented in key areas such as abnormal equity fluctuations, risk management, comparison to private-owned companies, opportunities and threats in privatization or nationalization efforts and long-term investment policies.
This paper challenges the research hypothesis that psychological factors and market sentiment can influence and alter the trajectory of state-owned equities. For this purpose, an overreaction analysis was performed in the daily returns of a sample of state-owned enterprises over a ten year period. Portfolio separation and Cumulative Abnormal Returns along with Average and Median Cumulative Abnormal Returns were tested with parametric and non parametric statistical methods in order to reveal evidence of overreaction phenomena.
Following the introductory Chapter 1, Chapter 2 covers a brief literature review of the overreaction analysis and applications complemented by some more general references to behavioral economics. Chapter 3 discusses data and methodology, while results and conclusions are summarized in Chapters 4 and 5 respectively.
2. LITERATURE REVIEW
In an attempt to solve the equilibrium puzzle in the markets with rational and partly-rational agents, Rusell and Thaler (1987) argued that rational investors are not enough to guarantee a rational balance in any market that also involves quasi-rational investors. Kahneman and Tversky (1979) described how decisions in diverse risk situations are altered by cognitive psychology and the perceivable assessment of the risk components. In a different area of behavioral economics, Laibson (1997) and Frederick et al. (2002) employed the concept of time discounting. They identified the effect of time and value over time in investor decisions, arguing that they lead them towards irrationality, away from the norm of neoclassical theories. Bounded rationality, as described by Simon (1982) and Kahneman (2003) is another aspect of behavioral economics focusing on limitations to human information processing and problem solving, which consequently forces investors to implement rules of thumb and heuristic ways instead of optimal processing calculations.
Another interesting viewpoint of behavioral economics is the dual system theory (Kahneman, 2011; Samson and Voyer, 2012;2014). According to this theory the decision making process is based on two separate systems in the human brain, i) System 1: an automatic, intuitive, experienced based and mostly unconscious system which is more dominant when circumstances such as cognitive busyness, distraction, time pressure, and positive mood occur and ii) System 2: a controlled, reflective, analytical and conscious system, which is more dominant around decisions of high importance, elevated personal relevance and significant accountability. The dual system theory is the depiction of alterations in decision-making based on spontaneous circumstances and random psychological environment parameters. Shleifer and Summer (1990) in their approach of investor sentiment/ limited arbitrage theory discussed how irrational investors influence market trends by getting involved in trend chasing and stop loss investment strategies, as a consequence of noise trading and sentimental decisions. Daniel et al. (1998) employing self-attribution theory, showed that the positive correlation of public and private information leads to investor confidence and overreaction/underreaction phenomena. On the other hand, contradictory public to private information leads to the loss of confidence and imitation of public trends.
DeBondt and Thaler (1985) pioneers in overreaction analysis, successfully detected the existence of such phenomena in stock markets using cumulative abnormal returns and winner-loser portfolios. Jegadeesh and Titman (1993) were able to predict profitable strategies by using past returns and employing the overreaction methodology. According to Devenow and Welch (1996) herding can be classified in three categories i) the irrational view referring to the way investors blindly mimic other investors’ actions, a behavior that leads to herding, ii) the near-rational view referring to the heuristic ways in which investors acquire and process information resulting in similar decisions and iii) the rational view in which investors consciously mimic other investors to hide their lack of information or expertise. Moreover, Bikhchandani and Sharma (2001) divided herding into i) spurious herding, as a result of changes in fundamentals and underlying value of a stock and ii) intentional herding as a deliberate imitation of other investors to exploit their knowledge and experience. These developments have justified the addition of the behavioral factors, as a third set of factors, next to neoclassical market and macroeconomic factors that contribute to price formation and changes.
According to Brown and Harlow (1988) the overreaction hypothesis consists of three main propositions: i) Directional effect: extreme movements in stock prices will be followed by subsequent price movements in the opposite direction, ii) Magnitude effect: the more extreme the initial price movements, the greater the following subsequent adjustment will be and iii) Intensity effect: the shorter the time duration of the initial effect, the more extreme the subsequent reversal will be. As it was mentioned earlier in this chapter, DeBondt and Thaler (1985) were among the first to successfully detect empirical proof of overreaction in New York Stock Exchange (NYSE) and they were also able to provide predictions of correcting moves of equities that had demonstrated abnormal behavior in the past. Lehman (1990) studied overreaction in short-term time frames and concluded that were possibly weekly price reversals in a somehow arbitrary function of the market, possibly caused by the inefficiencies in market liquidity around major price fluctuations. In a similar research concerning the Brazilian stock market, DaCosta and Newton (1994) observed sizeable price reversals in 2 year time-periods, significantly higher than those in US stock markets. They also noticed an asymmetry in the price reversals between overreacted and underreacted equities. Studying technology stocks fluctuations, Akhigbe et al. (2002) compared extreme changes in technology stocks to a corresponding non-technology portfolio demonstrating similar extreme changes during the same period. Their results pointed out to a unique behavior of the technology equities, which experienced overreaction in a greatly elevated degree in contrast to the corresponding test portfolio.
Information releases have also been vital in overreaction analysis. Atkins and Dyl (1990) tested for abnormal stock movements relative to the release of favorable or unfavorable information. Their findings pointed to statistically significant abnormal returns and irrational cumulative average abnormal returns the days after sudden price changes, due to new information release. Bremer and Sweeney (1991) argued upon the excessive negative 10-day returns that led to respectively excessive positive abnormal returns the following days, attributed to overreaction to negative news with a positively adjustment-period of two days. In the London stock exchange, Spyrou et al. (2007) found no abnormal reactions after extreme price shocks for large cap equities. Their results though, for medium and small cap equities, were affirmative towards short-term underreaction to both positive and negative market shocks. Furthermore, the authors were not able to attribute the situation to either time-related anomalies, bid-ask biases or other economic fluctuations.
Regarding the analysts’ earnings forecasts, Amir and Ganzach (1998) tested how and in what extent leniency, representativeness, anchoring and adjustment created conditions for overreaction in forecasts about future earnings. Their findings indicated that analysts overreacted in forecast changes and underreacted in forecast revisions. Moreover, the authors concluded that positive forecast modifications led to overreaction, while negative forecast modifications led to underreaction. It was also found that the levels of overreaction, underreaction and excess optimism were positively correlated with the forecast horizon, implying a relationship between prediction horizon and prediction bias. Massey and Wu (2005) concluded that underreaction appeared more often in unstable environments with precise information, while overreaction was more common in stable environments with noisy information.
Analyzing data from different exchange markets, Parikaris and Syriopoulos (2008) investigated the Turkish Lira, the Brazilian Real, the British Pound and the US Dollar for overreaction after 1-day extreme fluctuations in their corresponding exchange rates with the Euro. They found that Lira, Real and Dollar overreacted the days following the extreme movements while under the same circumstances the Pound underreacted. Moreover, the authors argued that the currency markets under test could yield profits by employing contrarian strategies. Anusakumar and Abdullah (2014) in a broader research for 21 currencies, using the same method of testing after 1-day excessive fluctuations in exchange rates, found the existence of overreaction. Cumulative abnormal returns' results were also detected in the presence of investors’ over-optimism, while there were no differences in levels of overreaction between developed and emerging markets. Larson and Madura (2001) also concluded that currencies in developing markets were mostly overreacting while currencies in industrial markets mostly underreacted, arguing that currencies tend to underreact to the release of significant political and economic news while earlier they had overreacted to rumors of the same news.
Commodities markets have also been examined for overreaction/underreaction behavior. Hsu et al. (2013) validated the underreaction hypothesis in agricultural commodities, such as soft commodities, grains and livestock, and the overreaction hypothesis in non-agricultural commodities such as metals and energy. Spyrou (2006) in a study regarding behavioral economics in Brent crude oil, gold and robusta coffee contracts, reported the existence of investors' i) overreaction in International Petroleum Exchange (IPE) Brent crude oil futures after positive market shocks, ii) underreaction in Commercial Exchange (CMX) gold futures following negative price shocks and iii) underreaction in London International Financial Futures and Options Exchange (LIFFE) Robusta coffee futures after positive price shocks. The author also identified possible arbitrage gains through exploitation of these anomalies and adjusted investment strategies. In a paper for the Real Estate Investment Trust (REIT) markets, Simpson et al. (2009) argued that dividend announcements led to overreaction and over-optimism among investors. They also concluded that market reaction was not only based on the dividend announcements but also on the monetary policy in effect and the perceived distinction between good and bad announcements.
3. DATA AND METHODOLOGY
Data for the overreaction analysis consists of daily returns of 184 state-owned equities, alongside with daily returns of 30 main stock exchange indices related to abnormal returns. The sample was formed from state-owned companies operating in a variety of economic sectors and industries, such as : i) oil and gas industry, ii) electricity production and distribution, iii) commodities extraction and processing, iv) machinery manufacturing, v) transportation services, vi) financial services, vii) telecommunications, viii) utilities and x) construction operations. Geographically, sample covers three main regional areas, Asia (China, India, Indonesia, Thailand, Malaysia, Singapore, S. Arabia, Hong Kong and others), Europe (Russia, Poland, France, Greece, Norway, Finland and others) and the Americas (Brazil, United States, Colombia and Chile). In market valuation terms, sampled companies amassed a market capitalization of 2,377,897,005,882.00 € or $2,581,682,779,286.09 at the end of the test period, on December 31st, 2015. Most of the companies in the sample are located in Asia with a market capitalization worth of 1,690,529,192,991.20 €, while European and American companies in the sample were worth a sum of 398,068,981,916.00 € and 289,298,830,980.00 € respectively. The segmentation of the sampling units by sector shows that the oil and gas industry with a market capitalization of 871,923,382,131.79 € has the lead, trailed by the financial services with a market valuation of 554,705,904,757.49 € and the telecommunications industry with a market capitalization of 338,891,502,996.78 €. The other industries are following with smaller figures.
The sample reference period is from January 2004 to December 2015. During this period over 550,000 daily returns for the 184 state-owned enterprises were recorded in the sample along with about another 90,000 values of daily returns originated from the 30 main stock indices. The length of the reference period and the volume of our sample data are sufficient in order to provide the necessary supporting mainframe for a long-term quantitative analysis over three different sub-periods. These are: the period before the major financial crisis in 2008, the period around the financial crisis in 2008 and the period after the financial crisis in 2008. Comparative analysis of the data from the three different periods is used to detect any abnormal behavior of state-owned equities during different economic and financial environments such as economic growth and prosperity, market turmoil in conjunction with economic trough, and finally long-term volatility characterized by anemic growth. Sample data is therefore organized into biannual non overlapping segments as follows: 2004-2005, 2006-2007, 2008-2009, 2010-2011, 2012-2013, and 2014-2015.
The majority of overreaction analysis studies employ statistical tools such as Cumulative Abnormal Returns (CARs), winner/loser portfolios and t-test statistics in order to validate the significance of survey results. Abnormal Returns calculation is a useful tool to determine abnormal movements of a stock in respect to a benchmark index, most commonly the stock market main index. Moreover, Cumulative Abnormal Returns support the detection of behavioral phenomena as they provide critical information on the long-term stock trends and long-term reversal tendencies of overreacting stocks. On the other hand, the analysis of winner/ loser portfolios reveals unequal trends between stocks that are positively overreacting and stocks that are negatively overreacting. Successful detection of dissimilar fluctuations between upward and downward moving stocks, in conjunction with any possible external data and economic shocks unveil the mechanism of behavioral economics' motions.
Daily stock and market returns are calculated and then processed in order to estimate daily abnormal returns of each corresponding stock. The main difficulty lies upon the fact that sampled state-owned enterprises are listed in stock exchanges all around the world. That implies that Abnormal Returns of each stock have to be estimated in respect to their corresponding main index, increasing the complexity and the volume of calculations (Baytas and Cakici, 1999).
Daily Abnormal Returns for stocks are calculated as:
 ,
,
where
 is the Abnormal Return of stock i at time t,
 is the return of stock i at time tand
 is the return of the corresponding to stock i market index M at time t.
Next, we compute the Cumulative Abnormal Returns for stocks in the two-year time periods in order to evaluate the performance of prior test-period generated winner and loser portfolios and also form the new winner and loser portfolios for the upcoming test period. Cumulative Abnormal Returns for two-year period are calculated as:
where
 is the Cumulative Abnormal Return of stock i and
 is the summation of Abnormal Returns of stock i over the two-year period (day 1 to 730).
Using the same methodology of portfolio formation as Soares and Serra (2005) in their research for the Portuguese stock exchange, the winner and loser portfolios under test will consist of the top 20% performing equities and the bottom 20% performing equities of the corresponding formation period respectively. In order to better depict the general trend of portfolios under test, Average Cumulative Abnormal Returns (Spyrou et al., 2007) will be calculated as:
where
 is the Average Cumulative Abnormal Return for portfolio i,
N: is the number of Cumulative Abnormal Returns that form portfolio i,
 is the Cumulative Average Return of stocks forming portfolio i.
The overreaction hypothesis argues that after the formation period, stocks that were assigned to the winner portfolio, due to high positive Cumulative Abnormal Returns, they will reverse their trend and exhibit negative Cumulative Abnormal Returns in the upcoming test period. Therefore, winner portfolio Average Cumulative Abnormal Return for the test period should be negative, ACARW,t < 0. On the other hand, stocks assigned to the loser portfolio, due to low negative Cumulative Abnormal Returns in the formation period, adjust their returns and demonstrate upward movement resulting in a positive Average Cumulative Abnormal Return in the test period, ACARL,t > 0. The immediate implication of the reversal of overreaction phenomena is that the loser portfolio should outperform the winner portfolio and consequently
dt = ACARL,t – ACARW,t > 0
where,
ACARL,t: is the Average Cumulative Abnormal Return for loser portfolio at period t
ACARW,t: the Average Cumulative Abnormal Return for winner portfolio at period t
To test for the statistical significance of DeBondt and Thaler (1985) performed the Student t-test for difference in the means of the portfolios. Certain restrictions on the efficiency of this test are imposed when its basic assumption regarding normality in distribution, (almost) equal sizes and same variances for the two groups are violated. As a consequence, the alternative Satterthwaite-Welch t-test is used in our overreaction analysis. The Satterthwaite-Welch t-test provides more reliable results than the Student t-test for normally distributed samples when the other two assumptions are not met. The main difference in methodology is that the Satterthwaite-Welch t test uses the individual standard deviations of the two independent samples and not the pooled standard deviation used by the Student t-test. The null and the alternative hypothesis for the Satterthwaite-Welch t-test are stated as:
H0: ACARL = ACARW
H1: ACARL ≠ ACARW.
Significantly, large values of Satterthwaite-Welch t-statistics support the hypothesis that the Average Cumulative Abnormal Returns of the two portfolios are not equal. A positive and statistically significant t-value would support the hypothesis of overreaction, implying that the performance of the loser portfolio is better than that of the winner portfolio. This can be interpreted by the fact that the loser portfolio is correcting its previous negative overreaction with an upward trend, while the winner portfolio is retreating to negative levels correcting its positive overreaction.
Further concern about the normality of the sample distributions justifies the use of non-parametric tests, based on the ranks of the data points and the medians of the two groups. Equities and stock market indices do not always follow a rational behavior considering their trends, and can therefore exhibit extreme values from time to time, consequently resulting in samples that are not evenly distributed. Moreover, the estimation of abnormal returns that employs both stocks and stock indexes could further amplify the problematic nature of stocks’ fluctuations and result in even more irregular samples. Therefore, we apply the Mann-Whitney U-test, which performs efficiently under the normality assumption violation, testing the following pair (H0, H1) of hypotheses.
H0: Median(CARL ) = Median(CARW )
H1: Median(CARL) ≠ Median(CARW)
using the U statistics:
where,
n1, n2 the sizes of sample 1 and 2 respectively
Ri the ranks of the first sample
A positive, significant large, value for U supports the alternative hypothesis (H1) indicating uneven performance of the two portfolios attributed to reversal patterns of prior upward and downward trends.
4. RESULTS
The time series graphs for all five test-periods printing the loser and winner portfolios Average Cumulative Abnormal Returns are presented in figure 1 indicating the following observations.
None of the five test-periods data met the criteria to successfully claim reversal trends of prior overreaction phenomena. Loser portfolios in all cases tend to move randomly over and under the zero benchmark line, without a distinctive upward pattern, failing to depict a sustained positive movement correcting the negative Cumulative Abnormal Returns that classified them to the loser portfolios. Moreover, winner portfolios are characterized by a neutral behavior, being more subtle and smooth in their Average Cumulative Abnormal Returns trajectories. There is also a movement towards the positive territory of the graph, instead of the negative values expected in a reversal movement of their prior positive abnormal returns. In addition, winner portfolios seem to outperform the corresponding loser portfolios in all time-periods, with the exception of the 2014-2015 test-period. Consequently the observed pattern does not support an argument for overreaction phenomena.
A more careful look at the evolution of time series graphs reveals the possibility of shorter-term (shorter that the two year time-frame of the current research) overreaction phenomena and reversal patterns describing the behavior of loser portfolios in test-periods 2006-2007, 2008-2009 and 2010-2011. Summarizing our graph analysis we cannot detect possible overreaction phenomena, with the exception of the behavior of winner portfolio in test-period 2014-2015, which could be considered as subtle hint of a positive overreaction of the portfolio’s equities during the formation period of 2012-2013.
The outcome of the Satterthwaite-Welch t-test, summarized in Table-1, indicates statistically significant differences, at α = 1% level of significance, in Average Cumulative Abnormal Returns between loser and winner portfolios for three test periods, 2008-2009, 2010-2011 and 2012-2013. For the other two periods, 2006-2007 and 2014-2015 we do not have enough evidence to reject the null hypothesis of equal means. This is a clear indication that there were no reversal patterns characterizing the two portfolios, disallowing any argument for overreaction effects during the corresponding formation periods.
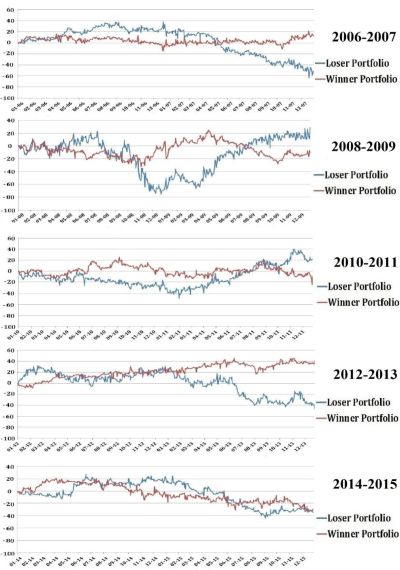
Figure-1. Loser & Winner Portfolios’ Average Cumulative Abnormal Returns over time
Concerning the other three test-periods, where significant differences were concluded, their negative values also underline the fact that the loser portfolio was highly outperformed by the winner portfolio, a completely contradictory behavior to that expected in cases of overreaction phenomena. As a conclusion, Satterthwaite-Welch t-test results do not provide evidence of overreaction in state-owned equities during the test-period.
Table-1. Satterthwaite-Welch t-test
| Formation Period | Test Period | ACARL | ACARW | ACARL ACARW | S-W test statistics (p-value) |
| 2004-2005 | 2006-2007 | 0.032149 | 0.037297 | -0.005148 | -0.5731(0.5666) |
| 2006-2007 | 2008-2009 | -0.133609 | -0.065922 | -0.067687 | -4.7726(0.0000) |
| 2008-2009 | 2010-2011 | -0.112644 | 0.007673 | -0.120317 | -10.2961(0.0000) |
| 2010-2011 | 2012-2013 | 0.005647 | 0.219269 | -0.213622 | -12.8440(0.0000) |
| 2012-2013 | 2014-2015 | -0.040398 | -0.043501 | 0.003103 | 0.1856(0.8527) |
The outcome of the Mann-Whitney U-test (Table-2) clearly indicates that there are significant differences between the medians (or else the distributions) of the loser and winner portfolios in all test-periods. In all test periods but the first one (2006-2007) the winner portfolios outperform loser portfolios. Therefore, the final outcome from the Mann-Whitney U-test is once more the rejection of overreaction argument concerning state-owned equities.
Table-2: Mann-Whitney U-test
| Test Period | MCARL | MCARW | MCARL-MCARW | Mann-Whitney U-test | |
| 2004-2005 | 2006-2007 | 0.110606 | 0.006213 | 0.104393 | 11.4702 (0.0000) |
| 2006-2007 | 2008-2009 | -0.107764 | -0.057387 | -0.050377 | 12.8386 (0.0000) |
| 2008-2009 | 2010-2011 | -0.015645 | 0.017345 | -0.032990 | 9.9980 (0.0000) |
| 2010-2011 | 2012-2013 | 0.016480 | 0.022143 | -0.005663 | 6.3282 (0.0000) |
| 2012-2013 | 2014-2015 | -0.014147 | 0.015083 | -0.029230 | 12.2955 (0.0000) |
5. CONCLUSIONS
The main purpose of this work was to test the research hypothesis that psychological factors and market sentiment can influence and alter the trajectory of state-owned equities. Therefore an overreaction analysis was performed in a wide data spectrum consisting of 184 state-owned enterprises operating in countries from three continents, over a ten year period divided in five biannual test periods. Portfolio separation and Cumulative Abnormal Returns generated no evidence towards the foundation of overreaction phenomena across all test-periods. Average and Median Cumulative Abnormal Returns tested with parametric and nonparametric statistical analysis, did not exhibit reversal patterns in the behavior of loser and winner portfolios, thus eliminating the possibility of earlier overreaction in the state-owned stocks under study. The outcome concerning state-owned enterprises contrasts with research hypotheses and outcomes in the literature regarding behavioral economics and overreaction effects in private enterprises.
A possible explanation behind that odd divergence of state-owned equities from the norm of other industries and markets could be derived from the very nature of state ownership. More specifically, one can argue that: i) state-ownership shapes a distinctive attribute of state-owned enterprises, that of trust. Investors perceive state companies as solid and firm institutions, governed by long-term policies and experienced managers. Consequently, they grant those entities with a degree of immunity to short-term market shocks and temporary extreme movements that cause overreaction, ii) state-ownership stocks are not fully traded in stock exchanges, having certain limitations and restrictions imposed by the state. Shallow markets and concentration of stocks in relatively few shareholders prevent state-owned stocks from being affected by sentiment and psychological factors, negating the effect of sudden market shocks and irrationally driven extremities.
Future research can be addressed to further investigation of the differences and similarities between state and private owned companies regarding reversal patterns in the behavior and overreaction phenomena. Also overreaction analysis can be tested in different time periods, since our research indicated that shorter time periods could possibly yield different results and more intriguing background information.
| Funding: This study received no specific financial support. |
| Competing Interests: The authors declare that they have no competing interests. |
| Contributors/Acknowledgement: All authors contributed equally to the conception and design of the study. |
REFERENCES
Akhigbe, A., S. Larson and J. Madura, 2002. Market underreaction and overreaction of technology stocks. Journal of Psychology and Financial Markets, 3(3): 141-151. View at Google Scholar | View at Publisher
Amir, E. and Y. Ganzach, 1998. Overreaction and underreaction in analysts' forecasts. Journal of Economic Behavior and Organization, 37(3): 333–347. View at Google Scholar | View at Publisher
Anusakumar, S. and N.A. Abdullah, 2014. Does the foreign exchange market overreact? Asian Journal of Business and Accounting, 7(2): 117. View at Google Scholar
Atkins, A. and E. Dyl, 1990. Price reversals, bid-ask spreads, and market efficiency. Journal of Financial and Quantitative Analysis, 25(4): 535–547. View at Google Scholar | View at Publisher
Basu, S., 1977. Investment performance of common stocks in relation to their price-earnings ratios: A test of the efficient market hypothesis. Journal of Science, 32(3): 663-682. View at Google Scholar | View at Publisher
Baytas, A. and N. Cakici, 1999. Do markets overreact: International evidence. Journal of Banking and Finance, 23(7): 1121-1144. View at Google Scholar | View at Publisher
Becker, S., 1976. The economic approach to human behavior. Chicago: The Univ. of Chicago Press.
Bikhchandani, S. and S. Sharma, 2001. Herd behavior in financial markets. IMF Staff Papers, 47(3): 279–310.
Bremer, M. and R. Sweeney, 1991. The reversal of large stock-price decreases. Journal of Finance, 46(2): 747-754. View at Google Scholar | View at Publisher
Brown, K. and W. Harlow, 1988. Market overreaction: Magnitude and intensity. Journal of Portfolio Management, 14(2): 6-13. View at Google Scholar | View at Publisher
DaCosta, J. and C.A. Newton, 1994. Overreaction in the Brazilian stock market. Journal of Banking and Finance, 18(4): 633-642. View at Google Scholar | View at Publisher
Daniel, K., D. Hirshleifer and A. Subrahmanyam, 1998. Investor psychology and security market under and overreaction. Journal of Finance, 51(6): 1839-1885. View at Publisher
DeBondt, W. and R. Thaler, 1985. Does the stock market overreact? Journal of Finance, 40(3): 793-805. View at Google Scholar
Devenow, A. and I. Welch, 1996. Rational herding in financial economics. European Economic Review, 40(3-5): 603–615. View at Google Scholar | View at Publisher
Fama, F.E., 1970. Efficient capital markets: A review of theory and empirical work. Journal of Finance, 25(2): 383-417.
Frederick, S., G. Loewenstein and T. O'Donoghue, 2002. Time discounting and time preference: A critical review. Journal of Economic Literature, 40(2): 351-401. View at Google Scholar | View at Publisher
Hsu, C.H., Y.C. Chiang and T.L. Liao, 2013. Overreaction and underreaction in the commodity futures market. International Review of Accounting, Banking and Finance, 5(3-4): 61-83.
Jegadeesh, N. and S. Titman, 1993. Returns to buying winners and selling losers: Implications for stock market efficiency. Journal of Finance, 48(1): 65-91. View at Google Scholar | View at Publisher
Kahneman, D., 2003. Maps of bounded rationality: Psychology for behavioral economics. American Economic Review, 93(5): 1449-1475. View at Google Scholar | View at Publisher
Kahneman, D., 2011. Thinking, fast and slow. London: Allen Lane.
Kahneman, D. and A. Tversky, 1977. Intuitive prediction: Biases and corrective procedures. McLean VA: Decisions and Designs Inc.
Kahneman, D. and A. Tversky, 1979. Prospect theory: An analysis of decision under risk. Econometrica, 47(2): 263-291. View at Google Scholar | View at Publisher
Keynes, J.M., 1930. In a treatise on money. London: Macmillan.
Keynes, J.M., 1936. In the general theory of employment, interest and money. London: Macmillan.
Keynes, J.M., 1937. The general theory of employment. Quarterly Journal of Economics, 51(2): 209–223.
Laibson, D., 1997. Golden eggs and hyperbolic discounting. Quarterly Journal of Economics, 112(2): 443-477. View at Google Scholar
Larson, S. and J. Madura, 2001. Overreaction and underreaction in the foreign exchange market. Global Finance Journal, 12(2): 153-177. View at Publisher
Lehman, B., 1990. Fads, martingales and market efficiency. Quarterly Journal of Economics, 105(1): 1-28. View at Publisher
Massey, C. and G. Wu, 2005. Detecting regime shifts: The causes of under- and overreaction. Management Science, 51(6): 932-947. View at Google Scholar | View at Publisher
OECD, 2014. The size and sectorial distribution of SOEs in OECD and partner countries. Paris: OECD Publishing.
Parikaris, G. and T. Syriopoulos, 2008. Contrarian strategy and overreaction in foreign exchange markets. Research in International Business and Finance, 22(3): 319-324. View at Google Scholar | View at Publisher
Rusell, T. and R. Thaler, 1987. The relevance of quasi rationality in competitive markets. American Economic Review, 77(3): 499-501.
Samson, A. and B. Voyer, 2012. Two minds, three ways: Dual system and process models in consumer psychology. Academy of Marketing Science Review, 2(2-4): 48–71. View at Google Scholar | View at Publisher
Samson, A. and B. Voyer, 2014. Emergency purchasing situations: Implications for consumer decision-making. Journal of Economic Psychology, 44: 21-33. View at Google Scholar | View at Publisher
Schiller, R., 1981. Do stock prices move too much to be justified by subsequent changes in dividends? American Economic Review, 71(3): 421-436.
Shefrin, H., 2002. Beyond greed and fear: Understanding behavioral finance and the psychology of investing. New York: Oxford University Press.
Shleifer, A. and L. Summer, 1990. The noise trader approach to finance. Journal of Economic Perspectives, 4(2): 19-33. View at Google Scholar | View at Publisher
Simon, H., 1982. Models of bounded rationality. Cambridge, MA: MIT Press.
Simpson, M., J. Emery and J. Moreno, 2009. Overreaction and underreaction to REIT dividend announcements and the role of monetary policy. Journal of Real Estate Portfolio Management, 15(3): 289-298. View at Google Scholar
Smith, A., 1761. The theory of moral sentiments. London: A. Millar.
Soares, J.V. and A.P. Serra, 2005. Overreaction and underreaction: Evidence for the Portuguese stock market. Caderno de Valores Mobiliarios, 22:55-84.
Spyrou, S., 2006. Unobservable information and behavioral patterns in futures markets: The case for brent crude oil, gold and robusta coffee contracts. Derivatives Use, Trading Regulation, 12(1-2): 48-59. View at Google Scholar | View at Publisher
Spyrou, S., K. Kassimatis and E. Galariotis, 2007. Short-term overreaction, underreaction and efficient reaction: Evidence from the London stock exchange. Applied Financial Economics, 17(3): 221-235. View at Publisher
| Views and opinions expressed in this article are the views and opinions of the author(s), Asian Economic and Financial Review shall not be responsible or answerable for any loss, damage or liability etc. caused in relation to/arising out of the use of the content. |