


FINANCE-GROWTH NEXUS IN BANGLADESH? AN EMPIRICAL ANALYSIS
1Assistant Professor, School of Business and Economics, North South University, Dhaka, Bangladesh
2BS Graduate, School of Business and Economics, North South University, Dhaka, Bangladesh
ABSTRACT
We examine the empirical relationship between financial and economic growth in Bangladesh over the period of 1985-2014. Augmented Dickey Fuller (ADF) test is performed for checking the stationarity properties and it is revealed that all the concerned variables are stationary. Johansen cointegration method indicates that long-run cointegrating relationship prevails in some of the concerned variables. Then applying the Granger causality test, we have revealed casual relationship between economic growth and few indicators of financial development. The weak financial structure composed of non performing banking sector, underdeveloped capital market, bond market and an insurance market could well be the reasons behind it. The findings of our paper recommend policymakers to further develop the financial structure of the country which would ensure future economic growth.
© 2017 AESS Publications. All Rights Reserved.
Keywords: Financial development, Economic growth, Cointegration approach, Granger causality, Augmented dickey fuller (ADF) Test, Bangladesh Financial Sector.
JEL Classification: C32, G00.
Received: 26 July 2016/ Revised: 26 October 2016/ Accepted: 3 November 2016/ Published: 9 November 2016
Contribution/ Originality
This contribution of this study is to investigate the relationship between financial development and economic growth nexus in Bangladesh by considering a new set of financial indicators. This study reveals the reasons behind a weak financial system in Bangladesh which has of great relevance for policy matters.
1. INTRODUCTION
The debate between financial and economic growth has been going on for a fairly long period of time. Although the perception of the researchers varies regarding this issue, the finance growth nexus are reviewed empirically on a frequent basis. Hence, the link between financial and economic growth is very important and will emphasize the significance of financial sector reform among the policy makers.
Economic theories argue that capital can positively affect economic activities [Among others, Harrod (1939); Domar (1946); Smith (1776) and Ricardo (1817)]. The existing theory also highlights that financial systems can cause growth by facilitating accessible information about firms, risk management, corporate governance and financial exchange. However, empirical evidences fail to support this hypothesis. A large number of empirical literatures reveal ambiguous results between the variables (Favara, 2003). In regard to the weak or no correlation between finance and growth, Lucas (1988) dismisses finance as an “over-stressed” determinant of economic growth. Robinson (1952) also discussed that when economy grew, that would eventually demand financial sector to develop. However, most of the empirical studies concluded that the financial development coupled with an improved banking system could foster the rate of economic activities (Wachtel, 2001). As a result, in spite of numerous studies, the issue of causality between finance and economy always remains an important subject to debate because of the ambiguity found in the earlier literature.
The financial sector of any economy can improve the size and efficiency of real investment and thus accelerate economic performance. It is expected that by lowering the cost and risk of production, an efficient financial sector could play a major role to raise the living standards. However, to the best of our knowledge, a very few studies have addressed the issue for Bangladesh perspective. Moreover, the earlier literature did not include all the main financial indicators. Hence, the objective of this paper is to look into the causal relation between financial and economic growth in Bangladesh economy over the period of 1985-2014. The findings of this paper reveal a very weak causal relation between the roles of financial sector on economic activities in Bangladesh. The financial structure of Bangladesh is still weak and small and hence their role towards economy is very limited.
In reality, the financial sector of Bangladesh is relatively underdeveloped. It comprises of the money and capital markets, insurance and pensions, and microfinance. Both the capital and the equity market remains at early phases of market expansion. Although banking sector performs relatively better but there is a tight affiliation with unhealthy banks which creates a severe risk to the stability of the overall financial system. Overall, financial sector has not performed well in international comparison and has suffered from serious regulatory weaknesses. Hence, for all these reasons, investors have usually low confidence on financial market.
This paper is ordered as follows: Chapter 2 presents a literature review consisting of empirical findings and theoretical background. Chapter 3 provides an overview of the financial sector in Bangladesh. Then chapter 4 portrays the econometric methodology followed by the results in chapter 5. The chapter 6 explains the result found. Finally, chapter 7 focuses on conclusion.
2. LITERATURE REVIEW
Existing theoretical and empirical literatures reveal a strong and positive linkage between financial and economic growth. Capital formation plays a central role in accelerating economic activities. The method of capital formation helps in raising Gross Domestic Product (GDP) which enhances the rate and level of national output. According to Harrod-Domar growth model, new investments representing net addition to the capital stock are mandatory for economic growth. The model focused on the direct association between the size of the total capital stock and GDP. Smith (1776) foremost classical economist, considered capital accumulation as a basic condition for economic development.
Lucas (1988) introduced human capital in the production function to generate endogenous growth. According to the neo-classical economists, a rise in the labour supply together with an improvement in the productivity of labour and capital can foster the economic performances.
Foreign capital or FDI have several impacts on a host country's domestic investment. The relationship between FDI-growth nexus can be decomposed into three impacts, namely, i) the direct impact, ii) the indirect impact, and iii) the reverse impact. Direct impact occurs when non-financial and financial capital formation is required for economic growth and to produce more, additional investment would be required to enlarge a scale of production. The indirect impact is shown by mostly four channels of FDI spillovers which are competition, linkages, skill and imitation. These spillovers result to domestic investment and finally economic growth is achieved. Finally, the reverse impact is said to occur if instead economic growth leads to FDI (Fig 1).
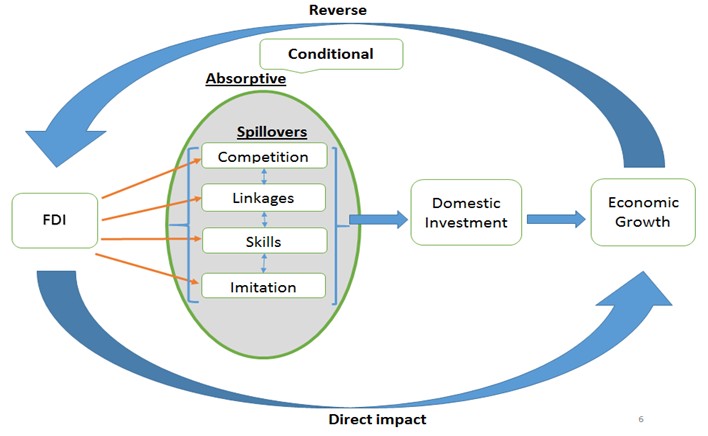
Figure-1. Channels from FDI to Economic Growth
Source: Compiled from Bhissum Nowbutsing (2010)
We summarize few of the studies based on economic and financial growth discussed in the Table 1.
3. FINANCIAL SECTOR OF BANGLADESH
The financial sector is normally tiny and undersized. The banking sector is comparatively developed than the equity market segment. But if we compare the financial sector to the international market, it needs a huge improvement. The major problem that exists is the lack of discipline. There exists an excessive level of intervention by the government, political connections, economic corruption, and managerial inefficiency in the sector. All these together result in vicious circle that restraints socio-economic progress in Bangladesh.
Broadly speaking, the financial sector in Bangladesh includes three broad fragmented sectors: Firstly, the formal sector which includes all regulated institutions like banks, non-bank financial institutions, insurance companies, capital market intermediaries and micro finance institutions, etc. Secondly, semi-formal sector includes the institutions which are controlled otherwise but do not fall underneath the jurisdiction of Central Bank, Insurance Authority, and Securities and Exchange Commission etc. This sector is mostly characterized by Specialized Financial Institutions like House Building Finance Corporation (HBFC), Palli Karma Sahayak Foundation (PKSF), SamabayBank, Grameen Bank etc., Non-Governmental Organizations (NGOs and discrete government programs). Finally, the informal sector includes fully unregulated private intermediaries.
Table-1.Summary findings of existing literature
| Study | Period | Countries | Financial Indicators | Results |
| Shahbaz et al. (2015) | 1976-2012 | Bangladesh | Real domestic credit to private sector | Financial development provides a vital means for economic growth. |
| Caporale et al. (2014) | 1994-2007 | 10 European Union members | Number of total banks, number of foreign- owned banks, asset share of state- owned banks percentage, asset share of foreign- owned banks percentage, the liquid liabilities as a share of GDP, private sector to GDP, credit to household as percentage of GDP, stock market capitalization | Financial depth is found to be lacking in all 10 countries, with only a minor positive effect of some indicators of financial development. |
| Estrada et al. (2010) | 1987-2008 | 125 countries | Total liquid liabilities relative to GDP, private credit by deposit money banks relative to GDP and stock market capitalization relative to GDP | Strong support of a positive impact of financial development on economic growth. |
| Abu-Bader and Abu-Qarn (2008) | 1960–2001 | Egypt | Ratio of money stock to nominal GDP, the ratio of M2 minus currency to GDP, the ratio of bank credit to the private sector to nominal GDP and the ratio of credit issued to non-financial private firms to total domestic credit | Financial development causes economic growth through bothincreasing resources for investment and enhancing efficiency |
| Khaled et al. (2006) | 1989-2001 | Arab countries | Liquid liabilities, bank credit, ratio of credit allocated to private enterprises to total domestic credit. Credit to private enterprises divided by GDP. ratio of M1, M2, credit to the public sector to domestic credit, credit to the public sector to GDP and the monetary authority (central bank) credit to the financial sector as a percentage of domestic credit. | Financial indicators are insignificant and do not affect economic growth. |
| Islam et al. (2004) | 1975-2002 | Bangladesh | Ratio of broad money to GDP, ratio of liquid liabilities to GDP, the ratio of financial savings to GDP (or, FSY), private credit to GDP and domestic credit to GDP | Reverse causality between finance and growth |
| Akinboade (1998) | 1972-1995 | Botswana | Money supply (M2); total outstanding advances of domestic institutions (including Government) and, commercial banks' advances to private business, all expressed as a percentage of non-mineral GDP | Per capita income in Botswana and the financial development indicators cause one another. |
Source: Compiled by authors from different literature
Following independence, Bangladesh nationalized the commercial banks (Nguyen et al., 2011). This was thought to be an important step for expanding banking services in the remote areas. But the performance of commercial banks suggests otherwise. It showed a larger variation in profitability and productivity, and no possible stability. The small local private banks are barely wealthier and create no competition to nationalized bank. Furthermore, the state banks face many problems including inadequate loan monitoring and follow-up, poor governance and inadequate management of internal risks.
In the recent past, the banking sector has been deteriorating in terms of growth of credit and risk management. The reduction in the growth in credit shows the poor situation of investment which might be responsible for the lower growth in GDP. Moreover, there is a tight affiliation with unhealthy banks which causes a serious threat to the stability of the overall financial system. The banking subsector relies mostly on short-term deposits as a source of finance and it becomes a very difficult for them to provide long-term financing, which may prevent economic growth to a large extent.
High deposit and lending rates prevail in the economy which reflects the system's embedded inefficiencies. The widespread default practice results in extensive and costly financial intermediation. In addition to loan defaults, other market distortions, including the high interest rates on government savings bonds and government borrowings and poor pricing strategies of banks, also contributes to the wide interest spreads.
Capital markets are small and do not offer a competitive alternative to bank borrowing. Stock market capitalization retailed relatively smaller than in neighboring South Asian country. The limited number of scheduled securities of Bangladesh has always been a limitation on developing the liquidity and market capitalization of the stock market. Furthermore, the main barriers to improvement of capital market include an inefficient pricing mechanism, issuer’s concerns over poor corporate governance, and high listing costs. Market instability creates problem in the capital market which indicates weak governance structure weak capacity of Security Exchange Commission to monitor market developments.
The bond market of Bangladesh is endorsed by a limited supply of debt instruments, especially long-term instruments. Moreover, secondary market in the government securities is illiquid, which hampers the proper pricing of treasury bonds in the primary market. It is slowed down by the comparatively high interest rate bearing risk-free national savings scheme. In addition, the costly process of issuing bond hinders the development of effective bond market.
Similar to bond and capital sector, the insurance sector is also, in many respects, underdeveloped relative to other comparator countries. Insurance system of Bangladesh encompasses a very weak regulatory system, inadequate capital base, high management expenses, and large number of weak insurers competing with each other. The existence of too many companies in Bangladesh encourages the unethical practices of some insurance companies, which retarded the industrial growth. The insurance sector should be developed as a medium term strategy in order also to help develop the future bond market.
The financial sector in Bangladesh has a limited role in the resource allocation. For instance, the domestic investment and savings rate in Bangladesh have been very low compared to the other developing countries. The low saving rate is associated with a high consumption pattern, a low level of financial intermediation, and low disposable income. Therefore, it is quite apparent that a resource gap exists in Bangladesh.
Debt and equity markets have yet to fully recover from the domestic capital market crisis of 1996 and the departure of foreign investors. However, because of corruption, the capital base of the commercialized banks was in trouble. To address the issue of corruption, the National Commission on Money, Banking and Credit was formed by the government (Rahman, 2004).
4. METHODOLOGY AND DATA SET
Financial and macro variables are well known for their non stationarity. So, we performed Augmented Dickey Fuller (ADF) test to test the existence of unit root and found some of the variables are non stationary and thus cannot be regressed without making them stationary. Then we ran cointegration test to find out likely linear combination of the variables that can be considered stationary. If cointegration found then we ran Granger Casualty test to check the possible direction of causality.
The Johansen procedure is applied to test for cointegration. For this approach, an Unrestricted Vector of Autocorrelation of the following form needs to be estimated:

Where is the difference operator; xt is a n1 vector of non-stationary variables (in levels); and ut is the vector of random errors. The matrix k includes the details on long run relationship between variables, that is if the rank of k =0, the variables are not cointegrated. Conversely, if rank (r) is equal to 1, there exists one cointegrating vector and if 1 <r <n, there are several cointegrating vectors. Following Johansen and Juselius (1990) two tests for cointegration, namely the trace test and the maximum Eigen value test are done in this paper.
Granger causality test checks whether past values of add to the explanation of current values of as provided by information in past values of itself [Granger (1969; 1980; 1988) and Engle and Granger (1987)]. In this paper, the causality test between RGDP and Financial Development indicators will be conducted. For these following two sets of equation will be estimated.
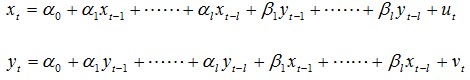
We consider the above sets of equations for all possible pairs of (x, y) series in the group. The measure of Real GDP (RGDP) can be measured as an indicator of economic development. For financial development we have used different financial development indicators which are domestic credit to private sector (DC), foreign direct investment (FDI), gross capital formation (GK), broad money (M2), total income of commercial bank (TI) and lending interest rate (LI). Additionally, the variable labour force (LF) has also been considered in our model to explain economic growth.
The justification of the model variables is given below. Income of commercial bank, as an measure of financial development, helps to check its association with economic growth. Domestic credit provided by financial sector includes all the credit to various sectors on a gross basis, without which investment will be prevented. Similar to domestic credit, change in lending interest rate has an impact on investment which is a necessity factor leading to growth of an economy. Since, FDI inflows play a crucial role in promoting growth; it has been used to assess whether it has any impact on economic growth. According to standard macroeconomic theory, an increase in the supply of money (measured by broad money) should lower the interest rates in the economy, leading to more consumption and lending or borrowing.
The data for the variables have been collected from World Development Indicators WDI (2015). Our data set spans over the period of 1985-2014 for which 30 observations are available at most. Expansion of data set is not possible due to unavailability of data. Also since the relationship is dynamic one, so inclusion of very old data can produce us wrong outcomes. Small sample size might be problematic in finding the long run relationship. Eviews 8.0 is used for all the tests run in this study.
5. RESULTS OBTAINED
Unit root tests are done to confirm the order of integration of the data series for the variables. Table 2 emphasizes the ADF statistics of the variables in their level and first differenced forms.
Table-2.Augmented Dickey Fuller Unit Root Test for the Variables
| Panel 1: Levels | |||
| ADF Statistics (Only Constant) | ADF Statistics (Constant & Trend) | Decision | |
| RGDP | 2.026315 | 4.089303 | Stationary |
| TI | 1.997282 | -2.018004 | Not Stationary |
| M2 | 0.644218 | -2.2206262 | Not Stationary |
| LI | -2.982783 | -3.448150 | Stationary |
| LF | 2.893390 | -2.081781 | Not Stationary |
| GK | -0.186284 | -1.483171 | Not Stationary |
| FDI | -0.720940 | -3.491454 | Not Stationary |
| DC | 0.140083 | -2.355369 | Not Stationary |
| Panel 2: First Differences | |||
| ADF Statistics (Only Constant) | ADF Statistics (Constant & Trend) | Decision | |
| RGDP | Not Applicable | Not Applicable | - |
| TI | -4.956212 | -4.845041 | Stationary |
| M2 | -3.841615 | -3.884882 | Stationary |
| LI | -3.934467 | -3.801305 | - |
| LF | -2.395922 | -4.195199 | Stationary |
| GK | -3.574704 | -4.141542 | Stationary |
| FDI | -7.256790 | -4.356413 | Stationary |
| DC | -4.630488 | -4.582694 | Stationary |
Source: Eviews 8.0 software generated result
From Table 2, it is clear that some of the variables are non stationary in their level. However, all the relevant variables are stationary in the first differenced form. Table 3 and Table 4 (See Appendix) show the result of Johansen Cointegration test.
Table-5.Granger Causality Tests (Lag 2)
| Hypothesis | F-Value | P-Value | Granger Causality |
| RGDP does not Granger Cause TI | 0.422210 | 0.6630 | No Causality between RGDP andTI |
| TI does not Granger Cause RGDP | 0.38796 | 0.6830 | |
| RGDP does not Granger Cause M2 | 1.90334 | 0.1718 | Unidirectional CausalityM2→ RGDP |
| M2 does not Granger Cause RGDP | 2.86153 | 0.0777 | |
| RGDP does not Granger Cause LI | 1.89897 | 0.1725 | No Causality between RGDP and LI |
| LI does not Granger Cause Energy RGDP | 1.65094 | 0.2138 | |
| RGDP does not Granger Cause LF | 1.42392 | 0.2612 | Unidirectional CausalityLF→RGDP |
| LF does not Granger Cause RGDP | 2.72404 | 0.0867 | |
| RGDP does not Granger Cause GK | 0.22021 | 0.8040 | No Causality between RGDP and GK |
| GK does not Granger Cause RGDP | 1.15399 | 0.3330 | |
| RGDP does not Granger Cause FDI | 7.14925 | 0.8860 | Unidirectional Causality FDI→ RGDP |
| FDI does not Granger Cause RGDP | 0.12170 | 0.0038 | |
| RGDP does not Granger Cause DC | 0.46939 | 0.6312 | Unidirectional Causality DC→RGDP |
| DC does not Granger Cause RGDP | 4.35073 | .0250 |
Source: Eviews 8.0 software generated result
The Granger causality test has been conducted to describe the causal relationships between the variables. For robustness checking, 4 different lag intervals have been considered (Lag 1, lag 2, lag 3 and lag 4) and the result shows that there are unidirectional causal relationships running from domestic credit provided by private sector (DC) to RGDP and also from RGDP to foreign direct investment (FDI). However, there is no causal relationship total income (TI) and RGDP; broad money (M2) and RGDP; lending interest rate (LI) and RGDP; labor force (LF) and RGDP; and gross capital formation (GK) and RGDP. However, exceptionally, in lag 1 there is an unidirectional causal relationships running from RGDP to LF and also from M2 to RGDP. The results for causal test for lag 2 are reported in the Table 5.
6. DISCUSSION ON RESULTS OBTAINED
Since most of the model variables are non stationary, they would yield spurious results unless cointegrated. Tests of cointegration confirm the cointegrating relationship at least for three variables. The Granger causality test shows there are unidirectional causal relationships running from domestic credit to private sector; foreign direct investment to economic growth; foreign direct investment to economic growth and labor force to economic growth. However, there is no causal relationship between economic growth and the other variables concerned in this paper. So, in this current paper, we have found that although at least three variables have long run association and tend to move together over time, but taking the causality factor into consideration, there is a weak relationship between financial and economic growth. The underdeveloped, weak and inefficient financial structure of Bangladesh could be the major reason underlying the abovementioned result. Capital market, bond market and insurance market, all these are very underdeveloped compared to international perspective. Banking sector, which is supposed to be the key dominating financial sector of the country, has not performed well and have become vulnerable in regard to political connections and economic corruption. Fraudulent activities and market manipulations, when remain unpunished due to political and other reasons makes the issue much more complicated. Debt and equity markets have yet to fully recover from the domestic capital market crisis of 1996 and the exit of foreign investors. Despite allegations of irregularities among stock market brokers, not a single case has been successfully prosecuted. Moreover, government involvement in financial systems of Bangladesh during long periods made their contributions in the growth process very less. Furthermore, the previous experience has shown that the lack of autonomy of the Central Bank is particularly constraining in regards to the conduct of sound monetary policy and the granting of licensing for new banks. Similarly, undue government pressure has forced Bangladesh Bank to issue several new licenses to new private banks unnecessarily.
7. CONCLUSION
The financial sector has a key responsibility in achieving higher productivity by improving allocation of investment funds and strengthening the incentive framework and driving technological innovation. This will eventually generate employment and trigger economic activities in future. Economic theory also stresses the importance of efficient financial system for future economic benefit. Therefore, financial development has got significant consideration since the pioneer contribution of Goldsmith (1969);McKinnon (1973) and Shaw (1973).
The existing literature on financial development-economic growth nexus which concentrated in Bangladesh did not consider all the relevant variables used in other research globally. This present paper highlights the research gap and also expands the time span. Our results imply that there is unidirectional causal relationships running from domestic credit to private sector; foreign direct investment to economic growth; foreign direct investment to economic growth and labor force to economic growth, whereas the other variables have no causal relationship with economic growth. Hence, we have very little evidence to support that finance is an important sector in economic development. Our finding supports the results of Arestis and Demetriades (1997) and Demetriades and Hussein (1996). Their study reveals that the relationship between finance and economic growth may be country and time specific. Besides, different measures of underground economy of Bangladesh has highlighted that the size of the informal economy is around one-third of the total GDP and large enough to upset any macroeconomic outcomes (Schneider, 2004). Apart from that, the financial sector of Bangladesh is rather very small and underdeveloped, and there is also lack of market competition in the banking sector. Moreover, there is extreme government interference in the determination and allocation of financial resources to capital accumulation.
Hence, it is important for financial regulation to be strengthened for financial sector to have an impact on economic growth. There should be very close supervision to ensure proper implement in cases where governance is weak. Monetary policy should be supported by an efficient financial system for future macroeconomic stability. This would also bring in the much needed confidence for the investors. Moreover, capital market needs to be developed which in turn, could affect the economy positively. Present situation of the stock markets should be well equipped to improve market liquidity and competitiveness. So, this paper argues that a sound financial sector is essential for Bangladesh economy and unless the financial system is developed, and the abovementioned steps are undertaken, it cannot foster economic growth and vice versa.
One of the limitations of this paper is that it does not consider market capitalization into account. Future research could involve in revealing the causal relationship between financial-economic growth nexus in South Asian countries to formulate appropriate policies and procedures.
| Funding: This study received no specific financial support. |
| Competing Interests: The authors declare that they have no competing interests. |
| Contributors/Acknowledgement: All authors contributed equally to the conception and design of the study. |
REFERENCES
Abu-Bader, S. and A.S. Abu-Qarn, 2008. Financial development and economic growth: The Egyptian experience. Journal of Policy Modeling, 30(5): 887-898.
Akinboade, O.A., 1998. Financial development and economic growth in Botswana: A Test for causality. Savings and Development, 22(3): 331-348.
Arestis, P. and P. Demetriades, 1997. Financial development and economic growth: Assessing the evidence. Economic Journal, 170(442 ): 783-799.
Caporale, G.M., C. Rault, A.D. Sova and R. Sova, 2014. Financial development and economic growth: Evidence from 10 European union members. International Journal of Finance & Economics, 20(1): 48-50.
Demetriades, P.O. and K. Hussein, A., 1996. Does financial development cause economic growth? Time series evidence from 16 countries. Journal of Development Economics, 51(2): 387-411.
Domar, E.D., 1946. Capital expansion, rate of growth and employment. Econometrica, 14(2): 137-141.
Engle, R.F. and C.W.Z. Granger, 1987. Co-integration and error correction: Representation, estimation, and testing. Econometrica, 55(2): 251-276.
Estrada, G., D. Park and A. Ramayandi, 2010. Financial development and economic growth in developing Asia. Working Paper Series 233, Asian Development Bank Economics.
Favara, G., 2003. An empirical reassessment of the relationship between finance and growth. Working Paper 03/123, International Monetary Fund (IMF).
Goldsmith, R., 1969. Financial structure and development. Journal of Political Economy, 9B(5): 1076-1107.
Granger, C.W.J., 1969. Investigating causal relations by econometric models and cross- spectral methods. Econometrica, 37(3): 424-438.
Granger, C.W.J., 1980. Testing for causality: A personal viewpoint. Journal of Economic Dynamics and Control, 2(1): 329-352.
Granger, C.W.J., 1988. Some recent developments in a concept of causality. Journal of Econometrics, 39(1-2): 199-211.
Harrod, R.F., 1939. An essay in dynamic theory. Economic Journal, 49(193): 14-33.
Islam, M.R., M.H. Habib and M.H. Khan, 2004. A time series analysis of finance and growth. Bangladesh Development Studies, 30(1): 111-129.
Johansen, S. and K. Juselius, 1990. Maximum likelihood estimation and inference on cointegration with application to the demand for money. Oxford Bulletin of Economics and Statistics, 52(2): 169-209.
Khaled, A.Z., A.R. Samer and A.M. E, 2006. Financial development and economic growth: A new empirical evidence from the MENA countries, 1989-2001. Applied Econometrics and International Development, 6(3): 137-150.
Lucas, R., 1988. On the mechanics of economic development. Journal of Monetary Economics, 22(3): 3-42.
McKinnon, R.I., 1973. Money and capital in economic development. Washing ton, DC: Brookings Institution.
Nguyen, C.V., A.M. Islam and M.M. Ali, 2011. The current state of the financial sector of Bangladesh: An analysis. No. 2011-03, AIUB Bus Econ Working Paper Series.
Nowbutsing, B., 2010. FDI, domestic investment and economic growth: A theoretical framwork, University of Technology Mauritius.
Rahman, M.H., 2004. Financial development - economic growth Nexus: A case study of Bangladesh. Bangladesh Development Studies, 30(3): 113-128.
Ricardo, D., 1817. On the principles of political economy and taxation. London: John Murray.
Robinson, J., 1952. The generalization of the general theory, in the rate of interest and other essays. London: Macmillan. pp: 67-142.
Schneider, F., 2004. The size of the shadow economies of 145 countries all over the world: First results over the period 1999 to 2003, IZA Discussion Papers, Institute for the Study of Labour (IZA).
Shahbaz, M., I.U. Rehman and A.T. Muzaffar, 2015. Re-visiting financial development and economic growth Nexus: The role of capitalization in Bangladesh. South African Journal of Economics, 83(3): 452-471.
Shaw, E.S., 1973. Financial deepening in economic development. New York: Oxford University Press.
Smith, A., 1776. An inquiry into the nature and causes of the wealth of nations. London: W. Strahan.
Wachtel, P., 2001. Growth and finance: What do we know and how do we know it? International Finance, 4(3): 335-362.
World Development Indicators WDI, 2015. Washington, DC: World Bank.
Appendix
Table-3.Johansen Test for Cointegration (Maximum Eigen Value Test) Lag Intervals 1
| Null | Alternative | Statistics | 95% Critical Value | Conclusion |
| r=0 | r=1 | 120.9583 | 52.36261 | 3 cointegrating relationship at the 0.05 level |
| r<=1 | r=2 | 66.38054 | 46.23142 | |
| r<=2 | r=3 | 56.24065 | 40.07757 | |
| r<=3 | r=4 | 33.15941 | 33.87687 | |
| r<=4 | r=5 | 26.36097 | 27.58434 | |
| r<=5 | r=6 | 15.05584 | 21.13162 | |
| r<=6 | r=7 | 8.070635 | 14.26460 | |
| r<=7 | r=8 | 0.002845 | 3.841466 | |
| Trend assumption: No deterministic trend | ||||
| Null | Alternative | Statistics | 95% Critical Value | Conclusion |
| r=0 | r=1 | 117.4674 | 48.87720 | 4 cointegrating relationship at the 0.05 level |
| r<=1 | r=2 | 59.27384 | 42.77219 | |
| r<=2 | r=3 | 49.56514 | 36.63019 | |
| r<=3 | r=4 | 36.63019 | 30.43961 | |
| r<=4 | r=5 | 24.15921 | 24.15921 | |
| r<=5 | r=6 | 17.79730 | 17.79730 | |
| r<=6 | r=7 | 11.22480 | 11.22480 | |
| r<=7 | r=8 | 4.129906 | 4.129906 | |
| Trend assumptions: No deterministic trend (restricted constant) | ||||
| Null | Alternative | Statistics | 95% Critical Value | Conclusion |
| r=0 | r=1 | 122.2489 | 53.18784 | 4 cointegrating relationship at the 0.05 level |
| r<=1 | r=2 | 67.13713 | 47.07897 | |
| r<=2 | r=3 | 56.73940 | 40.95680 | |
| r<=3 | r=4 | 36.79159 | 34.80587 | |
| r<=4 | r=5 | 26.80740 | 28.58808 | |
| r<=5 | r=6 | 15.69683 | 22.29962 | |
| r<=6 | r=7 | 12.54482 | 15.59210 | |
| r<=7 | r=8 | 7.522368 | 9.16546 | |
| Trend assumption: Linear deterministic trend (restricted) | ||||
| Null | Alternative | Statistics | 95% Critical Value | Conclusion |
| r=0 | r=1 | 125.1440 | 56.70519 | 3 cointegrating relationship at the 0.05 level |
| r<=1 | r=2 | 76.80626 | 50.59985 | |
| r<=2 | r=3 | 57.11521 | 44.49720 | |
| r<=3 | r=4 | 33.85098 | 38.33101 | |
| r<=4 | r=5 | 32.17277 | 32.11832 | |
| r<=5 | r=6 | 26.26775 | 25.82321 | |
| r<=6 | r=7 | 14.64802 | 19.38704 | |
| r<=7 | r=8 | 7.954190 | 12.51798 | |
| Trend assumption: Quadratic deterministic trend | ||||
| Null | Alternative | Statistics | 95% Critical Value | Conclusion |
| r=0 | r=1 | 125.1440 | 55.72819 | 3 cointegrating relationship at the 0.05 level |
| r<=1 | r=2 | 75.11805 | 49.58633 | |
| r<=2 | r=3 | 55.67300 | 43.41977 | |
| r<=3 | r=4 | 32.35845 | 37.16359 | |
| r<=4 | r=5 | 32.15974 | 30.81507 | |
| r<=5 | r=6 | 19.20841 | 24.25202 | |
| r<=6 | r=7 | 12.31559 | 17.14769 | |
| r<=7 | r=8 | 1.951348 | 3.841466 |
Source: Eviews 8.0 software generated result
Table-4.Johansen Test for Cointegration (Trace Test)
Lag Intervals 1
| Trend assumption: Linear deterministic trend | ||||
| Null | Alternative | Statistics | 95% Critical Value | Conclusion |
| r=0 | r=1 | 326.2292 | 159.5297 | 5 cointegrating relationship at the 0.05 level |
| r<=1 | r=2 | 205.2709 | 125.6154 | |
| r<=2 | r=3 | 138.8903 | 95.75366 | |
| r<=3 | r=4 | 82.64969 | 69.81889 | |
| r<=4 | r=5 | 49.29029 | 47.85613 | |
| r<=5 | r=6 | 23.12932 | 29.79707 | |
| r<=6 | r=7 | 8.073480 | 15.49471 | |
| r<=7 | r=8 | 0.002845 | 3.841466 | |
| Trend assumption: No deterministic trend | ||||
| Null | Alternative | Statistics | 95% Critical Value | Conclusion |
| r=0 | r=1 | 304.4219 | 143.6691 | 8 cointegrating relationship at the 0.05 level |
| r<=1 | r=2 | 186.9545 | 111.7805 | |
| r<=2 | r=3 | 127.6807 | 83.93712 | |
| r<=3 | r=4 | 78.11555 | 60.06141 | |
| r<=4 | r=5 | 46.72400 | 40.17493 | |
| r<=5 | r=6 | 29.04958 | 24.27596 | |
| r<=6 | r=7 | 13.49733 | 12.32090 | |
| r<=7 | r=8 | 4.417916 | 4.129906 | |
| Trend assumptions: No deterministic trend (restricted constant) | ||||
| Null | Alternative | Statistics | 95% Critical Value | Conclusion |
| r=0 | r=1 | 345.4885 | 169.5991 | 6 cointegrating relationship at the 0.05 level |
| r<=1 | r=2 | 223.2395 | 134.6780 | |
| r<=2 | r=3 | 156.1024 | 103.8473 | |
| r<=3 | r=4 | 99.36302 | 76.97277 | |
| r<=4 | r=5 | 62.57143 | 54.07904 | |
| r<=5 | r=6 | 35.76402 | 35.19275 | |
| r<=6 | r=7 | 20.06719 | 20.26184 | |
| r<=7 | r=8 | 7.522368 | 9.16546 | |
| Trend assumption: Linear deterministic trend (restricted) | ||||
| Null | Alternative | Statistics | 95% Critical Value | Conclusion |
| r=0 | r=1 | 373.9592 | 187.4701 | 6 cointegrating relationship at the 0.05 level |
| r<=1 | r=2 | 248.8152 | 150.5585 | |
| r<=2 | r=3 | 172.0089 | 117.7082 | |
| r<=3 | r=4 | 114.8937 | 88.80380 | |
| r<=4 | r=5 | 81.04273 | 63.87610 | |
| r<=5 | r=6 | 48.86996 | 42.91525 | |
| r<=6 | r=7 | 22.60221 | 25.87211 | |
| r<=7 | r=8 | 7.954190 | 12.51798 | |
| Trend assumption: Quadratic deterministic trend | ||||
| Null | Alternative | Statistics | 95% Critical Value | Conclusion |
| r=0 | r=1 | 353.9286 | 175.1715 | 5 cointegrating relationship at the 0.05 level |
| r<=1 | r=2 | 228.7846 | 139.2753 | |
| r<=2 | r=3 | 153.6665 | 107.3466 | |
| r<=3 | r=4 | 97.99355 | 79.34145 | |
| r<=4 | r=5 | 65.63510 | 55.24578 | |
| r<=5 | r=6 | 33.47536 | 35.01090 | |
| r<=6 | r=7 | 14.26694 | 18.39771 | |
| r<=7 | r=8 | 1.951348 | 3.841466 |
Source: Eviews 8.0 software generated result
| Views and opinions expressed in this article are the views and opinions of the author(s), Asian Economic and Financial Review shall not be responsible or answerable for any loss, damage or liability etc. caused in relation to/arising out of the use of the content. |