


EXPLORE THE IMPACT OF THE TRADING VALUE , THE OIL PRICE AND QUANTITATIVE EASING POLICY ON THE TAIWAN AND KOREA STOCK MARKET RETURN WITH QUANTILE REGRESSION

1Department of International Business, Chung Hua University 707, Sec. 2, WuFu Rd., Hsinchu 300, Taiwan R.O.C. , 2Ph.D. Program of Technology Management, Chung Hua University 707, Sec. 2, WuFu Rd., Hsinchu 300, Taiwan R.O.C.
ABSTRACT
This paper aims to apply the quantile regression analysis to explore the impacts of the stock market trading value, change in international oil prices, and the US implementation of Quantitative easing monetary policy on Taiwan’s and Korea’s stock index returns. This study is in accordance with the 2008 US implementation of quantitative policy to conduct research on 53-month data collected from April 2004 to February 2013 in order to explore the differences between before and after the US implementation of quantitative policy. The results find that under situations of high distribution of stock index returns, Taiwan’s and Korea’s stock markets reveal the same phenomenon of “the stock price increases and the trading volume rises, the stock price declines and the trading volume descends”. Meanwhile, under situations of low distribution of stock index returns, the Korea’s increasing stock trading value will cause stock index returns to fall. Noteworthy, under situations of low distribution of stock index returns, oil price changes are found to have positive effects on Taiwan’s and Korea’s stock index returns. Finally, the US implementation of quantitative easing monetary policy is indicated to have non-significant influence on Taiwan’s and Korea’s stock index returns. Further investigating whether there are inconsistencies before and after the implementation of quantitative policy regarding the impacts between these two nations’ stock trading values and oil price changes on stock index returns, the results show no differences.
© 2017 AESS Publications. All Rights Reserved.
Keywords: Quantile regression, Stock index return, Changes in international oil prices, Quantitative easing policy, Stock market, Manufacturing industry production index .
JEL Classification: E52, G12.
Received: 20 July 2016/ Revised: 22 August 2016/ Accepted: 27 September 2016/ Published: 25 October 2016
Contribution/ Originality
This study is one of very few studies which adopt quantile regression to explore the impacts of stock trading value, international oil price change, and the US quantitative easing monetary policy in Asia's two major industrial country, Taiwan and Korea, on their stock markets return.
1. INTRODUCTION
Stock market has been widely considered the showcase for national future economic development. It not only facilitates capital formation but also national economic growth. The more active stock market trade of a country shows the more prosperous on its economy. Due to this fact, numerous previous studies have explored the factors of affecting stock volatility, including stock trading value (Assogbavi et al., 1995; Saatcioglu and Starks, 1998; Chen et al., 2001; Lee and Rui, 2002; Statman et al., 2006; Xu et al., 2006; Rashid, 2007; Chuang et al., 2009; Chen, 2012) oil price (Jones and Kaul, 1996; Maghyereh and Kandari, 2007; Aloui and Jammazi, 2009; Qinbin et al., 2012; Mollick and Assefa, 2013) manufacturing industry production index (Mohanty et al., 2011) economic prosperity (Fan et al., 2003; Basher and Sadorsky, 2006; Driesprong et al., 2008; Tang et al., 2010) investment inclination (Faff and Brailsford, 1999; Hondroyiannis and Papapetrou, 2001; Henriques and Sadorsky, 2008; Mollick and Assefa, 2013) interest rate (Kagraoka and Moussa, 2013) the total value of import and export prices (Chen et al., 2001) exchange rate (Lyonnet and Werner, 2012) money supply (Eichengreen, 2013; Karras, 2013) price variation (Girardin and Moussa, 2011; Naifar and Dohaiman, 2013) unemployment rate (Nguyen and Bhatti, 2012; Schenkelberg and Watzka, 2013).
However, on exploring influencing factors to stock price index volatility, stock market trading value has been broadly viewed as the main investigated variable since the mutual impact of price and volume is an index which is often taken to predict future stock trend and change. For instance, Ying (1966) through taking New York Stock Exchange (NYSE) examines the rate of return on Standard & Poor 500 index, finding that the change of huge trading volume change goes along with huge price volatility. Wall Street investors also believe that trading value and stock index returns have a positive correlation. In other words, it can be said that trading value can affect stock index returns volatility. Over the past two decades, in the financial sector, the relationship between trading value and stock index returns has gain considerable attention; however, the relationship between price and volume remains controversial.
In the extant literature, many scholars have found a positive relationship between stock market trading value and the stock index returns. Chen et al. (2001) through applying the linear Granger causality test to examine the countries’ and their local stock markets of USA, Japan, the United Kingdom, Canada, Italy, Switzerland, Holland, and Hong Kong find that stock trading value has significantly positive relationship and mutual impact on stock index returns. Statman et al. (2006) use Vector Auto regression (VAR) to analyze monthly data of New York Stock Exchange (NYSE) and Australian Monsoon Experiment (AMEX) from 1962 to 2001 and suggest that stock trading value has positive impact on stock index returns. Chuang et al. (2009) through adopting quantile regression to investigate the causal relationship between stock trading value and return rate of New York Stock Exchange (NYSE), Standard & Poor 500 (S&P 500), and Financial Times-Stock Exchange 100 (FTSE 100) state that when trading value increases, stock index returns will rise.
Nevertheless, several researchers have found that stock trading value does not have a positive impact on stock index returns. Assogbavi et al. (1995) through adopting linear regression model to explore Canada stock market argue that when trading value increases, stock index returns descend. Saatcioglu and Starks (1998) by applying Vector Auto regression model (VAR) for investigating stock market in six countries of Latin America (i.e., Chile, Argentina, Brazil, Colombia, Mexico, and Venezuela) point out that stock trading value exerts a negative impact on stock index returns. Lee and Rui (2002) by conducting Granger Causality Test to explore the daily data of three markets including New York, Tokyo, and London find that the phenomenon that trading value affects stock index returns does not exist. Finally, Xu et al. (2006) through employing Vector Auto regression model (VAR) to examine the relationship between price and volume of Dow Jones 30 constituents of New York Stock Exchange (NYSE) indicate that there is no impact of trading value on stock index returns; instead, stock index returns are only affected by past share index returns and trading value of market itself.
Noteworthy, in this era, oil is closely related to global economy, various industries and commercial activities, transportation, etc. For this reason, oil price uncertainty will cause numerous general economic problems and dramatically affect investment decision-making, business cycle, price level, rate of unemployment, interest rates, and the essence production of substantive outputs, etc. Therefore, oil is frequently called the head of energy resources. Past researches find that in the absence of alternative sources of energy, oil price rise will increase the production cost, which in turn leads to the rise of inflation and interest rate, consequently affects business operational cost and causes stock price to decline (Gisser and Goodwin, 1986; Huang et al., 1996; Yang et al., 2002; Henriques and Sadorsky, 2008). Additionally, Jones and Kaul (1996) through examining developed countries such as USA, the United Kingdom, Canada, and Japan confirm the negative relationships between oil prices and these countries’ stock index returns. Through applying Johansen’s co-integration method to analyze Greece overall economic activities, this finding is further supported by Hondroyiannis and Papapetrou (2001) that rising oil prices strongly reduce stock index returns. In line with this, Maghyereh and Kandari (2007) through adopting rank tests of nonlinear co-integration analysis for testing the relationships between prices and stock index returns on member countries of Gulf Cooperation Council (GCC) propose that oil price changes have a negative impact on stock index returns. Moreover, Driesprong et al. (2008) by employing multiple regressions for exploring the relationships between oil prices and international stock markets indicate that price rise will significantly cause future stock index returns to decline. Finally, in order to explain the relationships among stock index, international oil prices, and economic activities in three countries of the United Kingdom, France and Japan, Aloui and Jammazi (2009) through applying two regime Markov-switching EGARCH (Generalized Auto Regressive Conditional Heteroskedasticity) model has found that oil prices in these three countries have significant negative impacts on stock index returns.
Noteworthy, a debate exists in the extant literature regarding the impact of oil price changes on stock index returns. Specifically, there has been a wide range of previous studies confirming there is not really a negative impact of oil price changes on stock index returns; instead, it depends on different industries. For instance, Faff and Brailsford (1999) through utilizing augmented market model for investigating the relationship between oil prices and Australia industrial stocks returns point out the positive impacts of oil prices on stock index returns of oil, gas, and energy-related industries while displaying the negative effects of oil prices on related industries’ stock index returns regarding papermaking, packing, and transportation. In addition, Nguyen and Bhatti (2012) through applying conditional extreme value theory (C-EVT) for examining the relationships between oil prices and China’s and Vietnam’s stock markets argue that oil prices significantly positively affect Vietnam’s stock index returns (i.e., oil price rise will stimulate stock index returns) while causing China’s stock index returns to decline significantly. Moreover, Mohanty et al. (2011) through utilizing linear factor analysis for exploring the relationships between crude oil price change and stock index returns in each member country of Gulf Cooperation Council (GCC) (i.e., Bahrain, Kuwait, Oman, Qatar, The United Arab Emirates (UAE), and Saudi Arabia) find out that oil prices positively affect stock index returns at the country level; nevertheless, at the industry level, the impacts are different due to various industries and geographic regions. Specifically, 12 out of 20 examined industries (e.g., commercial bank, insurance, and industry) receive positive impacts of oil price on stock index returns whereas other industries such as food and investment obtain negative impacts. Finally, Mollick and Assefa (2013) through applying GARCH and MGARCH-DCC model for testing the relationships between oil price changes and stock index returns after the 2008-2009 financial crisis propose that stock index returns are only slightly negatively affected by international oil price changes.
It is generally assumed that the amount of stock trading value represents market trading level. It is also a critical observed index of judging stock market trend and transition as well as can be said to be the key factor driving stock index fluctuation. Simultaneously, oil is considered the main energy of current industries. Any changes in oil prices will be strongly reflected through industrial production costs and profit. Another concern is that both of Taiwan and Korea are countries that heavily depend on energy imports and lack of domestic mineral oil resources, share similar economic development processes, and face with similar challenges by the industry. Taking these premises, this study aims to take Taiwan and Korea to be the cases for discussing the impacts of stock trading value and oil price changes on stock index returns.
On exploring stock market-related issues, the quantitative easing monetary policy, referred to as QE, is another main concern due to its considerable impact on stock market. In short, quantitative easing is a kind of monetary policy in which Central Bank ladles out capital into the banking system to balance capital easing and maintain the minimum interest level. In 2001, Japan’s Central bank ladles an excessive amount of capital out into its banking system in order through controlling money quantity for indirectly controlling interest rates to not only prevent economic recession and deflation but also have constructive impact on depressed Japan banking and domestic economy (Kobayashi et al., 2006; Girardin and Moussa, 2011; Kagraoka and Moussa, 2013; Schenkelberg and Watzka, 2013). Since the 2008 financial crisis, Federal Reserve System (Fed) has also started to implement the quantitative easing monetary policy. In the circumstances of extra-low interests, this monetary policy has been observed to widely depreciate US dollars, capitals flow, and commodity markets as well as trigger global inflation crisis and simultaneously bring tremendous revaluation pressure on global currency (Blinder, 2010; Hamilton and Wu, 2011; Karras, 2013; Putnam, 2013). Subsequently, numerous global countries would follow up the release of funds to ease capital into market, promote global economic recovery, and cause stock market rise (Wang and Mayes, 2012). Therefore, apart from investigating the impact of stock trading value and oil price changes on stock index returns, this study further takes the factors of the US quantitative easing monetary policy into consideration to explore its impact on stock index returns.
Generally, previous researches regarding the relationships between stock returns and trading value often adopt the Granger causality test (Chen et al., 2001) Vector Auto Regressions (VAR) (Saatcioglu and Starks, 1998; Statman et al., 2006; Xu et al., 2006) and GARCH model (Lee and Rui, 2002) for conducting analyses. A review of the extant literature also shows that studies on the relationships between stock returns and oil price changes frequently utilize Johansen’s co-integration method (Hondroyiannis and Papapetrou, 2001; Maghyereh and Kandari, 2007) Vector Auto Regressions (VAR) (Henriques and Sadorsky, 2008) GARCH model (Mollick and Assefa, 2013) and multiple regression (Driesprong et al., 2008; Mohanty et al., 2011). However, the above methods all apply ordinary least squares (OLS) as foundation research. As such, the sequence of finance and economy often exist fat-tailed, asymmetric and heteroskedasticity phenomena, which in turn cannot explain the effects of extreme values. For this reason, this study attempts to employ the quantile regression to carry out in-depth exploration since quantile regression’s objective function is the sum of weighted absolute deviation, which can be able to provide quantile statistical measures and a definitive set of explanatory variables that can be simultaneously analyzed by the entire conditional distribution in a given set of explanatory variables.
The paper is organized into four parts as follows: Section 1 through applying previous literatures aims to introduce two critical factors affecting stock price volatility in Taiwan and Korea, namely stock trading value and oil price changes, simultaneously interprets the impact of the US implementation of quantitative easing monetary policy on the economy, followed by Section 2 which describes the methodological approach and process of quantile regression and Section 3 with results and interpretation. Finally, Section 4 presents conclusion, discussions, and applications of the findings.
2. METHODOLOGY
2.1. Data
This study targeted the Taiwan Stock Exchange Capitalization Weighted stock Index (TAIEX) and its trading value (hereafter T volume), Korea Composite Stock Price Index (KOSPI) and its trading value (hereafter K volume) to be the research objects. Additionally, since the US quantitative easing (QE) monetary policy was put into practice in November 2008, this study attempted to choose to collect date in two main periods of (1) the foregoing sequence of QE from April 2004 to October 2008 (dummy variable= 0) and (2) the post-sequence of QE from November 2008 to February 2013 (dummy variable= 1). In sum, in order to seek for sequence information reciprocally, this study totally collected 106 monthly data from April 2004 to February 2013.
Regarding oil price data, this study aimed to take oil price derived from West Texas Intermediate (WTI) for investigation since WTI was the main oil source of the US and the US played an important part as the largest oil consuming market all over the world. Hence, WTI index could act as a reliable representation. Finally, all sequence variables proposed in this study were derived from Taiwan Economic Journal (TEJ) and were represented by the type of natural logarithm.
2.2. The Analysis of Quantile Regression
Multiple regressions is a statistical method commonly adopted by social science research, which utilizes ordinary least squares (OLS) to estimate “mean” marginal effect of independent variable on dependent variable and emphasizes on central tendency of distribution. Multiple regressions have been often compared with the quantile regression approach proposed by Koenker and Bassett (1978) the parameter estimation of which is built on the standard of minimum sum of absolute all error. Since the estimated parameter is carried out based on original sample from the past to make distribution assumptions, the achieved results would be more consistent to the robustness of statistical inference.
In addition, Zhuang and Kuan (2005) and Zhang et al. (2009) in their empirical study find that when the sample is not biased distributed, the estimated results of least-squares regression and quantile regression are consistent; nonetheless, when the sample is asymmetric distributed, quantile regression results for the marginal effects of different quantiles would be more reasonable. Finally, the quantile regression approach is utilized in this study since in practical application, for an estimated two-tailed end, quantile regression model has been assessed to be more accurate than the least-squares regression.
As aforementioned, this study aimed to investigate the impacts of stock trading value, oil price rate changes, and the US implementation of Quantitative easing (QE) monetary policy on Taiwan’s and Korea’s stock index returns. The linear regression model was as follows:
 ,
, (1)
(1)
where  was Taiwan’s or Korea’s stock index returns,
  represent the explanatory variables (i.e., Taiwan’s or Korea’s stock trading value, international oil price changes, the US quantitative easing monetary policy),
  was the parameter vector, and
  was the corresponding error term.
As mentioned above, the ordinary least squares (OLS) utilize the mean value to observe its effects; however, in many practical studies, it is necessary not only to explore the average performance but also to take tail-biting distribution cases to be observation focuses. Unlike OLS which takes minimum solution of average sum of square, quantile regression is based on minimum absolute deviation under the specific quantile solution (Koenker and Hallock, 2001) which can not only provide estimation results under different quantiles but also clearly show the marginal effect of explanatory variables on explained variables under “specific quantile”. For instance, in a specific quantile θ, the value of observation once being smaller or greater than θ would be determined as θ: (1- θ) ratio. In the optimization solution process, it is based on the given asymetric weights of absolute deviations (1-θ) and θ to reflect the LOCAT model characteristics.
In the present study, explained variables  and explanatory variables
 in θ quantile were defined as follows:
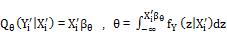 (2)
(2)
where  was the density function under conditions
  . The quantile regression was written as follows:
 , (3)
, (3)
where  was explained variables (i.e., Taiwan or Korea stock index returns), was explanatory variables (i.e., Taiwan or the Korea stock market trading value, international oil price changes, the US implementation of quantitative easing monetary policy), β was the parameter vector, θ was the quantile with θ
  (0,1), and
  was the corresponding error.
In the linear model, given the weight of θ (0<θ<1), this study utilized weighted average absolute error to estimate the objective function of the  quantile regression.
The estimation equation was as follows:
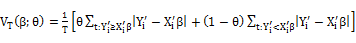 (4)
(4)
In this equation, T was the number of sample. If θ was smaller than 0.5, which stated that the weights of positive residuals of the objective function was smaller and the weights of negative residuals was larger, the quantile would be left-skewed distributed. In the same manner, if θ was larger than 0.5, which indicated that the weights of positive residuals of the objective function was larger and the weights of negative residuals was smaller, the quantile would be right-skewed distributed. When θ was equal to 0.5, which presented that the weights of positive and negative absolute residuals were equal, the objective function of Equation (4) and the minimum mean absolute error of the estimator are same. Hence, the estimator’s regression model was median regression.
Equation (4) assigned different weights to positive and negative absolute residuals. Through minimizing a weighted sum of absolute residuals, the quantile regression estimators were obtained from different quantiles. If observation  was greater than or equal to estimator
  , the weight was determined to be θ. If observation was less than estimator , the weight was determined to be 1-θ, from which the parameters
 were calculated.
3. EMPIRICAL RESULTS
The test results of each variable’s states, Taiwan stock trading value (lnTvol) was found to be left-skewed distributed (-0.05), Korea stock trading value (lnKvol) was left-skewed distributed (-3.96), oil price change rate ( was left-skewed distributed (-0.31), Taiwan Stock Exchange Capitalization Weighted stock Index return rate
 was left-skewed distributed ((-0.70), and the Korea Composite Stock Price Index return rate (
 was also left-skewed distributed (-0.78). hence, it could be observed that the test results not only presented each variable’s non-normally distributed characteristics but also displayed their skewness phenomena, which was suitable for conducting quantile regression.
This study aimed to explore the impacts of Taiwan stock trading value (lnTvol), oil price change rate ( and the US implementation of quantitative easing (QE) on Taiwan Stock Exchange Capitalization Weighted stock Index return rate , as well as the Korea stock trading value (lnKvol), oil price change rate ( and the US implementation of quantitative easing (QE) on Korea Composite Stock Price Index return rate (. The quantile was selected using θ= 0.1, 0.2, 0.3,…, 0.9. For further examining the influences of extreme values, two quantiles 0.05 and 0.95 were added; hence, the total number of quantiles was 11.
Table 1 showed the results of quantile regression and OLS estimates. In the estimate of OLS, the impact of Taiwan stock market trading value on stock index returns was not significant. In terms of average, similarly there was no significant effect of Taiwan stock trading value on stock index returns. However, using quantile regression, this study found that when quantile increased, the impact of stock trading value also gradually increased. It was even noted that in the quantile of 0.7, 0.8, and 0.95, stock trading value significantly and positively affected Taiwan stock index returns. In other words, in the high distribution of stock index returns, Taiwan stock trading value would gradually increase its influence on stock index returns until trading value pushed stock index returns up to the highest peak, which in turn formed the so-called phenomenon of “the stock price increases and the trading volume rises, the stock price declines and the trading volume descends”. Noteworthy, despite being located in the 0.05 and 0.1 quantiles, stock trading value negative affected stock index returns; nonetheless, non- significant. This result represented that stock trading value did not affect stock index returns.
Moreover, in the OLS estimate of Korea stock market, stock trading value was found to have no significant phenomenon on stock index returns. Meanwhile, using quantile regression, this study pointed out that the influences of stock trading value on stock index returns were considerably affected by quantile. When quantile increased, the impact of stock trading value also gradually increased until the 0.8 quantile, and declined after this. It was obviously observed that under a major of quantiles, stock trading value did not have significant impacts on stock index returns, except for the phenomenon of “the stock price increases and the trading volume rises, the stock price declines and the trading volume descends” being seen in the 0.95 quantile in Korea stock market. In addition, in the 0.2 quantile of Korea stock market, stock trading value was noticed to exert a significantly negative impact on stock index returns, which in turn indicated that the increase of stock trading value would lead to the decline of stock index returns. In sum up, in the high stock index returns distribution of two countries (under 0.95 quantile), the same phenomenon of “the stock price increases and the trading volume rises, the stock price declines and the trading volume descends” was presented. Nevertheless, in the situation of 0.2 quantile of Korea stock market, stock trading value presented a significantly negative impact on stock index returns.
Regarding the Taiwan context, through using OLS estimate to explore the impact of oil price changes on Taiwan stock index returns, this study found a positive but not significant relationship. However, through utilizing quantile regression, this study proposed that the extent oil price changes affecting Taiwan stock index returns was dependent on the increase of quantile. In other words, increasing quantile declined the impacts. This phenomenon kept occurring until the quantile was above 0.7, and then it started to increase. Nevertheless, most of them were not significant, except for significant impacts noticed in the quantile of 0.05 and 0.1. This could be explained that under low distribution of Taiwan stock index returns, oil price changes positively affected stock index returns.
Regarding the Korea context, through using OLS estimate to explore the impact of oil price changes on Korea stock index returns, this study proposed that oil price change had a significantly positive impact on stock index returns. In other words, this result showed that Korea stock index returns were deeply affected by international oil price changes. Further using quantile regression, this study pointed out that Korea stock index returns were affected by international oil price changes. Broadly speaking, the increasing quantile would cause the slight decline of impact coefficient; nonetheless, a major of them were not significant, except for the significantly positive impacts noticed in the quantile of 0.05 and 0.2 of Korea stock index returns. This could be explained that under low distribution of Korea stock index returns, international oil price changes significantly and positively affected stock index returns.
To sum up, both Taiwan and Korea stock index returns were affected by international oil price changes, especially in the low distribution of stock index returns.
The US implementation of quantitative easing monetary policy was examined for its impacts on Taiwan and Korea stock index returns. Surprisingly, from OLS and each quantile estimate, no significant relationships were found. In other words, this finding strongly indicated that the US implementation of quantitative easing monetary policy had no significant influences on Taiwan and Korea stock index returns.
For better clarifying the relationships between Taiwan and Korea stock trading values and oil price changes on stock index returns under the influence of the US implementation of quantitative easing (QE) monetary policy, this study further put other dummy variables affected by QE into quantile regression equation to increase the impacts of Taiwan stock trading value change on stock index returns under the influence of QE (referred to as QE*lnTvol) and of Korea stock trading value change on stock index returns under the influence of QE (referred to as QE*lnKvol) as well as oil price changes on Taiwan and Korea stock index returns under the influence of QE (referred to as QE*△lnOIL). The achieved estimated values were shown as in Table 1.
The obtained results were as follows:
First, in the high distribution of Taiwan stock index returns, stock trading value (lnTvol) had a significantly positive impact on stock index returns. However, under the effect of the US quantitative easing monetary policy (QE*lnTvol), Taiwan stock trading value changes were found to have no significant influences on stock index returns. This result implied that under the situation of high distribution, there was no difference among the impacts of Taiwan stock trading value changes on stock index returns before and after implementing quantitative easing monetary policy. In other words, Taiwan stock market presented the same phenomenon of “the stock price increases and the trading volume rises, the stock price declines and the trading volume descends” before and after the implementation of the US quantitative easing monetary policy. Second, in the high distribution (0.95 quantile) of Korea stock index returns, the impact of stock trading value (lnKvol) on stock index returns presented the phenomenon of “the stock price increases and the trading volume rises, the stock price declines and the trading volume descends”. In the low distribution (0.2 quantile), it would cause stock index returns to decline. Under the effect of the US quantitative easing monetary policy (QE*lnKvol), this study claimed that Korea stock trading value changes had no significant impacts on stock index returns under 0.2 and 0.95 quantile. In other words, in high and low distribution of stock index returns, there were is no differences among the impacts of Korea stock trading value changes on stock index returns before and after implementing quantitative easing monetary policy.
In the low distribution quantiles (0.05 and 0.1) of Taiwan stock index returns, there was a positive impact of oil price changes (△lnOIL) on stock index returns. However, under the effect of the US quantitative easing monetary policy (QE*△lnOIL), no significant impact of oil price changes on stock index returns was found in the low distribution, which in turn implied there were no differences among the impacts of oil price changes on stock index returns before and after implementing quantitative easing monetary policy. In the low distribution quantile (0.05 and 0.2) of Korea stock index returns, international oil price changes were observed to exert significant impacts on stock index returns. Nonetheless, under the effect of the US quantitative easing monetary policy (QE*△lnOIL), oil price changes showed no significant impact on stock index returns, indicating there were no differences among the impacts of oil price changes on Korea stock index returns before and after implementing quantitative easing monetary policy.
4. CONCLUSION, DISCUSSION AND APPLICATION
4.1. Conclusion
This study adopts quantile regression to explore the impacts of variables of stock trading value, international oil price change, and the US quantitative easing monetary policy on Taiwan and Korea stock index returns. The results are as follows:
In the high distribution of Taiwan stock index returns, Taiwan stock trading value has a significantly positive impact on stock index returns and forms the so-called phenomenon of “the stock price increases and the trading volume rises, the stock price declines and the trading volume descends”. Similarly, the Korea stock market also presents the phenomenon of “the stock price increases and the trading volume rises, the stock price declines and the trading volume descends”. In addition, this study finds that under the situation of low distribution of stock index returns, Korea stock trading value when increasing will cause stock index returns to fall.
Table-1. Quantile regression estimation results of stock market trading value, oil price change rate, and the US quantitative easing monetary policy on Taiwan’s and Korea’s stock markets return.
| △ln(TAIEX) | △ln(KOSPI) | △ln(TAIEX) | △ln(KOSPI) | △ln(TAIEX) | △ln(KOSPI) | △ln(TAIEX) | △ln(KOSPI) | △ln(TAIEX) | △ln(KOSPI) | |
| Estimates | Estimates | Estimates | Estimates | Estimates | Estimates | Estimates | Estimates | Estimates | Estimates | |
| Quantile | lnTvol | lnKvol | △lnOIL | △lnOIL | QE | QE | QE* lnTvol | QE* lnKvol | QE* △lnOIL | QE* lnOIL |
| 0.05 | -5.495 | 2.033 | 0.203* | 0.461* | 4.140 | 3.882 | 2.812 | 0.626 | -0.177 | -0.041 |
| 0.10 | -3.895 | 1.559 | 0.224* | 0.220 | 4.430 | 2.272 | -4.907 | 5.809 | -0.149 | -0.281 |
| 0.20 | 0.268 | -3.010* | 0.155 | 0.252* | -0.041 | 2.412 | -6.622 | 3.065 | 0.050 | -0.119 |
| 0.30 | 0.761 | -1.474 | 0.170 | 0.237 | 1.452 | 1.226 | -7.504 | 1.486 | 0.168 | 0.013 |
| 0.40 | 3.793 | -0.458 | 0.086 | 0.178 | 0.163 | 0.072 | -2.246 | 1.614 | 0.008 | -0.055 |
| 0.50 | 0.929 | 0.849 | 0.047 | 0.167 | -0.230 | -0.834 | -0.730 | 5.315 | 0.059 | -0.168 |
| 0.60 | 2.047 | -0.065 | 0.049 | 0.123 | -0.279 | -0.748 | 8.294 | 5.376 | -0.041 | -0.103 |
| 0.70 | 5.213* | 2.154 | -0.042 | 0.154 | 0.632 | -1.119 | 5.803 | 2.171 | -0.151 | -0.088 |
| 0.80 | 6.165* | 3.924 | 0.030 | 0.122 | -0.691 | -2.751 | 8.478 | 6.092 | -0.126 | 0.084 |
| 0.90 | 5.536 | 1.151 | 0.096 | 0.140 | 0.135 | -0.944 | 6.846 | 5.430 | 0.022 | -0.190 |
| 0.95 | 6.109* | 1.878* | 0.144 | 0.044 | -1.414 | -2.851 | 9.171 | 4.034 | -0.035 | -0.066 |
| OLS | 2.043 | 0.681 | 0.127 | 0.210* | 0.783 | 0.196 | 4.305 | -0.068 | 2.946 | -0.074 |
Note: * under 5% significant level (p<0.05)
Regarding the impacts of oil price change on two countries’ stock index returns under the situation of low distribution of return rate, changes in international oil prices have been found to have a significantly positive impact on Taiwan and Korea stock index returns.
Finally, in terms of the US implementation of quantitative easing (QE) monetary policy on Taiwan and Korea stock index returns, the result surprisingly shows no significant relationship between them. In other words, the US implementation of quantitative easing monetary policy on Taiwan and Korea stock index returns has no influence on Taiwan and Korea stock index returns. Further exploring the impacts of Taiwan stock trading value changes on stock index returns before and after QE, the achieved results present no difference between them, which in turn support the same phenomenon concerning “the stock price increases and the trading volume rises, the stock price declines and the trading volume descends” in Taiwan stock market before and after QE. Regarding the Korea stock market, under situations of high and low distribution of Korea stock index returns, the result shows no differences between the impacts of stock trading value changes on stock index returns before and after QE implementation, which is consistent with the phenomenon of “the stock price increases and the trading volume rises, the stock price declines and the trading volume descends”. Additionally, stock trading value is found to have a negative impact on stock index returns. In sum, it can be concluded that before and after implementing QE monetary policy in Taiwan and Korea, in the low distribution of stock index returns, this study finds no difference between the impacts of oil price changes on two countries’ stock index returns, indicating international oil price changes all present positive impacts on stock index returns.
4.2. Discussion and Application
With the achieved results, this study has provided three considerable contributions as follows:
First, this study proposes that Taiwan’s and Korea’s stock trading values exert significantly positive impacts on stock index returns due to the high return rate situations. Therefore, when facing stock market-related issues in these two countries, investors are recommended to constantly pay attention to the changes of price and quantity since large trading value pushes up stock price and raises stock index returns as well as small trading value enables the slump of stock price and deflates stock index returns on the contrary. Hence, once investors reduce the situations of pursuing high stock prices, stock prices would definitely become bubbling and slumping, especially the high return distribution of stock index returns.
Second, this study states that despite being two countries with the extreme lack of natural resources, Taiwan and Korea are considerably affected by changes in international oil prices. Specifically, in the low return distribution of two countries stock index returns, the rise of international oil prices is of great benefit to push stock index returns up. For this reason, investors while conducting investments in stock markets and high stock index returns is not the case can observe the international oil prices. If the phenomenon that the demands in oil increase and consequently cause the rise of oil prices is recognized, it can be concluded that the industry would extend production capacity and it is the right time to proceed to stock investments.
Finally, this study finds no direct impacts of the US implementation of quantitative easing monetary policy on Taiwan and Korea stock index returns. However, since current global financial markets all pay close attention to when the implementation of quantitative easing monetary policy will be closed, investors are suggested to more carefully observe the indirect effects of QE on each country’s currency quantity in this time.
| Funding: This study received no specific financial support. |
| Competing Interests: The authors declare that they have no competing interests. |
| Contributors/Acknowledgement: All authors contributed equally to the conception and design of the study. |
REFERENCES
Aloui, C. and R. Jammazi, 2009. The effects of crude oil shocks on stock market shifts behavior: A regime switching approach. Energy Economics, 31(5): 789-799.
Assogbavi, T., N. Khoury and P. Yourougou, 1995. Short interest and the asymmetry of the price-volume relationship in the Canadian market. Journal of Banking and Finance, 19(8): 1341-1358.
Basher, S.A. and P. Sadorsky, 2006. Oil price risk and emerging stock markets. Global Finance Journal, 17(2): 224-251.
Blinder, A.S., 2010. Quantitative easing: Entrance and exit strategies. Federal Reserve Bank of St. Louis Review, 92(6): 465-479.
Chen, G., M. Firth and O.M. Rui, 2001. The dynamic relation between stock returns, trading volume and volatility. Financial Review, 36(3): 153-174.
Chen, S.S., 2012. Revisiting the empirical linkages between stock returns and trading volume. Journal of Banking and Finance, 36(6): 1781-1788.
Chuang, C.C., C.M. Kuan and H.Y. Lin, 2009. Causality in quantiles and dynamic stock return-volume relations. Journal of Banking and Finance, 33(7): 1351-1360.
Driesprong, G., B. Jacobsen and B. Maat, 2008. Striking oil: Another puzzle? Journal of Financial Economics, 89(2): 307-327.
Eichengreen, B., 2013. Currency war or international policy coordination? Journal of Policy Modeling, 35(3): 425–433.
Faff, R. and T. Brailsford, 1999. Oil rice risk and the Australian stock market. Journal of Energy Finance and Development, 4(1): 69–87.
Fan, X., N. Groenwold and Y. Wu, 2003. The stock return-volume relation and policy effects: The case of the energy sector. Proceedings of the 15th Annual Conference of the Association for Chinese Economics Studies Australia ACESA.
Girardin, E. and Z. Moussa, 2011. Quantitative easing works: Lessons from the unique experience in Japan 2001-2006. Journal of International Financial Markets, Institutions and Money, 21(4): 461- 495.
Gisser, M. and T.H. Goodwin, 1986. Crude oil and the macroeconomy: Tests of some popular notions: Note. Journal of Money, Credit, and Banking, 18(1): 95-103.
Hamilton, J.D. and J. Wu, 2011. The effectiveness of alternative monetary policy tools in a zero lower bound environment. Journal of Money, Credit and Banking, 44(S1): 3-46.
Henriques, I. and P. Sadorsky, 2008. Oil prices and the stock prices of alternative energy companies. Energy Economics, 30(3): 998-1010.
Hondroyiannis, G. and E. Papapetrou, 2001. Macroeconomic influences on the stock market. Journal of Economics and Finance, 25(1): 33-49.
Huang, R.D., R.W. Masulis and H.R. Stoll, 1996. Energy shocks and financial markets. Journal of Futures Markets, 16(1): 1-27.
Jones, C.M. and G. Kaul, 1996. Oil and the stock markets. Journal of Finance, 51(2): 463-491.
Kagraoka, Y. and Z. Moussa, 2013. Quantitative easing, credibility and the time-varying dynamics of the term structure of interest rate in Japan. Journal of International Financial Markets, Institutions & Money, 25(1): 181- 201.
Karras, G., 2013. Asymmetric effects of monetary policy with or without quantitative easing: Empirical evidence for the US. Journal of Economic Asymmetries, 10(1): 1-9.
Kobayashi, T., M.M. Spiegel and N. Yamori, 2006. Quantitative easing and Japanese bank equity values. Journal of the Japanese and International Economies, 20(4): 699-721.
Koenker, R. and G. Bassett, 1978. Regression quantiles. Econometrica, 46(1): 33-50.
Koenker, R. and K.F. Hallock, 2001. Quantile regression. Journal of Economic Perspectives, 15(4): 143-156.
Lee, B.S. and O.M. Rui, 2002. The dynamic relationship between stock returns and trading volume: Domestic and cross-country evidence. Journal of Banking and Finance, 26(1): 51-78.
Lyonnet, V. and R. Werner, 2012. Lessons from the bank of England on quantitative easing and other unconventional monetary policies. International Review of Financial Analysis, 25(1): 94-105.
Maghyereh, A. and A. Kandari, 2007. Oil prices and stock markets in GCC countries: New evidence from nonlinear cointegration analysis. Managerial Finance, 33(7): 449-460.
Mohanty, S.K., M. Nandha, A.Q. Turkistani and M.Y. Alaitani, 2011. Oil price movements and stock market returns: Evidence from gulf cooperation council (GCC) countries. Global Finance Journal, 22(1): 42-55.
Mollick, A.V. and T.A. Assefa, 2013. U.S. stock returns and oil prices: The tale from daily data and the 2008-2009 financial crisis. Energy Economics, 36(1): 1-18.
Naifar, N. and M.S.A. Dohaiman, 2013. Nonlinear analysis among crude oil prices, stock markets return and macroeconomic variables. International Review of Economics and Finance, 27(c): 416-431.
Nguyen, C.C. and M.I. Bhatti, 2012. Copula model dependency between oil prices and stock markets: Evidence from China and Vietnam. Journal of International Financial Markets, Institutions and Money, 22(4): 758-773.
Putnam, B.H., 2013. Essential concepts necessary to consider when evaluating the efficacy of quantitative easing. Review of Financial Economics, 22(1): 1-7.
Qinbin, F., R. Mohammad and J. Parvar, 2012. U.S. industry-level returns and oil prices. International Review of Economics and Finance, 22(1): 112-128.
Rashid, A., 2007. Stock prices and trading volume: An assessment for linear and nonlinear Granger causality. Journal of Asian Economics, 18(4): 595-612.
Saatcioglu, K. and L.T. Starks, 1998. The stock price-volume relationship in emerging stock markets: The case of Latin America. International Journal of Forecasting, 14(2): 215-225.
Schenkelberg, H. and S. Watzka, 2013. Real effects of quantitative easing at the zero lower bound: Structural VAR-based evidence from Japan. Journal of International Money and Finance, 33(1): 327-357.
Statman, M., S. Thorley and K. Vorkink, 2006. Investor overconfidence and trading volume. Review of Financial Studies, 19(4): 1531-1565.
Tang, W., L. Wu and Z.X. Zhang, 2010. Oil price shocks and their short- and long-term effects on the Chinese economy. Energy Economics, 32(1): S3-14.
Wang, A. and D.G. Mayes, 2012. Monetary policy announcements and stock reactions: An international comparison. North American Journal of Economics and Finance, 23(2): 145- 164.
Xu, X.E., P. Chen and C. Wu, 2006. Time and dynamic volume-volatility relation. Journal of Banking and Finance, 30(1): 1535-1558.
Yang, C.W., M.J. Hwang and B.N. Huang, 2002. An analysis of factors affecting price volatility of the US oil market. Energy Economics, 24(2): 107-119.
Ying, C.C., 1966. Market prices and volumes of sales. Econometrica, 34(3): 676-685.
Zhang, Jiang and Zhang, 2009. Quantile regression analysis of residential mass appraisal models - improvement in atypical housing appraisa. Journal of City and Planning, 36(3): 281-304.
Zhuang and Kuan, 2005. A quantile regression analysis of return-volume relation: Evidence from the Taiwan and U.S. institute of economics. Academia Economic Papers, 33(4): 379-404.
| Views and opinions expressed in this article are the views and opinions of the author(s), Asian Economic and Financial Review shall not be responsible or answerable for any loss, damage or liability etc. caused in relation to/arising out of the use of the content. |