


IS CORRUPTION ‘GREASE’ OR ‘SAND’ IN THE WHEELS OF FOREIGN DIRECT INVESTMENT INFLOWS IN THE SOUTH ASIAN ECONOMIES?

Department of Economics, Faculty of Commerce and Management, Eastern University, Sri Lanka.
ABSTRACT
The objective of this study is to investigate whether the corruption serves as ‘grease’ or ‘sand’ in the wheels of Foreign Direct Investment inflow in South Asian Countries, namely Sri Lanka, India, Pakistan, Nepal, and Bangladesh during the period from 2002 to 2018. Using annual time series panel data, the Random Effect method is employed for the analysis. The results derived from the analysis suggest that FDI inflows improve when the perception of the investors over the level of corruption in these countries is favorable to the investment. Therefore, improvement in the perception of corruption towards clean facilitates the foreign direct investment inflow in these countries.
Keywords:Corruption , Foreign direct investment, South Asia , Random effect, Corruption perception index.
JEL Classification:F21, F23, D73.
ARTICLE HISTORY: Received: 19 June 2020, Revised: 27 July 2020, Accepted: 31 August 2020, Published: 15 September 2020
Contribution/ Originality: This study is one of very few studies which have investigated the function of corruption in terms of Foreign Direct Investment inflows in case of the South Asian economies. Findings of this study would be helpful to the policy makers to develop investment climate and business people to formulate investment choices.
1. INTRODUCTION
The concept of corruption has now become a universal phenomenon and its spirit in affecting the quality of the economic aspects has not ended because the shape and the magnitude of the impact of corruption are multidimensional and complexity. Thus, the relationship between the type and level of corruption and economic performance is constantly inconclusive and remains a debatable topic in the literature. Transparency international delineates the corruption as an ‘abuse of entrusted power for private gain’ or ‘the abuse of public office for private (economic) gain’ which can be the shape of bribery, embezzlement, fraud, favoritism, and extortion and also stated that corruption can be a major obstacle to good policymakers. Excessive patronage, nepotism, job reservations, favor-to-favor, secret party funding, and suspiciously close ties between politics and business are also considered another shape of corruption (Kholdy & Sohrabian, 2008![]() ). In addition to that corruption distorts the rule of law and weakens a nation’s institutional foundation (Kouneva-Loewenthal & Vojvodic, 2012
). In addition to that corruption distorts the rule of law and weakens a nation’s institutional foundation (Kouneva-Loewenthal & Vojvodic, 2012![]() ). Further, corruption may affect the performance of other crucial indicators, such as quality of the environment, personal health and safety, equity and equality, and trust. These circumstances will impact a country’s economic welfare and weaken its development potential. Diversion of public funds, irregular payment and bribes, favoritism in decisions by government officials, and organized crimes are also the indicators of corruption and have an adverse impact on growth as public works are diverted for politician interest (Gupta & Ahmed, 2018
). Further, corruption may affect the performance of other crucial indicators, such as quality of the environment, personal health and safety, equity and equality, and trust. These circumstances will impact a country’s economic welfare and weaken its development potential. Diversion of public funds, irregular payment and bribes, favoritism in decisions by government officials, and organized crimes are also the indicators of corruption and have an adverse impact on growth as public works are diverted for politician interest (Gupta & Ahmed, 2018![]() ); (Anderson, 2015
); (Anderson, 2015![]() ).
).
Generally, the impact of corruption on economic development is mixed and will not have a direct impact on major economic performance. Instead, it has the effects on a host country’s economy through some transmission channels, such as investment flows, competition, and entrepreneurship, government efficiency, which may include government expenditure and revenues as well as human capital formation. As far as Foreign Direct Investment (FDI) is concerned, the FDI is treated as one of the transmission channels through which it has an impact on economic growth. Therefore, corruption serves as ‘sand the wheels’ or ‘grabbing hand’ in FDI inflows treated as a major leak in piping financial flows across the countries. As per the theory of OLI, the level of corruption is aligned with the characteristics of location advantage which is represented by ‘L’ implies the negative relationship between FDI inflow and the level of corruption in the host country (Brada, Drabek, & Perez, 2012![]() ). The corruption will also significantly influence foreign investors by increasing the cost of investment and reduce its profitability and ratio of investment to GDP (Lambsdorff, 2003; Sha, 2018
). The corruption will also significantly influence foreign investors by increasing the cost of investment and reduce its profitability and ratio of investment to GDP (Lambsdorff, 2003; Sha, 2018![]() ). Further, the investment will get redirection mainly towards informal sectors, avoiding different forms of corruption and demanding a sub-optimal allocation of resources.
). Further, the investment will get redirection mainly towards informal sectors, avoiding different forms of corruption and demanding a sub-optimal allocation of resources.
1.1. The Trend of Corruption Indices and FDI in South Asian Countries
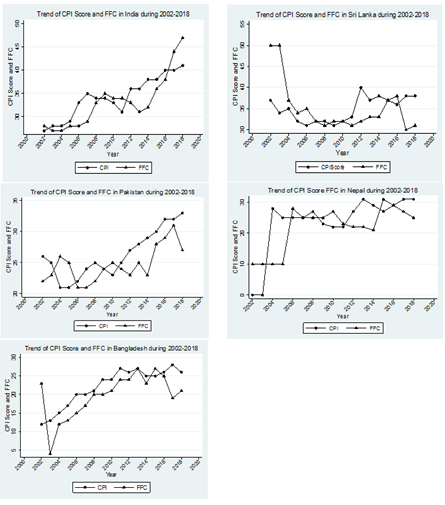
Figure-1. The Trend of Corruption Indices in South Asian Countries.
This study takes two corruption-related indices such as Corruption Perception Score (CPI) which has been widely used by scholars, and Freedom from Corruption (FFC) in order to investigate the association between these indices and FDI. The association will concretely explore whether corruption has an impact on FDI. The two indices used as substitutable for another and compatible to ensure the degree and the direction of the impact of corruption on the FDI and this differs from the studies of Woo and Heo (2009![]() ); Quazi (2014
); Quazi (2014![]() ); Sha (2018
); Sha (2018![]() ) and Gupta and Ahmed (2018
) and Gupta and Ahmed (2018![]() ) who investigated the relationship between FDI and corruption in case of South Asian countries. As per Figure 1 given above, the trend of two indices in the South Asian countries, except in the case of India, appears unstable and has not shown a systematic pattern to drive a conclusion over the trend of performance of corruption. The travel of indices in India and Bangladesh is relatively upward, whereas it is mostly horizontal in Sri Lanka, Pakistan and Nepal.
) who investigated the relationship between FDI and corruption in case of South Asian countries. As per Figure 1 given above, the trend of two indices in the South Asian countries, except in the case of India, appears unstable and has not shown a systematic pattern to drive a conclusion over the trend of performance of corruption. The travel of indices in India and Bangladesh is relatively upward, whereas it is mostly horizontal in Sri Lanka, Pakistan and Nepal.
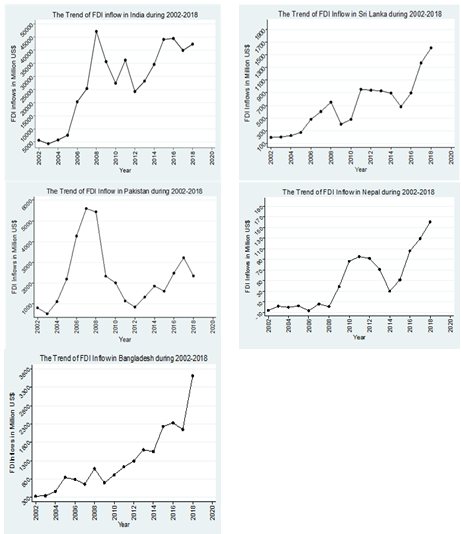
Figure-2. The Trend of FDI inflows in South Asian Countries.
As far as the trend FDI inflows, as shown in Figure 2, in South Asian countries is concerned, the performances in each country vary during the years. FDI inflow is relatively steady in India and Bangladesh with minor fluctuations, whereas Sri Lanka and Nepal register a steady upward trend after 2014. FDI inflow in Pakistan has major bumping in the trend and does not register any major steady move.
It is noted that the average trend of performance of corruption perception scores is relatively high in India and Sri Lanka, registered at 34.17 and 35, respectively see Table 1, whereas leaving other countries to have less score. The increase in the trend of FDI inflows in these countries also signals that there might have been an association between improvement in the corruption climate in favor of investors and FDI inflows. However, though the corruption perception score in Bangladesh and Nepal are is relatively less such as 22.11 and 23.64 than that of in Pakistan’s score that is 26.29, but appear relatively steady upward move in FDI inflows trigger for an investigation whether really the corruption has an association with FDI inflows in these countries.
2. LITERATURE REVIEW
The literature has a mix of findings over the impact of corruption on FDI. Some findings of the scholars in the line of treating corruption as ‘sand’ in the wheel of FDI inflow are already in the literature. Habib and Zurawicki (2002![]() ) have found that corruption is a serious obstacle for investment. Woo and Heo (2009
) have found that corruption is a serious obstacle for investment. Woo and Heo (2009![]() ) analyzed the impact of the perceived level of corruption on the FDI attractiveness of Asian economies and concluded that the corruption hinders efforts of countries in attracting FDI. According to Cuervo-Cazurra (2008
) analyzed the impact of the perceived level of corruption on the FDI attractiveness of Asian economies and concluded that the corruption hinders efforts of countries in attracting FDI. According to Cuervo-Cazurra (2008![]() ) transition economies have high levels of corruption when FDI is also high. Cuervo-Cazurra (2006
) transition economies have high levels of corruption when FDI is also high. Cuervo-Cazurra (2006![]() ) also expresses two findings that the corruption not only hinders the FDI but higher FDI from the country with the high level of corruption, and further suggests that not all the FDI owners care about it. Hakkala, Pehr-Johan, and Svaleryd (2005
) also expresses two findings that the corruption not only hinders the FDI but higher FDI from the country with the high level of corruption, and further suggests that not all the FDI owners care about it. Hakkala, Pehr-Johan, and Svaleryd (2005![]() ) stated that corruption would reduce the probability that a country receives foreign investment. Castro and Nunes (2013
) stated that corruption would reduce the probability that a country receives foreign investment. Castro and Nunes (2013![]() ) have derived the conclusion analyzing 73 countries that countries are enough ability to attract FDI where the lower level of corruption exists. Similarly, Ketkar, Murtuza, and Ketkar (2005
) have derived the conclusion analyzing 73 countries that countries are enough ability to attract FDI where the lower level of corruption exists. Similarly, Ketkar, Murtuza, and Ketkar (2005![]() ) found that improvement in CPI facilitates the FDI inflow. According to Freckleton, Wright, and Craigwell (2012
) found that improvement in CPI facilitates the FDI inflow. According to Freckleton, Wright, and Craigwell (2012![]() ) lower level of corruption leading to have a higher level of the growth impact of FDI whereas Mudambi, Navarra, and Delios (2012
) lower level of corruption leading to have a higher level of the growth impact of FDI whereas Mudambi, Navarra, and Delios (2012![]() ) have stated that FDI and the level of corruption depend on the degree of economic regulations and does not have an independent influence on FDI. According to Barassi and Zhou (2012
) have stated that FDI and the level of corruption depend on the degree of economic regulations and does not have an independent influence on FDI. According to Barassi and Zhou (2012![]() ) corruption not only negatively affects the probability of FDI but it also affects the choice of FDI at the aggregate level. Fredriksson, List, and Millimet (2003
) corruption not only negatively affects the probability of FDI but it also affects the choice of FDI at the aggregate level. Fredriksson, List, and Millimet (2003![]() ) suggested that corruption negatively affects FDI inflow via two channels that widespread theft of public funds and having an ambiguous effect on capital flow.
) suggested that corruption negatively affects FDI inflow via two channels that widespread theft of public funds and having an ambiguous effect on capital flow.
Contrarily, some arguments have developed space in the literature that corruption may positively influence on the FDI serving as ‘helping hands’ or ‘greasing the wheel’ in some circumstances. As far as the pulling factors of FDI in host countries are concerned, corruption can function as ‘grease’ in the system and helps works get done. Analyzing 73 countries, Egger and Winner (2006![]() ) emphasized that corruption is a stimulus for FDI, and further suggested that corruption can be beneficial in the presence of circumventing regulation and administrative restriction. Quazi (2014
) emphasized that corruption is a stimulus for FDI, and further suggested that corruption can be beneficial in the presence of circumventing regulation and administrative restriction. Quazi (2014![]() ) said that grabbing hands develops uncertainty and discourage FDI whereas corruption serves as grease the wheel possibly facilitating FDI in the presence of weak regulatory framework. Similarly, Bellos and Subasat (2011
) said that grabbing hands develops uncertainty and discourage FDI whereas corruption serves as grease the wheel possibly facilitating FDI in the presence of weak regulatory framework. Similarly, Bellos and Subasat (2011![]() ) also noted the view that the function of the corruption as sand the wheel deters the FDI by increasing bribery, artificial bottlenecks, reducing the quality of transparency and predictability of the system of the property rights and government services and infrastructure, and the function of corruption as grease the wheel as a compensating element for the existence of bad governance and ill-functioning of institution in order to attract FDI. Rashid (1981
) also noted the view that the function of the corruption as sand the wheel deters the FDI by increasing bribery, artificial bottlenecks, reducing the quality of transparency and predictability of the system of the property rights and government services and infrastructure, and the function of corruption as grease the wheel as a compensating element for the existence of bad governance and ill-functioning of institution in order to attract FDI. Rashid (1981![]() ) found that the efficiency of the economic system can be possible when bureaucrats consider corruption as a windfall gain.
) found that the efficiency of the economic system can be possible when bureaucrats consider corruption as a windfall gain.
However, some scholars neither accept nor refuse the impact of corruption on FDI and have some different views. For instance, Gupta and Ahmed (2018![]() ) argue in the case of South Asian countries that corruption neither induces FDI nor impede corruption and conclude that corruption does not matter in case of FDI flows. Luu, Nguyen, Ho, and Nam (2018
) argue in the case of South Asian countries that corruption neither induces FDI nor impede corruption and conclude that corruption does not matter in case of FDI flows. Luu, Nguyen, Ho, and Nam (2018![]() ) concluded that the effect of corruption depending on the types of FDI and emphasized their conclusion by classifying FDI into green filed investment and cross-border mergers and acquisition whereas Burböck, Macek, Podhovnik, and Zirgoi (2018
) concluded that the effect of corruption depending on the types of FDI and emphasized their conclusion by classifying FDI into green filed investment and cross-border mergers and acquisition whereas Burböck, Macek, Podhovnik, and Zirgoi (2018![]() ) found that a negative performance of corruption distance has not had a greater impact on FDI compared to the positive performance of corruption taking emerging and industrialized countries into consideration. Godinez and Garita (2015
) found that a negative performance of corruption distance has not had a greater impact on FDI compared to the positive performance of corruption taking emerging and industrialized countries into consideration. Godinez and Garita (2015![]() ) have noted that firms in highly corrupted countries engaged in high corruption and vice versa whereas Ravi (2015
) have noted that firms in highly corrupted countries engaged in high corruption and vice versa whereas Ravi (2015![]() ) noted that the effect of corruption on FDI depends on nature, not by the size, and also found that corruption has an impact on FDI India but not in the case of China. Teles (2007
) noted that the effect of corruption on FDI depends on nature, not by the size, and also found that corruption has an impact on FDI India but not in the case of China. Teles (2007![]() ) has revealed the view that a country with judicial and bureaucratic corruption may have growth at high rate whereas leading to a low level of growth if these two types of corruptions exist simultaneously whereas Wu (2006
) has revealed the view that a country with judicial and bureaucratic corruption may have growth at high rate whereas leading to a low level of growth if these two types of corruptions exist simultaneously whereas Wu (2006![]() ) has explored that corruption in host countries does not matter to the investment flows from the home countries where there is a high corruption than it is from less corrupted countries.
) has explored that corruption in host countries does not matter to the investment flows from the home countries where there is a high corruption than it is from less corrupted countries.
Therefore, the findings of this study would be contributing to the literature as an addition to the knowledge over the impact of corruption on FDI inflow in South Asian Economies.
3. METHODOLOGY
3.1. Data
This study takes five South Asian countries, namely Sri Lanka, India, Pakistan, Nepal and Bangladesh into consideration. The annual time series panel data running from 2002 to 2018 extracted from the database of the World Bank, the United Nations Conference on Trade and Development (UNCTAD) and the database of the Transparency International.
3.2. Variables
The Foreign Direct Investment Inflow is treated as a dependent variable as it is identified as one of the vital variables involve in the transmission mechanism affecting economic performance with the presence of corruption. Corruption Perception Index score and Freedom from Corruption index are treated as proxy variables for corruption.
| Country | Variables | Obs. |
Mean |
Std. Dev. |
Min. |
Max. |
| Sri Lanka | Foreign Direct Investment Inflow | 17 |
699.18 |
407.25 |
192 |
1610.54 |
| Corruption Perception Score | 17 |
35 |
2.94 |
31 |
40 |
|
| Freedom form Corruption | 17 |
34.83 |
6.04 |
29 |
50 |
|
| Trade openness | 17 |
59.53 |
11.84 |
46.36 |
79.48 |
|
| Political Stability | 17 |
-0.79 |
0.58 |
-1.8 |
0.09 |
|
| Informal Sector | 17 |
3.23 |
2.82 |
-3.74 |
7.53 |
|
| India | Foreign Direct Investment Inflow | 17 |
27828.43 |
14704.36 |
4321.07 |
47102.42 |
| Corruption Perception Score | 17 |
34.17 |
4.46 |
27 |
41 |
|
| Freedom form Corruption | 17 |
33.17 |
5.7 |
27 |
47 |
|
| Trade openness | 17 |
44.72 |
7.82 |
29.51 |
55.79 |
|
| Political Stability | 17 |
-1.14 |
0.19 |
-1.51 |
-0.76 |
|
| Informal Sector | 17 |
3.03 |
4 |
-6.60 |
9.04 |
|
| Pakistan | Foreign Direct Investment Inflow | 17 |
2308.94 |
1524.98 |
534 |
5590 |
| Corruption Perception Score | 17 |
26.29 |
3.83 |
21 |
33 |
|
| Freedom form Corruption | 17 |
24.64 |
2.82 |
21 |
31 |
|
| Trade openness | 17 |
31.49 |
3.14 |
25.31 |
35.68 |
|
| Political Stability | 17 |
-2.28 |
0.41 |
-2.81 |
-1.55 |
|
| Informal Sector | 17 |
2.80 |
1.83 |
0.10 |
6.48 |
|
| Nepal | Foreign Direct Investment Inflow | 17 |
50.57 |
53.40 |
-6.65 |
160.77 |
| Corruption Perception Score | 15 |
23.64 |
9.36 |
22 |
31 |
|
| Freedom form Corruption | 17 |
21.76 |
7.19 |
10 |
31 |
|
| Trade openness | 17 |
47.26 |
3.73 |
41.83 |
55.23 |
|
| Political Stability | 17 |
-1.44 |
0.51 |
-2.15 |
-0.63 |
|
| Informal Sector | 17 |
3.08 |
1.68 |
0.23 |
5.82 |
|
| Bangladesh | Foreign Direct Investment Inflow | 17 |
1297.78 |
871.61 |
335.47 |
3613.3 |
| Corruption Perception Score | 17 |
22.11 |
5.14 |
12 |
28 |
|
| Freedom form Corruption | 17 |
19.70 |
6 |
4 |
27 |
|
| Trade openness | 17 |
38.61 |
6.5 |
26.86 |
48.11 |
|
| Political Stability | 17 |
-1.35 |
0.25 |
-1.86 |
-0.9 |
|
| Informal Sector | 17 |
3.95 |
1.57 |
-0.19 |
6.70 |
There are a number of indices in the measurement of corruption available in the literature. Malito (2014![]() ) has classified all indices into three groups such as survey-based measures of corruption, indicators of corruption provided by indices of governance, and indicators of corruption supplied by indices of state capacity. Of which the first group includes the widely used index CPI. Political stability indexes, trade openness, the informal sector of the economy is treated as other control variables to make the model good fit. The foreign direct investment inflows are the transactions recorded during the reference period in million US dollars. The corruption perception index score indicates the perceptions of the degree of corruption considered by the analysts and business people ranges between 100(highly clean) and 0 (highly corrupt). Freedom from corruption index is derived from the corruption perception index of Transparency International also note that the higher the value the lower the corruption level. The political stability index is the measurement of the perceptions of the likelihood over the political stability and the absence of violence/terrorism. The trade openness is measured as export plus import as a percentage of GDP. The informal sector is defined as a value addition of agriculture, forestry and fishing as a percentage of GDP. Table 1 shows the summary statistics.
) has classified all indices into three groups such as survey-based measures of corruption, indicators of corruption provided by indices of governance, and indicators of corruption supplied by indices of state capacity. Of which the first group includes the widely used index CPI. Political stability indexes, trade openness, the informal sector of the economy is treated as other control variables to make the model good fit. The foreign direct investment inflows are the transactions recorded during the reference period in million US dollars. The corruption perception index score indicates the perceptions of the degree of corruption considered by the analysts and business people ranges between 100(highly clean) and 0 (highly corrupt). Freedom from corruption index is derived from the corruption perception index of Transparency International also note that the higher the value the lower the corruption level. The political stability index is the measurement of the perceptions of the likelihood over the political stability and the absence of violence/terrorism. The trade openness is measured as export plus import as a percentage of GDP. The informal sector is defined as a value addition of agriculture, forestry and fishing as a percentage of GDP. Table 1 shows the summary statistics.
Table-2. Levin-lin-chu unit root test results.
Statistic |
||||
Variable |
Unadjusted t |
Adjusted t* |
p-value |
Stationary |
lnfdi |
-4.5702 |
-3.3216 |
0.0004 |
Yes*** |
ps |
-3.6007 |
-1.5757 |
0.0575 |
Yes*** |
lnto |
-4.6380 |
-2.1350 |
0.0164 |
Yes*** |
ffc |
-5.9773 |
-3.6552 |
0.0001 |
Yes*** |
cpis |
-5.3787 |
-3.9810 |
0.0000 |
Yes*** |
infor |
-6.8537 |
-2.4641 |
0.0069 |
Yes*** |
Note: *** denotes the significant at a 1% level.
3.3. Empirical Model and Method
Table 2 consists of the results of Levin-Lin-Chu unit root analysis, which was performed for panel data set to ensure the stationary properties of the variables used in the analysis. The results suggest that the Levin-Lin-Chu bias-adjusted t statistics for all variables are significant and leading to reject the null hypothesis that the variables contain a unit root, and concluded that all variables are stationary.
Thus, the empirical model for the analysis is specified as follows;
In the above empirical model, i and t denote country and time, respectively. lnfdi is the logarithm of foreign direct inflow whereas Πiltindicates the vector of l variableindices such as corruption perception index score, cpis and freedom from corruption, ffc. Other control variables ps, lnto and infor indicate political stability, the logarithm of trade openness and informal sector, respectively. λ and θindicate the country effect and the error term. As per the Hausman test which is performed to select consistent method among Fixed and Random effect methods, the Random effect method is firmed up for the data analysis. The test generally performed to compare the coefficients of the two methods in terms of correlations between error terms and explanatory variables.
4. RESULTS AND DISCUSSION
Table 3 shows the results of the Random Effect method. Two models such as model 1 and model 2 were estimated with the substitution of the two proxy variables for corruption with the control variables. According to the first estimation depicted by the Model 1, the variable corruption perception score is found to have a significant effect on FDI inflow at 1%, leading to conclude the there is a positive association between the trend of corruption perception score and the FDI inflows in the South Asian countries. According to the second estimation results shown under Model 2 where the variable freedom from the corruption is used as another proxy variable for the level of corruption is found to have a significant effect on FDI inflows at the 1% level, also suggest the positive association between the level of corruption and FDI inflows.
Table-3. Random Effect Results.
Model 1 |
Model 2 |
|||
Variables |
Coefficient |
Z-value |
Coefficient |
Z-value |
cpis |
0.8589*** (0.000) |
4.45 |
||
ffc |
0.8047*** |
4.00 |
||
ps |
1.3366*** (0.000) |
5.63 |
1.2745*** (0.000) |
5.10 |
lnto |
1.8458*** (0.004) |
2.90 |
||
infor |
0.0068 (0.865) |
0.17 |
||
Constant |
-1.1348 (0.697) |
-0.39 |
5.8691 |
2.90 |
Prob>chi2 |
0.000 |
0.000 |
||
Wald chi2(3) |
50.22 |
38.31 |
||
Note: *** denotes the significant at a 1% level and p-values are shown in parentheses.
All these results assist to conclude that there is a circumstance that foreign direct investment inflows improve as because of the perceptions of the degree of corruption considered by the analysts and business people move towards a high score. Thus, it can be concluded that the corruption level had been in South Asian counties served as ‘sand’ in the wheels of FDI or functions as ‘grabbing hands’. Therefore, the corruption level has been an obstructing factor of FDI flows to the South Asian countries, but crawling towards clean status develops a chance in the countries to attract more FDI inflows. The results derived from this study consistent with the findings of Woo and Heo (2009![]() ); Quazi (2014
); Quazi (2014![]() ); Sha (2018
); Sha (2018![]() ).
).
5. CONCLUSION
The objective of this study was to investigate whether the corruption serves as ‘grease’ or ‘sand’ in the wheels of Foreign Direct Investment inflow in South Asian Countries, namely Sri Lanka, India, Pakistan, Nepal, and Bangladesh during the period from 2002 to 2018. Random Effect model with annual balanced panel time series data was employed for the data analysis. The results derived from the analysis suggest that there is a positive association between foreign direct investment inflow and improvement in corruption indices leading to conclude that improvement in the perception on the corruption towards clean facilitates the foreign direct investment inflow in these countries. Thus, it is concluded that the level of corruption in South Asian countries serves as ‘sand’ in the wheels impeding the FDI inflow and further reduction at the level of corruption would facilitate more FDI flow in these countries.
Funding: This study received no specific financial support. |
Competing Interests: The author declares that there are no conflicts of interests regarding the publication of this paper. |
REFERENCES
Anderson, B. B. (2015). Corruption activities and economic development. World Journal of Entrepreneurship, Management and Sustainable Development, 11(01), 64-70.
Barassi, M. R., & Zhou, Y. (2012). The effect of corruption on FDI: A parametric and non-parametric analysis. European Journal of Political Economy, 28(3), 302-312. Available at: https://doi.org/10.1016/j.ejpoleco.2012.01.001.
Bellos, S., & Subasat, T. (2011). Corruption and foreign direct investment: A panel gravity model approach. Bulletin of Economic Research, 0307-3378.
Brada, J. C., Drabek, Z., & Perez, M. F. (2012). The effect of home‐country and host-country corruption on foreign direct investment. Review of Development Economics, 16(4), 640-663. Available at: https://doi.org/10.1111/rode.12009.
Burböck, B., Macek, A., Podhovnik, E., & Zirgoi, C. (2018). Asymmetric influence of corruption distance on FDI. Journal of Financial Crime, 25(3), 845-858. Available at: https://doi.org/10.1108/jfc-09-2017-0078.
Castro, C., & Nunes, P. (2013). Does corruption inhibit foreign direct investment? Política. Revista de Ciencia Política, 51(1), 61-83. Available at: https://doi.org/10.5354/0716-1077.2013.27418.
Cuervo-Cazurra, A. (2006). Who cares about corruption? Journal of International Business Studies, 37(6), 807-822. Available at: https://doi.org/10.1057/palgrave.jibs.8400223.
Cuervo-Cazurra, A. (2008). Better the devil you don't know: Types of corruption and FDI in transition economies. Journal of International Management, 14(1), 12-27. Available at: https://doi.org/10.1016/j.intman.2007.02.003.
Egger, P., & Winner, H. (2006). How corruption influences foreign direct investment: A panel data study. Economic Development and Cultural Change, 54(2), 459-486. Available at: https://doi.org/10.1086/497010.
Freckleton, M., Wright, A., & Craigwell, R. (2012). Economic growth, foreign direct investment and corruption in developed and developing countries. Journal of Economic Studies, 39(6), 639-652. Available at: https://doi.org/10.1108/01443581211274593.
Fredriksson, P. G., List, J. A., & Millimet, D. L. (2003). Bureaucratic corruption, environmental policy and inbound US FDI: Theory and evidence. Journal of Public Economics, 87(7-8), 1407-1430. Available at: https://doi.org/10.1016/s0047-2727(02)00016-6.
Godinez, J., & Garita, M. (2015). Corruption and foreign direct investment: A study of Guatemala. Advances in International Management, 28, 297-326. Available at: https://doi.org/10.1108/s1571-502720150000028014.
Gupta, K., & Ahmed, S. (2018). Determinants of FDI in South Asia: does corruption matter? International Journal of Economics and Business Research, 16(2), 137-161. Available at: https://doi.org/10.1504/ijebr.2018.094009.
Habib, M., & Zurawicki, L. (2002). Corruption and foreign direct investment. Journal of International Business Studies, 33(2), 291-307.
Hakkala, K., Pehr-Johan, N., & Svaleryd, H. (2005). Asymmetric effects of corruption on FDI: Evidence from Swedish multinational firms. Working Paper No.641, The Research Institute of Industrial Economics.
Ketkar, K. W., Murtuza, A., & Ketkar, S. L. (2005). Impact of corruption on freign direct investment and tax revenue. Journal of Public Budgeting, Accounting and Financial Management, 17(3), 313-341.
Kholdy, S., & Sohrabian, A. (2008). Foreign direct investment, financial markets, and political corruption. Journal of Economic Studies, 35(6), 486-500.
Kouneva-Loewenthal, N., & Vojvodic, G. (2012). Corruption and its effect on foreign direct investment in the energy sector of emerging and developing economies, Van Tulder, R., Verbeke, A. and Voinea, L. (Ed.) New Policy Challenges for European Multinationals (Progress in International Business Research (Vol. 7, pp. 339-363). Bingley: Emerald Group Publishing Limited.
Lambsdorff, J. G. (2003). How corruption affects persistent capital flows. Economics of Governance, 4(3), 229-243. Available at: https://doi.org/10.1007/s10101-002-0060-0.
Luu, H. N., Nguyen, N. M., Ho, H. H., & Nam, V. H. (2018). The effect of corruption on FDI and its modes of entry. Journal of Financial Economic Policy, 11(2), 232-250. Available at: https://doi.org/10.1108/jfep-05-2018-0075.
Malito, D. V. (2014). Measuring corruption indicators and indices (pp. 1-25). EUI Working Paper RSCAS 2014/3.
Mudambi, R., Navarra, P., & Delios, A. (2012). Government regulation, corruption, and FDI. Asia Pacific Journal of Management, 30(2), 487-511. Available at: https://doi.org/10.1007/s10490-012-9311-y.
Quazi, R. M. (2014). Corruption and foreign direct investment in East Asia and South Asia: An econometric study. International Journal of Economics and Financial Issues, 4(02), 231-242.
Rashid, S. (1981). Public utilities in egalitarian LDC's: The role of bribery in achieving pareto efficiency. Kyklos, 34(3), 448-460. Available at: https://doi.org/10.1111/j.1467-6435.1981.tb01199.x.
Ravi, S. P. (2015). Does corruption in a country affect the foreign direct investment? A study of rising economic super powers China and India. Open Journal of Social Sciences, 3(7), 99-104. Available at: https://doi.org/10.4236/jss.2015.37017.
Sha, M. H. (2018). Corruption and foreign direct investment: The case of South Asia. Humanities and Social Science, 25(01), 1-16.
Teles, V. K. (2007). Institutional quality and endogenous economic growth. Journal of Economic Studies, 34(1), 29-41. Available at: https://doi.org/10.1108/01443580710717200.
Woo, J.-Y., & Heo, U. (2009). Corruption and foreign direct investment attractiveness in Asia. Asian Politics & Policy, 1(2), 223-238. Available at: https://doi.org/10.1111/j.1943-0787.2009.01113.x.
Wu, S.-Y. (2006). Corruption and cross-border investment by multinational firms. Journal of Comparative Economics, 34(4), 839-856. Available at: https://doi.org/10.5353/th_b4515114.
Views and opinions expressed in this article are the views and opinions of the author(s), Asian Development Policy Review shall not be responsible or answerable for any loss, damage or liability etc. caused in relation to/arising out of the use of the content. |