


DETERMINANTS OF MARKET POWER IN ELECTRIC POWER MARKET OF RURAL AREAS IN NIGERIA

Physical Planning Department, Federal University, Oye Ekiti, Nigeria.
ABSTRACT
Electricity is central to socioeconomic growth and development of any economy. And, the electrical power sector of many economies has witnessed reforms in recent time, transforming into competitive and or oligopolistic market structure. In any case, energy pricing subsist as a challenge across the power value chain. This study focused identifying the determinants of market power of energy distributing operation and rural area consumers in the power retail market in Nigeria’s present oligopolistic power market structure. Adopting a production function model and econometric analysis of selected power sector time series variables between 2000-2017, the study discovered that electrical power generation, rural electricity access and energy consumption in Nigeria are essential determinants but do not ultimately and significantly determine market power of competing firms in the electric power market in Nigeria. It concluded that evidence of the importance of market power for competing firms in the electric power conduct in terms of energy pricing and cost decisions is auspicious considering their prevailing market challenges. The study therefore recommend amongst others recapitalization by energy distribution firms, exclusive regional or sub regional power chain structural transformation, efficient and effective energy supply, elicitation of market information/data for control, improvement, competition and researches in the sector while future research on market power in electrical power market is encourage on assumptions.
Keywords:Market power, Energy supply, Nigeria, Market structure, Rural areas.
JEL Classification: E3; Q4; R2, D43.
ARTICLE HISTORY: Received: 30 April 2020, Revised: 5 June 2020, Accepted: 8 July 2020, Published: 23 July 2020
Contribution/ Originality: This study adds to existing literature on energy market pricing and structure by using econometric estimation technique and originates a model. It is also adds to few investigations on the subject matter in Nigeria by logical analysis, finding and documentation of determinants of market power of electrical power market.
1. INTRODUCTION
With relatively 20 years of stable democratic political system out of 60years of political independence, a growing population of about 200million people (as at 2019) 75% of which are residing in the rural area communities (Adewunmi, 2014![]() ) over $395Bilion Gross Domestic Product(GDP) economic size, with about 330,000 square kilometers of arable land and huge natural resources (Chukwueyem et al., 2015
) over $395Bilion Gross Domestic Product(GDP) economic size, with about 330,000 square kilometers of arable land and huge natural resources (Chukwueyem et al., 2015![]() ), Nigeria is politically, economically, demographical and strategically very significant in western Africa sub-region, African continent and the whole of developing economies (Gimba & Ibrahim, 2018
), Nigeria is politically, economically, demographical and strategically very significant in western Africa sub-region, African continent and the whole of developing economies (Gimba & Ibrahim, 2018![]() ).
).
Nigeria’s energy (electrical power) sector financial commitment in the last 20years is huge, while the sector’s reforms witnessed liberalization of the state electrical power enterprise, creating an oligopolistic market structure using the Electric Power Sector Reform Act, 2005. Ideally, the reforms are to use the power sector to exert and influence socioeconomic growth and development across other sectors like human capital, trade, manufacturing, services etc. This is because the electricity supply is central and critical to economic objectives (Godinho & Eberhard, 2019![]() ) and energy consumption per capita scale has assumed modern development indicator in distinguishing developed and developing economies (Foster & Rana, 2020
) and energy consumption per capita scale has assumed modern development indicator in distinguishing developed and developing economies (Foster & Rana, 2020![]() ).
).
Unfortunately, Nwagwu (2014![]() ); National Bureau of Statistics (2016
); National Bureau of Statistics (2016![]() ); Onodugo, Obi, Anowor, Nwonye, and Ofoegbu (2017
); Onodugo, Obi, Anowor, Nwonye, and Ofoegbu (2017![]() ); Oginni (2018
); Oginni (2018![]() ); argued that factors contributing to human development menace in Nigeria’s poor economic outlook especially in rural areas are lack of and inadequacy of essential economic infrastructures especially electricity supply. The electrical power sector market mechanism experiences disequilibrium with demand measured in excess of 30,000MW, exceeding the average 4,200MW supply, though with 12,500MW installed capacity (Latham & Watkins, 2016
); argued that factors contributing to human development menace in Nigeria’s poor economic outlook especially in rural areas are lack of and inadequacy of essential economic infrastructures especially electricity supply. The electrical power sector market mechanism experiences disequilibrium with demand measured in excess of 30,000MW, exceeding the average 4,200MW supply, though with 12,500MW installed capacity (Latham & Watkins, 2016![]() ), inadequate power generation, transmission and poor energy distribution infrastructures. About 20million households are without energy supply and 46% or 83.98 million people (as at 2017) unconnected to the national grid (KPMG, 2019
), inadequate power generation, transmission and poor energy distribution infrastructures. About 20million households are without energy supply and 46% or 83.98 million people (as at 2017) unconnected to the national grid (KPMG, 2019![]() ; Onyekwena, Ishaku, & Akanonu, 2017
; Onyekwena, Ishaku, & Akanonu, 2017![]() ) with dismal impacts on general poor socioeconomic performances evident in rural-urban drift, high economic inequality, poverty, widespread self-power generation units (generators) for commercial and residential individuals etc. (Omoniyi, Jegede, & Omoniyi, 2017
) with dismal impacts on general poor socioeconomic performances evident in rural-urban drift, high economic inequality, poverty, widespread self-power generation units (generators) for commercial and residential individuals etc. (Omoniyi, Jegede, & Omoniyi, 2017![]() ).
).
Major efficiency and development constraint of the sector market are high technical loss, energy pricing (Tariff) and low collection efficiencies (International Energy Agency, 2012![]() ). Energy tariff is criticized to be market non cost reflective and cost recoverable (Nigerian Electricity Regulatory Commission (NERC), 2020
). Energy tariff is criticized to be market non cost reflective and cost recoverable (Nigerian Electricity Regulatory Commission (NERC), 2020![]() ) especially in the rural areas. Significant at that level is the apparent failure and weakness of energy distribution companies(DISCOs) on market power i.e. the ability of a firm or industry to maximize market profit and opportunities by influencing market mechanism (demand and supply) through market price of its product(s) in marketplace (market structure); and non-responsiveness of the electric power market, as a system where electrical power and hence energy are transacted or exchanged in financial and services swap, to market power.
) especially in the rural areas. Significant at that level is the apparent failure and weakness of energy distribution companies(DISCOs) on market power i.e. the ability of a firm or industry to maximize market profit and opportunities by influencing market mechanism (demand and supply) through market price of its product(s) in marketplace (market structure); and non-responsiveness of the electric power market, as a system where electrical power and hence energy are transacted or exchanged in financial and services swap, to market power.
While several studies had examined the development planning, finance, consumption, supply, sector reform etc., with respect to electric power sector and nexus with economic growth and development in Nigeria (Makwe, Akinwale, & Atoyebi, 2012![]() ; Ohwofasa, Obeh, & Erakpoweri, 2015
; Ohwofasa, Obeh, & Erakpoweri, 2015![]() ; Olamide, 2017
; Olamide, 2017![]() ; Onakoya, Onakoya, Jimi-Salami, & Odedairo, 2013
; Onakoya, Onakoya, Jimi-Salami, & Odedairo, 2013![]() ). Olaniyan, McLellan, Ogata, and Tezuka (2018
). Olaniyan, McLellan, Ogata, and Tezuka (2018![]() ) little has been reported on the market power and electrical power sector dynamics with specific nexus with rural areas in Nigeria’s competitive market economy. Consequently, this noticed gap is fundamental and has attracted this study especially with respect to providing answers to the questions of; what effects has competitive market structure on market power in Nigeria? What factors influence market power of energy supply in Nigeria? Does the electric power market explain the rural areas economy in Nigeria?
) little has been reported on the market power and electrical power sector dynamics with specific nexus with rural areas in Nigeria’s competitive market economy. Consequently, this noticed gap is fundamental and has attracted this study especially with respect to providing answers to the questions of; what effects has competitive market structure on market power in Nigeria? What factors influence market power of energy supply in Nigeria? Does the electric power market explain the rural areas economy in Nigeria?
This study therefore intends to investigate the determinants of market power of energy supply market in rural areas of Nigeria as a general objective but specifically examines the effects of and nature of relationship between market power, electrical power generation, electricity access, and energy consumption in Nigeria. It is postulated that energy consumption and power generation is major determinants but they have no significant effect on market power; there is no long run relationship between market power and energy consumption in Nigeria and that market power is not significant effect on rural electricity access in Nigeria. The essence of this study is on the heels of the great contribution of market power of firms via market mechanism and energy price (energy tariff) in a competitive market contribute to growth and development of rural areas economy and efficiency of the electric power sector.
The rest of this paper is organized as follows: the theoretical, conceptual and empirical review of related literature; next is the methodology and the discussion of findings, while the last section provides conclusion and policy recommendations.
2. REVIEW OF RELEVANT LITERATURE
2.1. Theoretical Review
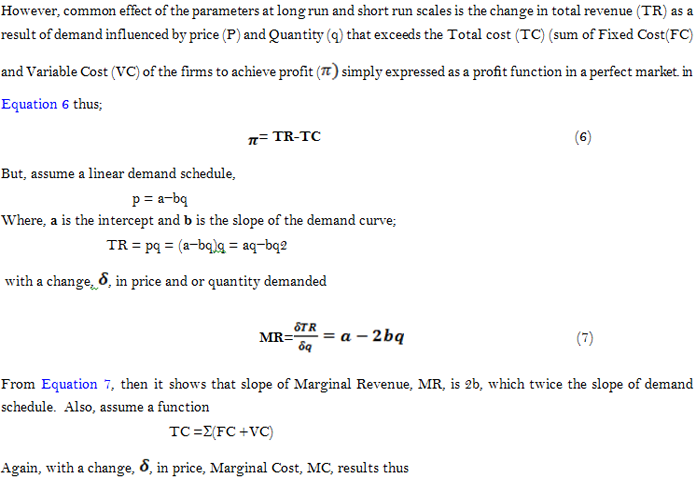
A competitive market structure is a microeconomic theory that explains structural market characteristics of producers, consumers, products nature and substitutes, information, pricing etc., in an industry (Jhingan, 2011![]() ). This study is based on oligopolistic competitive market structure as a classical thought that explains the dynamics of small number of producers of homogenous products (and services) in same market, which interplay and interrelate in competition for market efficiency of price and non-price factors in other to have market power and maximize profit under a strategic behavior. A typical structural model to explain this relationship and goal, assume first-order condition of firm’s profit maximization model thus;
). This study is based on oligopolistic competitive market structure as a classical thought that explains the dynamics of small number of producers of homogenous products (and services) in same market, which interplay and interrelate in competition for market efficiency of price and non-price factors in other to have market power and maximize profit under a strategic behavior. A typical structural model to explain this relationship and goal, assume first-order condition of firm’s profit maximization model thus;
π = P (Qt)-Mc(qt) + P(Qt) qt * Wt (1)
In Equation 1, π is profit, P(Qt) (i.e. price and quantity at given time) is inverse demand proxy by total revenue,Qtis the sum of industry output, qt is firm’s output in period, Mc(qt) is marginal cost of firm’s output, and Wt is strategic parameter employed to maximize profit,
P(Qt)-Mc(qt) + P(Qt) qt = 0 (2)
In perfect competition,as illustrated in Equation 2, Wt is always zero, because no need for strategic parameter to exert market power in the market hence price equals marginal cost of firm’s output as in Equation 3 below,
P(Qt) = Mc(qt) 0 (3)
or MR=MC shows the first-order condition of firm’s profit maximization where MR=total revenue. However, Funaki, Houba, and Motchenkova (2019![]() ) believes market power and therefore profit maximization in oligopolistic suffices except with a cartel system, mergers, rigid prices and other market strategic behaviors to create inelastic demand. From (1), when oligopoly regimes apply like facing a perfect cartel as a market strategic behavior of firms, afirm or industry degree of market power and hence profit maximization over a period t is measured by strategic parameter Wt which assumes N, where 0< Wt <N.
) believes market power and therefore profit maximization in oligopolistic suffices except with a cartel system, mergers, rigid prices and other market strategic behaviors to create inelastic demand. From (1), when oligopoly regimes apply like facing a perfect cartel as a market strategic behavior of firms, afirm or industry degree of market power and hence profit maximization over a period t is measured by strategic parameter Wt which assumes N, where 0< Wt <N.
π = P(Qt)-Mc(qt) + P(Qt) qt * Wt =0 (4)
Market mechanism of an oligopoly is a market price setting disequilibrium through market manipulation (in price, output, access, concentration and strategic behavior parameter) to induce effects (positive/negative) i.e. market power suffices once marginal cost is exceeded (Bose, Wu, Xu, Wierman, & Mohsenian-Rad, 2015![]() ). In an electric power market, the probable market manipulation is initiated, aided and amplified largely by inelastic nature of electricity consumption and demand, production capacity and supply shortage, and hard regulatory constraints on transmission (Turcik, Oleinikova, Junghans, & Kolcun, 2012
). In an electric power market, the probable market manipulation is initiated, aided and amplified largely by inelastic nature of electricity consumption and demand, production capacity and supply shortage, and hard regulatory constraints on transmission (Turcik, Oleinikova, Junghans, & Kolcun, 2012![]() ).
).
The liberalization of the erstwhile Nigerian state-owned electrical power enterprise natural vertical integrated monopoly is apparent (Nigerian Electricity Regulatory Commission (NERC), 2020![]() ) created an oligopoly market in the generation and distribution segments while the transmission segment is yet a state monopoly with the whole supply chain under state independent regulatory constraints (Foster, Witte, Banerjee, & Moreno, 2017
) created an oligopoly market in the generation and distribution segments while the transmission segment is yet a state monopoly with the whole supply chain under state independent regulatory constraints (Foster, Witte, Banerjee, & Moreno, 2017![]() ; Makwe et al., 2012
; Makwe et al., 2012![]() ). This regulatory constraints impedes any firm(s) to exercise market power on the energy pricing (Tariff) especially in energy supply segment.
). This regulatory constraints impedes any firm(s) to exercise market power on the energy pricing (Tariff) especially in energy supply segment.
However, critics of the theory avail that competition based on oligopolistic competitive market principles is not absolute in modern economic system especially in the developing countries, which are characterized by government interventions for effective allocation of scarce resources and protection of vulnerable people (Blimpo & Cosgrove-Davies, 2019![]() ; Kojima & Trimble, 2016
; Kojima & Trimble, 2016![]() ).
).
2.2. Conceptual Review
2.2.1. Overview of the Energy (Electrical Power) Sector and Power Market
The energy sector is large and critical for economic growth of any country. The sector comprises of Petroleum (crude oil), natural gas and electrical power subsectors aimed at providing energy commodities to progress other economic sectors (Chukwueyem et al., 2015![]() ). Figure 1 shows the flow chart of the sector and it’s linkage to the core of this study.
). Figure 1 shows the flow chart of the sector and it’s linkage to the core of this study.
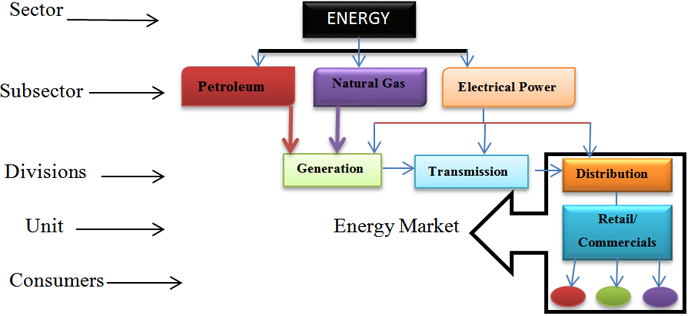
Figure-1. Energy Sector flow chart of the sector and its linkage.
From Figure 1, it explains that the electrical power subsector/industry of the energy sector entails the power generation, transmission and distribution distinctive arms/divisions in a supply chain, while recent industry restructuring/ reforms has created energy retail market (also known as commercial market) as a unit of the power distribution (Lionel, 2013![]() ).
).
Latham and Watkins (2016![]() ) noted that the existence and subsistence of the energy market is premised on the efficiency of the overall energy sector and particularly, electric power subsector. The petroleum and natural gas subsectors provide 81% of renewable fuel for power generation in Nigeria while the balance is believe to be from emerging non-renewable sources particularly solar (Usman, Abdullah, & Mohammed, 2019
) noted that the existence and subsistence of the energy market is premised on the efficiency of the overall energy sector and particularly, electric power subsector. The petroleum and natural gas subsectors provide 81% of renewable fuel for power generation in Nigeria while the balance is believe to be from emerging non-renewable sources particularly solar (Usman, Abdullah, & Mohammed, 2019![]() ).
).
Nigeria had had, yet continuing, her fair share of electrical power industry reform leading to the prevailing oligopolistic market structure (Nigerian Electricity Regulatory Commission (NERC), 2020![]() ). The reform model by way of partial privatization reveal four structural phases; regulation, restructuring, private sector participation and competition leading to emergence of 13 generation and 11 distribution companies in market competition, and other axillary system operator/participating organizations regulated by a statutory market operator. In effect, efficient scale of production competitive generation and distribution segments decreased due to technical progress information technology and innovations, thereby creating market competitiveness between producers and distributor firms for customers’ satisfaction.
). The reform model by way of partial privatization reveal four structural phases; regulation, restructuring, private sector participation and competition leading to emergence of 13 generation and 11 distribution companies in market competition, and other axillary system operator/participating organizations regulated by a statutory market operator. In effect, efficient scale of production competitive generation and distribution segments decreased due to technical progress information technology and innovations, thereby creating market competitiveness between producers and distributor firms for customers’ satisfaction.
2.2.2. Energy Pricing In a Competitive Market Structure
Actually, the crux of power industry reform is to optimize its potentials and enhance growth of the economy. This allows private participation and investment thereby straighten out energy pricing mechanism and its benefits to producers and consumers (Joseph, 2014![]() ). Energy pricing mechanism in power market subsists where producers profitably fulfill the needs and wants of consumers at willing and equilibrium price. Therefore, electrical energy as a non-tangible tradable commodity resonates around a number of dynamics, specific and unique characteristics: inelasticity of demand, complete interchangeability of input and output, market competitiveness (except state natural monopoly in some countries), no store of value, lack of product differentiation, technology driven, consumption imbalance, system incapacity (grids), distinctive global standard measures for production and consumption etc (Alao, 2016
). Energy pricing mechanism in power market subsists where producers profitably fulfill the needs and wants of consumers at willing and equilibrium price. Therefore, electrical energy as a non-tangible tradable commodity resonates around a number of dynamics, specific and unique characteristics: inelasticity of demand, complete interchangeability of input and output, market competitiveness (except state natural monopoly in some countries), no store of value, lack of product differentiation, technology driven, consumption imbalance, system incapacity (grids), distinctive global standard measures for production and consumption etc (Alao, 2016![]() ).
).
In view of these, the energy pricing mechanism involves fixed charge (capital costs recovery), energy charge (for variable costs recovery), demand charge (system applied load amount) and or marginal costs (Akinyemi, Alege, & Ajayi, 2017![]() ). Historically, energy tariff has been static, but just increased from 60kobo/KWh to N4./KWh between 1970 and 1990, and ranged between that and N6/KWh till 2010 prior to privatization of the sector. These are critical to cost reflective market based energy pricing and market decision making in the power supply chain.
). Historically, energy tariff has been static, but just increased from 60kobo/KWh to N4./KWh between 1970 and 1990, and ranged between that and N6/KWh till 2010 prior to privatization of the sector. These are critical to cost reflective market based energy pricing and market decision making in the power supply chain.
Distribution companies operators (DISCOs) in Nigeria appears to be more concerned on energy tariff. For example, Nigerian Electricity Regulatory Commission (NERC) (2020![]() ) created 4 parameters (consumer’s location, class of services, consumed quantity and rate) for DISCOs to determine and regulateenergy consumption Tariff Class.There are 5consumers’ classes (residential/commercial, industrial, street lighting, customers on special tariff, and International Customers) but about 60% unmetered residential customers has the total revenue share Nigerian Electricity Regulatory Commission (NERC) (2020
) created 4 parameters (consumer’s location, class of services, consumed quantity and rate) for DISCOs to determine and regulateenergy consumption Tariff Class.There are 5consumers’ classes (residential/commercial, industrial, street lighting, customers on special tariff, and International Customers) but about 60% unmetered residential customers has the total revenue share Nigerian Electricity Regulatory Commission (NERC) (2020![]() ). Recent reports by NERC indicate that electrical power is generated at total average cost (input) of N21.5/KWh, while when adjusted for transmission and distribution cost and losses, is expected for retail/commercial supply price (energy tariff optimum at N53KWh but being sold at N31.5KWh tariff amounting to net loss of about N22KWh as at 2020 as shown in Figure 1 below.
). Recent reports by NERC indicate that electrical power is generated at total average cost (input) of N21.5/KWh, while when adjusted for transmission and distribution cost and losses, is expected for retail/commercial supply price (energy tariff optimum at N53KWh but being sold at N31.5KWh tariff amounting to net loss of about N22KWh as at 2020 as shown in Figure 1 below.
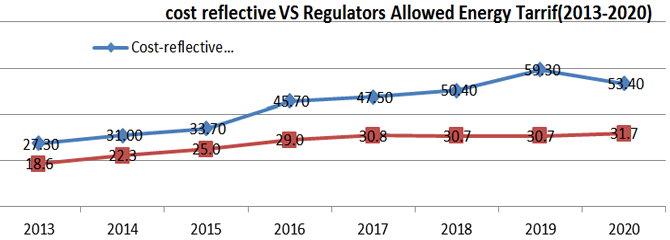
Figure-2. Trend of cost reflective tariffs vs allowed tariffs in Naira, 2013-2020.
Source: Nigerian Electricity Regulatory Commission (NERC) (2020![]() ).
).
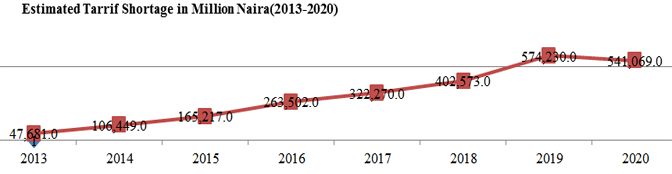
This trend of annually increasing net loss of estimated tariff shortfall in between 2013 and 2020.may cumulate to estimated N2,268,860,000trillion reflected in Figure 2 below if energy tariff is not increased, and it is believed to have deterred private investment and participation in the sector and hence inefficiency of services and supply to the consumers.
Source: Nigerian Electricity Regulatory Commission (NERC) (2020![]() ).
).
Conversely, the demand side is actually huge and almost inelastic with over 20million households without electric power supply and 55% un-accessed rate (KPMG, 2019![]() ). The apathy to tariff rise is due to regulatory constraint, power supply shortage, and inaccurate utility billing system, inefficient infrastructure and services, where consumers are relatively responsible for provision of distribution infrastructures inclusive of energy meters especially in the rural areas (Latham & Watkins, 2016
). The apathy to tariff rise is due to regulatory constraint, power supply shortage, and inaccurate utility billing system, inefficient infrastructure and services, where consumers are relatively responsible for provision of distribution infrastructures inclusive of energy meters especially in the rural areas (Latham & Watkins, 2016![]() ).
).
2.2.3. Electrical Power Supply in Nigeria Rural Areas
National Bureau of Statistics (NBS) and United Nations Children’s Fund (UNICEF) (2017![]() ) Multiple Indicator Cluster Survey 2016-17 puts Nigeria‘s rural and households population at 135 million and 28million respectively with about 85% living below the poverty line of one dollar per day. Rural electric power subsector is grossly not discoursed despite its dire need of energy supply –a potential power market space. Usman et al. (2019
) Multiple Indicator Cluster Survey 2016-17 puts Nigeria‘s rural and households population at 135 million and 28million respectively with about 85% living below the poverty line of one dollar per day. Rural electric power subsector is grossly not discoursed despite its dire need of energy supply –a potential power market space. Usman et al. (2019![]() ) argued that total electricity generated and distributed in Nigeria is positively weak and has no influence on general energy consumption of her rising population. This supports the earlier position of Chukwueyem et al. (2015
) argued that total electricity generated and distributed in Nigeria is positively weak and has no influence on general energy consumption of her rising population. This supports the earlier position of Chukwueyem et al. (2015![]() ) that population increase and quest for better standards of living drive increase in energy consumption hence long-run the impact on economic growth. The low supply average of 155 kWh annual per capita power consumption, which is below 183 kWh/year required for 2 hours of TV per day (Latham & Watkins, 2016
) that population increase and quest for better standards of living drive increase in energy consumption hence long-run the impact on economic growth. The low supply average of 155 kWh annual per capita power consumption, which is below 183 kWh/year required for 2 hours of TV per day (Latham & Watkins, 2016![]() ) in Nigeria is appalling.
) in Nigeria is appalling.
Efforts at closing this gap, the Rural Electrification Agency (REA) was set up to diversify from existing the 10,142 MW non-renewable and 2,380 MW renewable energy mix sources (Olaniyan et al., 2018![]() ). REA is dedicated to increasing electricity access in rural and underserved areas, considering non-renewable sources in a mini or off grid supply design, strongly supported by international development partners.
). REA is dedicated to increasing electricity access in rural and underserved areas, considering non-renewable sources in a mini or off grid supply design, strongly supported by international development partners.
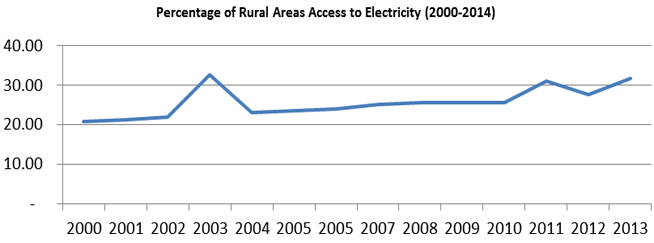
Figure-4. Percentage of Rural Areas Access to Electricity in Nigeria (2000-2014).
Source: Central Bank of Nigeria, 2015.
In result of this as shown in Figure 4, total rural population electricity access has improved from 27.9% in 2000, 34.9% in 2010 and 45% in 2019 while urban population access declined from 84%, 78% to 55%within same period due largely to incessant disruptions, overloading, obsolete infrastructures, and increase consumption demand (KPMG, 2019![]() ). Raza, Wasim, and Sarwar (2019
). Raza, Wasim, and Sarwar (2019![]() ) Pakistani study showed while that urban households energy consumption is higher, rural agriculture sector account for maximum income due to many factors.
) Pakistani study showed while that urban households energy consumption is higher, rural agriculture sector account for maximum income due to many factors.
2.2.4. Market Power Determinants in Competitive Power Market Structure
Reforms by way of liberalization throws up issues in the competitive market, key are market power. It is widespread in industries controlled by a few large firms that are market leaders through collusive conduct, exemplifying the behavioral exit from monopoly and perfect competition (Simpasa, 2010![]() ). Market power assumed a firm’s ability and capacity to maximize market profit and opportunities by influencing market mechanism (demand and supply) through market price increase of its product/service above the marginal costs in the market structure without losing its market share. Though market power can be determined by market concentration, Pivotal Supplier Index, Residual Supply Index, Turcik et al. (2012
). Market power assumed a firm’s ability and capacity to maximize market profit and opportunities by influencing market mechanism (demand and supply) through market price increase of its product/service above the marginal costs in the market structure without losing its market share. Though market power can be determined by market concentration, Pivotal Supplier Index, Residual Supply Index, Turcik et al. (2012![]() ) but the commonly used is Lerner’s index expressed thus;
) but the commonly used is Lerner’s index expressed thus;
Li =Pm-MCp , in which 0<L<1 (5)
Pm
In Equation 5, L= Lerner’s index Pm= market price and MCp= marginal costs of its product/service.
Several other market, business and macroeconomic parameters (market concentration, efficiency performance, meager and acquisition, product modification, regulatory intensity, location, climate etc.) that can influence the market price have also been subjected related to different industries (Simpasa, 2010![]() ). Specifically, Islyaev and Date (2015
). Specifically, Islyaev and Date (2015![]() ); Spodniak and Bertsch (2017
); Spodniak and Bertsch (2017![]() ) and advanced that parameters such as incentives of producers, power generated output, energy non-substitution, capacity improvement (infrastructures), non-storable nature of energy, weather characteristics, power transmission and distribution losses etc., subsist at the supply side; energy consumption per capita, energy pricing, energy demand, markets share (concentration), rural energy access, energy saving technology e.g. energy metering, demographic structure etc., on the demand side, while institutional and public policy, regulatory demands, market structure, strategic behaviors etc, are critical to making firms exercise market power.
) and advanced that parameters such as incentives of producers, power generated output, energy non-substitution, capacity improvement (infrastructures), non-storable nature of energy, weather characteristics, power transmission and distribution losses etc., subsist at the supply side; energy consumption per capita, energy pricing, energy demand, markets share (concentration), rural energy access, energy saving technology e.g. energy metering, demographic structure etc., on the demand side, while institutional and public policy, regulatory demands, market structure, strategic behaviors etc, are critical to making firms exercise market power.
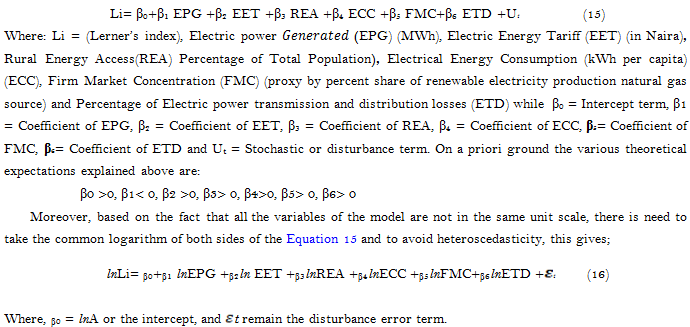
Hence, first order condition for profit maximization is that profit is maxima when MC = MR. Moreover, a conduct parameter say Wt applied on Equation 7 where 0< Wt,<0 over a time(t), then the firms will exercise market power. In practice, market power is vulnerable to abuse by firms not only on price for profit but also on fighting for dominance in market share, consumers’ surplus etc.
2.3. Empirical Review
Many narratives and studies on electric power sector, energy supply and pricing, market power and other variables may not be limited to Nigeria domestic economy. For example, Ou, Huang, and Yao (2016![]() ) studied Economic Impacts of Power Shortage in China and submitted that electricity industry is basic to the nation’s economy but has witnessed large-scale hard and soft power shortages with negative economic threats. Using CGE model and the Social Accounting Matrix (SAM) of eight sectors of China for simulating economic shocks and policy effects, the results show that the negative effects of power shortage on economic development are very significant and vary in different sectors specifically on administrative pricing system in China; concluded that low electricity price in the long term will lead to insufficient construction and hard power shortage hence recommended that power system reform is inevitable. Raza et al. (2019
) studied Economic Impacts of Power Shortage in China and submitted that electricity industry is basic to the nation’s economy but has witnessed large-scale hard and soft power shortages with negative economic threats. Using CGE model and the Social Accounting Matrix (SAM) of eight sectors of China for simulating economic shocks and policy effects, the results show that the negative effects of power shortage on economic development are very significant and vary in different sectors specifically on administrative pricing system in China; concluded that low electricity price in the long term will lead to insufficient construction and hard power shortage hence recommended that power system reform is inevitable. Raza et al. (2019![]() ) examined Development of Renewable Energy Technologies in rural areas of Pakistan, using solar, wind, biomass, and hydroelectricity. The study is exploratory based on Pakistanis rural areas clean energy public policies implementations potential; and the study result showed while that urban household’s energy consumption is higher, rural agriculture sector account for maximum income, thereby suggested public renewable energy projects in rural areas to boost socioeconomics growth and development.
) examined Development of Renewable Energy Technologies in rural areas of Pakistan, using solar, wind, biomass, and hydroelectricity. The study is exploratory based on Pakistanis rural areas clean energy public policies implementations potential; and the study result showed while that urban household’s energy consumption is higher, rural agriculture sector account for maximum income, thereby suggested public renewable energy projects in rural areas to boost socioeconomics growth and development.
In Nigeria’s experience, Makwe et al. (2012![]() ) examined the Economic Assessment of the Reform of Nigerian Electricity Market because of its high level of inefficiency. Using a Linear Programming optimization model via General Algebraic Modelling System (GAMS) to analyze the pre and post electricity sector reform, the study identified low energy tariff and transmission losses as main challenges to the market profitability and efficiency and therefore recommended upward review of energy prices and incentives to investors in other to benefit the Power sector reforms. To Ohwofasa et al. (2015
) examined the Economic Assessment of the Reform of Nigerian Electricity Market because of its high level of inefficiency. Using a Linear Programming optimization model via General Algebraic Modelling System (GAMS) to analyze the pre and post electricity sector reform, the study identified low energy tariff and transmission losses as main challenges to the market profitability and efficiency and therefore recommended upward review of energy prices and incentives to investors in other to benefit the Power sector reforms. To Ohwofasa et al. (2015![]() ) who studied the impact of electricity supply on economic growth in nigeria between 1980-2010 by using an error correction method applied variable such as per capita income, electricity consumption, government expenditure and investment etc, showed that there was no long run relationship between per capita income and the explanatory variables, thereby recommended a check on malpractices in the power sector.
) who studied the impact of electricity supply on economic growth in nigeria between 1980-2010 by using an error correction method applied variable such as per capita income, electricity consumption, government expenditure and investment etc, showed that there was no long run relationship between per capita income and the explanatory variables, thereby recommended a check on malpractices in the power sector.
Olaniyan et al. (2018![]() ) that investigated the Estimating Residential Electricity Consumption in Nigeria to Support Energy Transitions, by considering access, metering and consumption levels of energy and their determination and disparities patterns amongst in Nigeria household. Using primary and secondary data sources from ownership of electrical appliances and energy expenditure with online sales records of household appliances etc, the median residential electricity consumption was estimated at18–27kWh per capita but between the geographical zones and concluded that future electricity supply, installed generation capacity and estimated residential demand will be 85 TWh and recommended infrastructure investment in rural versus urban areas, the disaggregated, zone-by-zone and urban/rural data may offer more insight than a whole-of-country approach. Usman et al. (2019
) that investigated the Estimating Residential Electricity Consumption in Nigeria to Support Energy Transitions, by considering access, metering and consumption levels of energy and their determination and disparities patterns amongst in Nigeria household. Using primary and secondary data sources from ownership of electrical appliances and energy expenditure with online sales records of household appliances etc, the median residential electricity consumption was estimated at18–27kWh per capita but between the geographical zones and concluded that future electricity supply, installed generation capacity and estimated residential demand will be 85 TWh and recommended infrastructure investment in rural versus urban areas, the disaggregated, zone-by-zone and urban/rural data may offer more insight than a whole-of-country approach. Usman et al. (2019![]() ) studied Estimating Electricity Consumption in the Commercial Sector of Nigeria’s Economy by using time series data of seven identified notable variables temperature, rainfall, total electricity delivered, total primary energy and relative humidity over a period of 1990 to 2014. Adopting stepwise regression technique, study the huge influence of rainfall, total electricity generated, total primary energy and population on electricity consumption and suggested that the sector should be given considerable attention in formulating concrete energy policy and power plant design for sustainable energy supply.
) studied Estimating Electricity Consumption in the Commercial Sector of Nigeria’s Economy by using time series data of seven identified notable variables temperature, rainfall, total electricity delivered, total primary energy and relative humidity over a period of 1990 to 2014. Adopting stepwise regression technique, study the huge influence of rainfall, total electricity generated, total primary energy and population on electricity consumption and suggested that the sector should be given considerable attention in formulating concrete energy policy and power plant design for sustainable energy supply.
All the studies reviewed focused on power outage, energy shortage, Estimating Electricity Consumption, power sector Reform, power supply etc., in Nigeria and their relationship between and with economic growth using various estimation techniques. To the best of knowledge, no study has focus on the market power concept in Nigeria’s power sector. Market power is an emerging issue in the power sector globally with pioneering studies across economies. This study intends to fill this gap by initiating the market power concept in the distribution division (energy supply market) of the whole power subsector in the Nigeria’s energy economic sector.
3. METHODOLOGY
3.1. Theoretical Framework and Data Sources
In order to achieve the objectives of this study, plethora of related literature were qualitatively explored while the quantitative analysis adopted a production function model with the econometric model specification from the work of Ubi, Effiom, Okon, and Oduneka (2012![]() ) with modifications. The modification involves the derivative decomposition of the exogenous parametric variable as related to market power. The study framework is premised on Keynesian theory that emphasizes deliberate government interventions via liberalization and regulation to achieve and influence desired power industry objectives in the energy sector. For this study, Market Power is proxy by Lerner’s index (Li) as above refers, as the endogenous variable, Rural Energy Access(REA), Firm Market Concentration (FMC), Energy consumption(ECC)(Kilowatt/Hour(KWh) per capita), Electric Power Generated (EPG) Megawatts/hour(MWh), Electric Energy Tariff(in Naira) (EET), Electric Power Transmission and Distribution losses (ETD) etc. Time series secondary data obtained from African Development Bank Socioeconomic Data Base, World Bank energy database and Nigerian Electricity Regulatory Commission (NERC) spanning years 2000 – 2017 of partly pre and post power sector liberalization years were used in the study.
) with modifications. The modification involves the derivative decomposition of the exogenous parametric variable as related to market power. The study framework is premised on Keynesian theory that emphasizes deliberate government interventions via liberalization and regulation to achieve and influence desired power industry objectives in the energy sector. For this study, Market Power is proxy by Lerner’s index (Li) as above refers, as the endogenous variable, Rural Energy Access(REA), Firm Market Concentration (FMC), Energy consumption(ECC)(Kilowatt/Hour(KWh) per capita), Electric Power Generated (EPG) Megawatts/hour(MWh), Electric Energy Tariff(in Naira) (EET), Electric Power Transmission and Distribution losses (ETD) etc. Time series secondary data obtained from African Development Bank Socioeconomic Data Base, World Bank energy database and Nigerian Electricity Regulatory Commission (NERC) spanning years 2000 – 2017 of partly pre and post power sector liberalization years were used in the study.
4. EMPIRICAL MODEL SPECIFICATION
The endogenous model often specified for testing or explaining the effects of the dependent variable and independent variables is expressed in estimation equation or function. The linear function specified for the estimation in this study is:
Market Power = f (supply side , Demand side) (9)
But, Supply side = f (EPG, EET, REA) (10)
and, Demand side= f (ECC, FMC, ETD) (11)
Then, the overall function is mathematically expressed as follows;
Market Power (Li)= f(EPG+ EET+REA+ ECC+ FMC+ ETD) (12)
The set of variables in this study were used because of their conjectural strong influence and contribution to market power, as qualitatively discussed, in any electric power subsector of the economy.
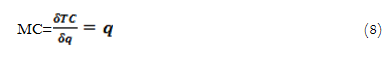
The dependent variable is Lerner Index (Li) and from Equation 5, the estimation of the Lerner Index (Li) requires knowledge of energy pricing (especially energy tariff). The mean of the summation of energy tariff charged by each firm was used to determine the industry energy tariff Pm.
Where, Electric Energy Tariff (EET) in Naira representing fixed and variable factors input prices and Electric Power Generated (EPG) in MWh as total quantity of energy supplied.
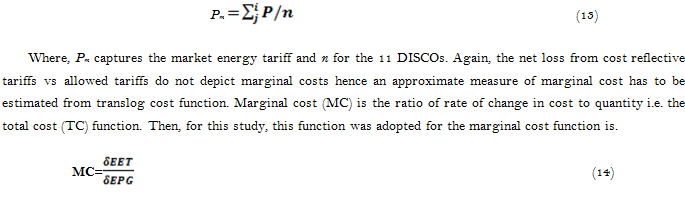
While other independent variables have been qualitatively explored with plethora of related literature, others like the Firm Market Concentration (FMC) was included as a theoretical rationale measure of greater influence of a firm’s price over the market price in the market structure. Though measure by using Hirschman-Herfindahl index (HHI) which is the sum of the squares of DISCOS’ market shares. However, for this study HHI will be proxy by share of renewable electricity production natural gas sources (% of total). Natural gas has assumed a huge and increasing power generation resources and supplied across Nigeria in recent time (Chukwueyem et al., 2015![]() ; KPMG, 2019
; KPMG, 2019![]() ). This function is further transformed into an econometric model as follows:
). This function is further transformed into an econometric model as follows:
4.1. Empirical Estimation Techniques
Descriptive Statistics: The descriptive statistics of the variables presented in Table 1 below shows that the mean values of Electric power 𝐺𝑒𝑛𝑒𝑟𝑎𝑡𝑒𝑑 (EPG), Electric Energy Tariff (EET), Rural Energy Access (REA), Electrical Energy Consumption (ECC), Electric power transmission and distribution losses (ETD) and Firm Market Concentration (FMC) are 2,402 MW, 11.98Naira/KWh, 26%,
27.6KWh/capita,20.83% and 59 points respectively within the same time period. The standard deviation estimate Electric power 𝐺𝑒𝑛𝑒𝑟𝑎𝑡𝑒𝑑 (EPG)(555), Electrical Energy Consumption(ECC)(25.4), were the most volatile among the variables, while Rural Energy Access(REA)(4) was the least volatile variable. The skewness statistics from the estimate reveal that Firm Market Concentration (FMC)(-1.686) Electrical Energy Consumption (ECC) (-0.840), Electric power 𝐺𝑒𝑛𝑒𝑟𝑎𝑡𝑒𝑑 (EPG)( -0.218958)were negatively skewed while Electric Energy Tariff (EET), Rural Energy Access (REA), Electric power transmission and distribution losses (ETD) were positively skewed. The result of Jarque-Bera statistic of variables are robust at Electric power 𝐺𝑒𝑛𝑒𝑟𝑎𝑡𝑒𝑑 (EPG)(0.87), Electric Energy Tariff (EET)(4.13), Rural Energy Access(REA)(1.44), Electrical Energy Consumption(ECC)(2.17), Electric power transmission and distribution losses (ETD)(1.94) and Firm Market Concentration (FMC)(16.09)
Table-1. Descriptive Statistics.
Parameters |
REA |
MP |
FMC |
ETD |
EPG |
EET |
ECC |
Mean |
26.21944 |
0.999850 |
59.06056 |
20.83556 |
2402.222 |
11.98333 |
127.6272 |
Std. Dev. |
4.029625 |
0.000837 |
6.047150 |
11.10192 |
555.2202 |
8.815214 |
25.47191 |
Skewness |
0.542133 |
0.388872 |
-1.686000 |
0.485650 |
-0.218958 |
1.164420 |
-0.840520 |
Kurtosis |
2.135508 |
3.609094 |
6.175398 |
1.717300 |
2.015023 |
2.704179 |
2.732182 |
Jarque-Bera |
1.442234 |
0.731912 |
16.09016 |
1.941557 |
0.871462 |
4.133255 |
2.173219 |
Probability |
0.486209 |
0.693533 |
0.000321 |
0.378788 |
0.646792 |
0.126612 |
0.337358 |
Unit Root Test: The study employed Augmented Dickey Fuller (ADF) and conducted unit root test on the series data to examine the data’s stationarity or otherwise in their different order of integration and critical value at least at 5% level to avoid the properties of stochastic error terms in a model that may lead time series in particular trend into spurious results. This was conducted by applying this model (17).
Δyt = µ+ɤyt-1 + Σ ᵦ Δyt-1+ et (17)
The result is as show on Table 2A/B below.
Table-2A. Augmented Dickey-Fuller (A.D.F.) Level 2000–2017.
Variable |
Intercept |
||||||
Level |
First difference |
Remark |
|||||
t-statistic |
P-Value |
t-statistic |
P-Value |
Stationarity |
H0 |
||
log(MP) |
-6.0570 |
0.0001 |
-4.6014 |
0.0040 |
Stationarity |
Accept |
|
log(EET) |
-0.2861 |
0.9072 |
-1.6098 |
0.4549 |
Stationarity |
Accept |
|
log(EPG) |
-1.1700 |
0.6617 |
-3.9598 |
0.0100 |
Stationarity |
Accept |
|
log(ECC) |
-2.0593 |
0.2615 |
-4.1539 |
0.0070 |
Stationarity |
Accept |
|
log(REA) |
-3.7983 |
0.0119 |
-4.3636 |
0.0047 |
Stationarity |
Accept |
|
log(FMC) |
-2.9344 |
0.0664 |
-1.3731 |
0.5620 |
Stationarity |
Accept |
|
log(ETD) |
-1.6748 |
0.4229 |
-5.3709 |
0.0011 |
Stationarity |
Accept |
|
Table-2B. Augmented Dickey-Fuller (A.D.F.) Level 2000–2017.
Variable |
Trend and intercept |
|||||
Level |
First difference |
Remark |
||||
t-statistic |
P-Value |
t-statistic |
P-Value |
Stationarity |
H0 |
|
log(MP) |
-5.5993 |
0.0024 |
-4.3099 |
0.0240 |
Stationarity |
Accept |
log(EET) |
-1.3392 |
0.8386 |
-2.1978 |
0.4591 |
Stationarity |
Accept |
log(EPG) |
-2.9965 |
0.1669 |
-3.8899 |
0.0404 |
Stationarity |
Accept |
log(ECC) |
-3.3726 |
0.0906 |
-4.3672 |
0.0183 |
Stationarity |
Accept |
log(REA) |
-4.9241 |
0.0058 |
-4.4576 |
0.0157 |
Stationarity |
Accept |
log(FMC) |
-2.3442 |
0.3874 |
-4.7586 |
0.0177 |
Stationarity |
Accept |
The unit root result revealed that all the variables are stationary at both level, I(0) and first difference I(1) with their test statistics taking absolute values lesser than their P- values at 5% and are not of same order of integration. Therefore, only the long run model was estimated due to the static nature of the variables, hence any shock to the series /system in the short run will quickly adjusts to the long run.
Ordinary Least Square Regression: Based on Equation 16 above, the model the goodness of fit estimate or coefficients of determination of R2 and other diagnosis of the variables were determined. Table 2 shows the test for t-statistics and coefficient of the variables and Durbin-Watson statistics which estimates the absence of autocorrelation in the model etc.
Table-3. Least squares regression.
| Dependent Variable: LOG(MP) Method: Least Squares Included observations: 18 |
||||
Variable |
Coefficient |
Std. Error |
t-Statistic |
Prob. |
C |
-0.001632 |
0.013372 |
-0.122050 |
0.9056 |
LOG(EPG) |
-0.007494 |
0.003880 |
-1.931673 |
NA |
LOG(EET) |
0.000928 |
0.000743 |
1.248652 |
0.2377 |
LOG(REA) |
0.000723 |
0.001761 |
0.410810 |
0.6891 |
LOG(ECC) |
0.006891 |
0.003719 |
1.853030 |
0.0909 |
LOG(FMC) |
0.004402 |
0.003443 |
1.278231 |
0.2275 |
LOG(ETD) |
0.001366 |
0.000805 |
1.696086 |
0.1180 |
S.E. of regression |
0.000874 |
Akaike info criterion |
-10.96265 |
|
Sum squared resid |
8.39E-06 |
Schwarz criterion |
-10.61639 |
|
Log likelihood |
105.6638 |
Hannan-Quinn criter. |
-10.91490 |
|
The coefficients of the log of all the variables show positive but and small values except that of Electric power 𝐺𝑒𝑛𝑒𝑟𝑎𝑡𝑒𝑑 (EPG) at (-0.0079) as indicated in Equation 18.
The t-statistics value of the log of all the variables Electric Energy Tariff (EET)(1.248), Rural Energy Access(REA)(0.4108), Electrical Energy Consumption(ECC)(1.8530), Firm Market Concentration (FMC)(1.2782) and Electric power transmission and distribution losses (ETD)(1.6960) are all positive except that of Electric power 𝐺𝑒𝑛𝑒𝑟𝑎𝑡𝑒𝑑 (EPG)(-1.9316) was found negative while the all the variables had positive probability value at 5% significance. The Durbin Watson value of the estimation was 2.42 which is far above the limit of 2.0 point.
5. DISCUSSION OF FINDING
The result of the descriptive statistic show illustrative in the power sector. For example, average of 11.98Naira/KWh paid on Electric Energy Tariff (EET) is indeed not cost reflective while average of 2,402 MW Electric power 𝐺𝑒𝑛𝑒𝑟𝑎𝑡𝑒𝑑 (EPG) is abysmally low to inform average 3.5% growth rate projected for the period. With the corresponding mean value, all the variables have positive skewness to the normal distribution. Kurtosis values for all the variables are less than 3, which is the normal value, except for Firm Market Concentration (FMC) ( 6.175) and MP(3.61), revealing that the degrees of flat height humpedness of the curves. Except for Firm Market Concentration (FMC) (16.09) which is greater than 5.99 point normality standard, the positive Jarque-Bera statistic values of rest the series variables show there is normality and hence do not reject the null hypotheses.
The Unit root estimate in effect indicates that all the variables have no long run relationship with one another. In other words, they jointly do not influence the change in market power in the long run. Specifically, energy consumption (ECC) (-3.3726), Electrical Power Generation (EPG) (-2.9965) and Rural Electricity Access (REA) (-4.9241) show strong negativity and indicate that there is no significant long run relationship market power in Nigeria. These satisfy the Null hypothesizes (Ho) that electrical power generation has no significant effect on market power; there is no long run relationship between market power and energy consumption and that market power is not significant effect on rural electricity access in Nigeria. Also, these align with Ohiare (2015![]() ); Nigerian Economic Summit Group (NESG) and Heinrich Böll Stiftung (2017
); Nigerian Economic Summit Group (NESG) and Heinrich Böll Stiftung (2017![]() ) that except there is adoption of appropriate energy pricing across the electrical power supply chain with consideration for effects of different cost structures on their short and long term viability there will not be a sustainable sector.
) that except there is adoption of appropriate energy pricing across the electrical power supply chain with consideration for effects of different cost structures on their short and long term viability there will not be a sustainable sector.
The regression analysis underscores good decisions from the study. The coefficients of the log of all the variables not only satisfies economic apriori but indicate that Electric power 𝐺𝑒𝑛𝑒𝑟𝑎𝑡𝑒𝑑 has been a huge challenge in Nigeria over the years with paltry 12,522Megawatts/hour to service about 200million Nigerians leading to average of 155 kWh annual per capita power consumption as at 2016 (Latham & Watkins, 2016![]() ) compared 50,000 MW in South Africa service approximately one quarter of Nigeria population. Again, the t-statistics value of the log of all the variables except that of EPG were fund positive. This implies that at 5% level, the explanatory variables are though generally not considered very statistically significant with respect to market power due to the very low positive t-values. Yet, energy consumption (ECC)(1.85) and Electric power transmission and distribution losses (ETD)(1.69) show some potentials to drive market power(MP).
) compared 50,000 MW in South Africa service approximately one quarter of Nigeria population. Again, the t-statistics value of the log of all the variables except that of EPG were fund positive. This implies that at 5% level, the explanatory variables are though generally not considered very statistically significant with respect to market power due to the very low positive t-values. Yet, energy consumption (ECC)(1.85) and Electric power transmission and distribution losses (ETD)(1.69) show some potentials to drive market power(MP).
The intuition behind these particular variables ability to exert market power lies in the conceptually need to recover cost losses from generated power supplied through transmission/ distribution infrastructure inadequacy and deficiencies via ensuring inelastic energy consumption by consumers through cost reflective tariff (Nigerian Electricity Regulatory Commission (NERC), 2020![]() ; Usman et al., 2019
; Usman et al., 2019![]() ). However, it may not be surprising that Electric power 𝐺𝑒𝑛𝑒𝑟𝑎𝑡𝑒𝑑 (EPG) (-193) shows negative relationship with and may not exert influence on market power because presently the about 12,500MW installed capacity power generation in Nigeria seldom evacuated but only leads to barely 4000MW being consumed (Latham & Watkins, 2016
). However, it may not be surprising that Electric power 𝐺𝑒𝑛𝑒𝑟𝑎𝑡𝑒𝑑 (EPG) (-193) shows negative relationship with and may not exert influence on market power because presently the about 12,500MW installed capacity power generation in Nigeria seldom evacuated but only leads to barely 4000MW being consumed (Latham & Watkins, 2016![]() ). The Durbin Watson value of 2.42 however shows there is presence of autocorrelation I.e. degree of similarity in observations of the same variable in the model. Actually this is obvious for example in the highly regulated energy tariff, which was historically and relatively statics at N6/KWh between year 2000 to 2010 prior to full privatization and slightly increased and varied N7.5KWh to N30/KWh between 2011 to 2017, but not cost reflective to the DISCOs.
). The Durbin Watson value of 2.42 however shows there is presence of autocorrelation I.e. degree of similarity in observations of the same variable in the model. Actually this is obvious for example in the highly regulated energy tariff, which was historically and relatively statics at N6/KWh between year 2000 to 2010 prior to full privatization and slightly increased and varied N7.5KWh to N30/KWh between 2011 to 2017, but not cost reflective to the DISCOs.
6. CONCLUSION AND POLICY RECOMMENDATION
This study investigated the determinants of market power in the electric power market with focus on energy supply market in rural areas of Nigeria. Considering the huge and diversified nature of electric power market with particular issues of reforms, nature of market structure and concept of market power in the power market with respect to energy pricing (tariff), the study reveal that electrical power generation, electricity access, and energy consumption in Nigeria are though essential to competing firms in the electric power market of an oligopolistic market structure in order to growth efficiency and control market share development especially in rural areas economy. However, same power market behaviors do not ultimately and significantly determine market power of competing firms in the electric power market in Nigeria. In summary, this study provides evidence on the important subject of market power of competing firms in the electric power conduct in terms of energy pricing and cost decisions.
Relaying on the conclusion, this study recommends that DISCOs must explore possibilities of strengthening the degree of competition through efficient services in order to enhance their market power. Power sector regulator (NERC) should create measures and policy incentives for enhancing competitiveness in the electric power sector. Market competition in energy pricing and greater energy access are necessary to differentiated market power opportunities. There is need for structural transformation of the Nigerian electrical power sector by creating exclusive regional or sub regional power chain of generator, transmission grid, distribution network and commercial/retail market in order to help build efficient and effective energy supply thereby elicit information/data for control, improvement, competition and researches in the sector. Regulatory body (NERC) must ensure that DISCOs’ recapitalize via the capital market after over ten years of privatization, in order to be financially robust for distribution infrastructure investment, competitive and efficient in the retail market.
Future research on market power in electrical power market could relax several assumptions made in this study and or explore other variables like each DISCO coverage area be treated as a power market in different market structures in terms of generation, distribution/supplier and consumption accommodation.
Funding: This study received no specific financial support. |
Competing Interests: The author declares that there are no conflicts of interests regarding the publication of this paper. |
REFERENCES
Adewunmi, D. O. (2014). Introduction to comparative economics, a textbook (1st ed., pp. 1-435). Lagos: Mill World Publication Limited.
Akinyemi, O., Alege, P. O., & Ajayi, O. (2017). Energy pricing policy and environmental quality in Nigeria: A dynamic computable general equilibrium approach. International Journal of Energy Economics and Policy, 7(1), 268-276.
Alao, A. A. (2016). Residential and industrial electricity consumption dynamics and economic growth in Nigeria 1980-2010. International Journal of Economy, Energy and Environment, 1(3), 55-69.
Blimpo, M. P., & Cosgrove-Davies, M. (2019). Electricity access in sub-Saharan Africa: uptake, reliability, and complementary factors for economic impact. Sfrica development forum series. World Bank.
Bose, S., Wu, C., Xu, Y., Wierman, A., & Mohsenian-Rad, H. (2015). A unifying market power measure for deregulated transmission-constrained electricity markets. IEEE Transactions on Power Systems, 30(5), 2338-2348.Available at: https://doi.org/10.1109/tpwrs.2014.2360216.
Chukwueyem, S., Adeniyi, O., Williams, J., Magnus, O., Peter, D., Margaret, J., & Emeka, R. (2015). Analysis of energy market conditions in Nigeria (pp. 1-80). Central Bank Of Nigeria. Occasional Paper No. 55.
Foster, V., & Rana, A. (2020). Rethinking power sector reform in the developing World. Sustainable Infrastructure Series. Washington, DC: World Bank.
Foster, V., Witte, S., Banerjee, S. G., & Moreno, A. (2017). Charting the diffusion of power sector reforms across the developing world.” Policy Research Working Paper No. 8235. Washington, DC: World Bank.
Funaki, Y., Houba, H., & Motchenkova, E. (2019). Market power in bilateral oligopoly markets with non-expandable infrastructures. International Journal of Game Theory.Available at: doi.org/10.1007/s00182-019-00695-.
Gimba, Z., & Ibrahim, S. G. (2018). China-Nigeria economic relation; The need for greater resource management for development. International Journal of Trend in Scientific Research and development, 2(3), 176-188.
Godinho, C., & Eberhard, A. (2019). Learning from power sector reform: The case of Kenya.” Policy Research Working Paper No. 8819. Washington, DC: World Bank.
International Energy Agency. (2012). Country energy statistics. Retrieved from https://www.iea.org/publications/freepublications/publication/IEA_Annual_Report_publicversion.pdf . [Accessed 4/3/2019].
Islyaev, S., & Date, P. (2015). Electricity futures price models: Calibration and forecasting. European Journal of Operational Research, 247(1), 144-154.Available at: https://doi.org/10.1016/j.ejor.2015.05.063.
Jhingan, M. L. (2011). The economics of development and planning (39th ed., pp. 1-457). Delhi: Vrinda Publications (P) Ltd.
Joseph, I. O. (2014). Issues and challenges in the privatized power sector in Nigeria. Journal of Sustainable Development Studies, 6(1), 161-174.
Kojima, M., & Trimble, C. (2016). Making power affordable for Africa and viable for its utilities. Washington,DC: WorldBank.
KPMG. (2019). Nigeria’s electricity supply industry highlights. Power Sector Watch Quarter 1, Edition, May, 1-3.
Latham, & Watkins. (2016). Nigerian power sector: Opportunities and challenges for investment in 2016 (pp. 1-15). Client Alert White Paper, No. 1930.
Lionel, E. (2013). The dynamic analysis of electricity supply and economic development: Lessons from Nigeria. Journal of Sustainable Society, 2(1), 1-11.
Makwe, J., Akinwale, Y., & Atoyebi, M. (2012). An economic assessment of the reform of Nigerian electricity market. Energy and Power, 2(3), 24-32.Available at: https://doi.org/10.5923/j.ep.20120203.01.
National Bureau of Statistics. (2016). Computation of human development Indices for the UNDP Nigeria Human Development Report. 1-535.
National Bureau of Statistics (NBS) and United Nations Children’s Fund (UNICEF). (2017). Multiple indicator cluster survey 2016-17, survey findings report (pp. 1-535). Abuja, Nigeria: National Bureau of Statistics and United Nations Children’s Fund.
Nigerian Economic Summit Group (NESG) and Heinrich Böll Stiftung. (2017). Comparison of Costs of Electricity Generation in Nigeria Report (pp. 1-34). Abuja.
Nigerian Electricity Regulatory Commission (NERC). (2020). Retrieved from: http://www.nercng.org/index.php/document-library/func-startdown/67/ . [Accessed 8/4/2020].
Nwagwu, E. J. (2014). Unemployment and poverty in Nigeria: A link to national insecurity. Global Journal of Politics and Law Research, 2(1), 19-35.
Oginni, O. C. (2018). Incidence of rural poverty in Ekiti State, Nigeria. International Journal of Social Science and Humanities Research, 6(3), 615-621.
Ohiare, S. (2015). Expanding electricity access to all in Nigeria: A spatial planning and cost analysis. Energy, Sustainability and Society, 5(1), 1-18.Available at: 10.1186/s13705-015-0037-9.
Ohwofasa, B. O., Obeh, H., & Erakpoweri, J. (2015). The impact of electricity supply on economic growth, 1980-2010: An error correction method. Research Journal of Finance and Accounting, 6(5), 124-129.
Olamide, E. V. (2017). Factors for poor performance of privatization of electricity service delivery in Ekiti State Nigeria. Unpublished Doctor of Philosophy (Urban and Regional Planning), Faculty of Built Environment Universiti Teknologi, Malaysia.
Olaniyan, K., McLellan, B. C., Ogata, S., & Tezuka, T. (2018). Estimating residential electricity consumption in Nigeria to support energy transitions. Sustainability, 10(1440), 1-22.
Omoniyi, B. B., Jegede, A. I., & Omoniyi, D. T. (2017). Poverty and Its consequences on the mortality rate in Nigeria. Review of Public Administration and Management, 6(11), 51-60.
Onakoya, A. B., Onakoya, A. O., Jimi-Salami, O. A., & Odedairo, B. O. (2013). Energy consumption and Nigerian economic growth: An empirical analysis. European Scientific Journal, 9(4), 25-40.
Onodugo, V. A., Obi, K. O., Anowor, O. F., Nwonye, N. G., & Ofoegbu, G. N. (2017). Does public spending affect unemployment in an emerging market. Risk Governance & Control: Financial Markets & Institutions, 7(1), 32-40.
Onyekwena, C., Ishaku, J., & Akanonu, C. P. (2017). Electrification in Nigeria: Challenges and way forward (pp. 1-32). Report of Centre for the Study of the Economies of Africa (CSEA) Abuja, Nigeria.
Ou, P., Huang, R., & Yao, X. (2016). Economic impacts of power shortage. Sustainability, 8(687), 1-21.Available at: 10.3390/su8070687.
Raza, M. Y., Wasim, M., & Sarwar, M. S. (2019). Development of renewable energy technologies in rural areas of Pakistan. Energy Sources, Part A: Recovery, Utilization, and Environmental Effects, 1-23.Available at: 10.1080/15567036.2019.1588428.
Simpasa, A. M. (2010). Characterising market power and its determinants in the Zambian banking indudstry (pp. 1-29). Munich Personal RePEc Archive. Paper No. 27232.
Spodniak, P., & Bertsch, V. (2017). Determinants of power spreads in electricity futures markets: A multinational analysis (pp. 1-32). ESRI Working Paper, No. 580, The Economic and Social Research Institute (ESRI), Dublin.
Turcik, M., Oleinikova, I., Junghans, G., & Kolcun, M. (2012). Methods for estimation of market power in electric power industry. Latvian Journal of Physics and Technical Sciences, 49(2), 14-23.Available at: https://doi.org/10.2478/v10047-012-0008-2.
Ubi, P. S., Effiom, L., Okon, E. O., & Oduneka, A. E. (2012). An econometric analysis of the determinants of electricity supply in Nigeria. International Journal of Business Administration, 3(4), 72-82.
Usman, O., Abdullah, M., & Mohammed, A. (2019). Estimating electricity consumption in the commercial sector of Nigeria’s economy. International Journal of Recent Technology and Engineering, 7(6S5), 1594- 1600.
Views and opinions expressed in this article are the views and opinions of the author(s), Asian Development Policy Review shall not be responsible or answerable for any loss, damage or liability etc. caused in relation to/arising out of the use of the content. |