


EMPIRICAL INVESTIGATION OF EXPORTS AND ECONOMIC GROWTH: EVIDENCE FROM SANE COUNTRIES, 1980-2016

1Department of Economics, Renaissance University Ugbawka, Enugu State, Nigeria.
2Department of Economics, University of Abuja, Abuja, Nigeria.
ABSTRACT
This study employed the Autoregressive Distributed Lag (ARDL) Bounds test technique to cointegration to investigate the relationship between exports and economic growth in SANE countries (South Africa, Algeria, Nigeria and Egypt) from 1980 to 2016. The results of the long-run relationship revealed that exports had a positive and insignificant relationship with economic growth in South Africa and Egypt. Nevertheless, exports had a positive and significant relationship with economic growth in Algeria and Nigeria. Furthermore, the causality results showed that while a uni-directional causality from exports to real GDP per capita growth rate exists for Nigeria and Egypt, a one-way causality runs from real GDP per capita growth rate to exports for South Africa. This indicates that an export-led growth (ELG) hypothesis is valid for Nigeria and Egypt. However, evidence of a growth-led export (GLE) hypothesis was found for South Africa. Nevertheless, no evidence of either an ELG hypothesis or GLE hypothesis was found for Algeria. The study, therefore, recommends that the Nigerian and Egyptian governments should continue with export-led development strategies, in order to sustain the export-led growth strategy, there is need for diversification of exports in South Africa and Algeria, the South African government should continue with growth-led development strategies, in order to sustain the growth-led export strategy, and the spate of political instabilities should be discouraged through democratic ideals with a view to attracting foreign investors in the export sector.
Keywords:Exports, Economic growth, ARDL, Toda and Yamamoto, Growth strategies, SANE countries.
JEL Classification:E2; E62; O11; O40.
ARTICLE HISTORY: Received: 12 September 2019, Revised: 14 October 2019, Accepted: 18 November 2019, Published: 24 December 2019
Contribution/ Originality: This study developed an evidence-based decision making for the adoption and implementation of an export-driven economic growth and development strategies in SANE countries through the direction of causality between the intervening variables. There is fundamental evidence of originality in the work; therefore, its authenticity, credibility and novelty are not in doubt.
1. INTRODUCTION
SANE (South Africa, Algeria, Nigeria, and Egypt) countries or Africa’s G4 have been labelled as Africa’s growth poles in terms of unravelling its capacities for economic prosperity. As observed by Michele and Michael (2010![]() ) out of the 54 African countries, the Africa’s G4 are seen as Africa’s best option of producing an economic bloc whose role in Africa will be similar to what BRIC (Brazil, Russia, India, and China) emerging markets are for the world economy. It is basically because of this that most economic indicators in the context of Africa are decomposed into two main economic groupings: the SANE and the rest of Africa (Oshikoya, 2007
) out of the 54 African countries, the Africa’s G4 are seen as Africa’s best option of producing an economic bloc whose role in Africa will be similar to what BRIC (Brazil, Russia, India, and China) emerging markets are for the world economy. It is basically because of this that most economic indicators in the context of Africa are decomposed into two main economic groupings: the SANE and the rest of Africa (Oshikoya, 2007![]() ). In the observation of Oshikoya (2007
). In the observation of Oshikoya (2007![]() ) and Kasekende et al. (2007
) and Kasekende et al. (2007![]() ) in terms of Africa's population and landmass, the SANE represent almost a third and a fifth, respectively (see Table 12 and Table 14 in the appendix). In addition, in terms of nominal and purchasing power parity, Table 12 and Table 13 showed that Africa's G4 accounts for a little more than half of the African continent's total Gross Domestic Product (GDP) (Anyanwu and Erhijakpor, 2009
) in terms of Africa's population and landmass, the SANE represent almost a third and a fifth, respectively (see Table 12 and Table 14 in the appendix). In addition, in terms of nominal and purchasing power parity, Table 12 and Table 13 showed that Africa's G4 accounts for a little more than half of the African continent's total Gross Domestic Product (GDP) (Anyanwu and Erhijakpor, 2009![]() ). Regardless of abundant natural resources endowment, countries in this group also share half of Africa's foreign reserves, trade balance, exports and foreign direct investment besides being coastal states with large market size (Oshikoya, 2007
). Regardless of abundant natural resources endowment, countries in this group also share half of Africa's foreign reserves, trade balance, exports and foreign direct investment besides being coastal states with large market size (Oshikoya, 2007![]() ).
).
The link between exports and economic growth has been a prevalent topic in the development economics literature and the subject of whether exports should be promoted to speed up economic growth, and hence, the export-led growth (ELG) hypothesis or whether economic growth should be encouraged for generation of exports, and thus, the growth-led export (GLE) hypothesis has been at the centre of an unending debate among policymakers, academics, development partners and researchers of international organizations. The experience and success stories of the ‘'Asian Tigers'' (Singapore, Taiwan, Hong-Kong, and South-Korea) and the remarkable economic growth and development that followed in the 1970s as a result of their ELG and import-led growth (ILG) models that resulted to their being dubbed ‘'economic miracles'' after appellation as Newly Industrialized Countries (NICs) motivated the developing countries, specifically those in the region of Sub-Saharan African, to replicate these models. Since the 1990s and in the contention of World Bank (1995![]() ) nearly 20% of the GDP of the world is generated through exports. Since then, the critical role of exports in global economic integration cannot be overemphasized. Furthermore, with the integration of international markets, the degree of exports was expected to grow more.
) nearly 20% of the GDP of the world is generated through exports. Since then, the critical role of exports in global economic integration cannot be overemphasized. Furthermore, with the integration of international markets, the degree of exports was expected to grow more.
Exports have been viewed as a powerful engine of growth capable of raising the standards of living of people in societies, reducing poverty, reducing unemployment, boosting foreign exchange and by implication foreign exchange reserves, raising the competitive edge of firms, boosting the financial positions of firms, increasing the resource utilization levels of firms and raising the standards of technology utilized by firms. This study will help policymakers in SANE countries in determining whether to pursue a diverse economic growth and development agenda or continue with the ELG development agenda. One of the pillars on which the Sustainable Development Goals (SDGs) set by the United Nations in 2012 to guide the path of sustainable development in the world after 2015 was anchored is to reduce inequality within and among countries by 2030. The countries of the world are expected to boost their economic growth with a view to attaining the SDG goal above. Since the adoption and implementation of the outward-oriented economic growth and development strategy, the SANE countries have had varying results in attempts to boost their economies with some experiencing rapid GDP growth. However, the economic growth of others has declined over the years with mixed effects on their poverty reduction strategies thereby casting serious doubt on whether or not ELG and ILG inspire growth in Less Developed Countries (LDCs). Hence, if there is no acceleration in economic growth, SANE countries may not be able to attain this goal by 2030.
Regardless of the few empirical works of literature using similar analytical frameworks and vital theoretical advances in works devoted to SANE countries, to the best of our knowledge, no study has been conducted on exports and economic growth with evidence from SANE countries. Therefore, there are substantial controversies to be resolved regarding this subject to SANE countries. Hence, the topic is open for discussion any day. Consequently, we strongly believe that it will contribute to the existing literature on the nexus between exports and economic growth in regional economic blocs.
Despite the successive reforms initiated and implemented, there was no shift in dominance of crude oil in export composition occasioned by an increase in the share of crude oil exports in total exports. For instance, between 1960 and 1970, the economy was predominantly agrarian in structure as revealed by the composition of the Gross Domestic Product (GDP) by economic activity. The contributions of agriculture to GDP in these periods were 64.1 and 47.6 per cent respectively. In the mid-1970s, when petroleum became the major revenue earner, the share of agriculture to overall GDP plummeted, resulting in 33.6 per cent in 1981. The share of agriculture to GDP was 37.9 and 42.1 per cent respectively between 1990 and 2002 but from 2003 to 2010, it hovered around 41.0 per cent (Mordi et al., 2010![]() ). Crude oil exports accounted for about 93.0 per cent of total exports from 1970-1985 and increased to 96.0 per cent from 1986-1998. This is disturbing because, in the Prebish-Singer thesis, Prebisch (1950
). Crude oil exports accounted for about 93.0 per cent of total exports from 1970-1985 and increased to 96.0 per cent from 1986-1998. This is disturbing because, in the Prebish-Singer thesis, Prebisch (1950![]() ) and Singer (1950
) and Singer (1950![]() ) argued that any country that concentrates on exports of primary products will experience income volatility, decreasing growth rates and deteriorating terms of trade. In addition, as stated by Papageorgiou and Spatafora (2012
) argued that any country that concentrates on exports of primary products will experience income volatility, decreasing growth rates and deteriorating terms of trade. In addition, as stated by Papageorgiou and Spatafora (2012![]() ) less broad-based and sustainable growth may be the outcome of focusing on primary commodities sectors with limited scope for productivity growth and quality upgrading. However, the share of non-oil exports in total export declined from an average of 7.0 per cent from 1970-1985 to 4.0 per cent between 1986 and 1998 and dropped further to 2.4 per cent from 1999-2006. This development is disturbing sending very little hope of economic growth with export diversification as an engine.
) less broad-based and sustainable growth may be the outcome of focusing on primary commodities sectors with limited scope for productivity growth and quality upgrading. However, the share of non-oil exports in total export declined from an average of 7.0 per cent from 1970-1985 to 4.0 per cent between 1986 and 1998 and dropped further to 2.4 per cent from 1999-2006. This development is disturbing sending very little hope of economic growth with export diversification as an engine.
Previous studies on exports and economic growth have shown diverse results, with some providing evidence of a positive link between exports and economic growth Tyler (1981![]() ), Fosu (1990
), Fosu (1990![]() ) , Chenery (1979
) , Chenery (1979![]() ) , Krueger (1978
) , Krueger (1978![]() ) , Ram (1985
) , Ram (1985![]() ) , Kavoussi (1984
) , Kavoussi (1984![]() ) , Balassa (1978a
) , Balassa (1978a![]() ) , Balassa (1985
) , Balassa (1985![]() ) , Salvatore and Hatcher (1991
) , Salvatore and Hatcher (1991![]() ) , Langley (1968
) , Langley (1968![]() ) , Oladipo (1998
) , Oladipo (1998![]() ) , Fajana (1977
) , Fajana (1977![]() ) , Serletis (1992
) , Serletis (1992![]() ) , Ekpo and Egwaikhide (1994
) , Ekpo and Egwaikhide (1994![]() ) others revealed a negative relationship between exports and economic growth (Oladipo, 1998
) others revealed a negative relationship between exports and economic growth (Oladipo, 1998![]() ) a number of scholars (Afxentiou and Serletis, 1991b
) a number of scholars (Afxentiou and Serletis, 1991b![]() ; Henriques and Sadorsky, 1996
; Henriques and Sadorsky, 1996![]() ; Al-Yousif, 1999
; Al-Yousif, 1999![]() ; Duru, 2013
; Duru, 2013![]() ) found conflicting evidence of causality running from economic growth to exports, while others showed that there exists a bidirectional relationship between these variables (Dutt and Ghosh, 1994
) found conflicting evidence of causality running from economic growth to exports, while others showed that there exists a bidirectional relationship between these variables (Dutt and Ghosh, 1994![]() ; Thornton, 1997
; Thornton, 1997![]() ; Shan and Sun, 1998a
; Shan and Sun, 1998a![]() ) . However, some studies did not find much support for the ELG hypothesis (Kwan and Cotsomitis, 1990
) . However, some studies did not find much support for the ELG hypothesis (Kwan and Cotsomitis, 1990![]() ; Ahmad and Kwan, 1991
; Ahmad and Kwan, 1991![]() ; Oxley, 1993
; Oxley, 1993![]() ; Yaghmaian, 1994
; Yaghmaian, 1994![]() ) . Hence, the empirical literature is inconclusive and open for discussion.
) . Hence, the empirical literature is inconclusive and open for discussion.
The above scenarios, therefore, raise the research question: What is the impact of exports on economic growth in SANE countries? It is against this backdrop that this study intends to examine the link between exports and economic growth in SANE countries. The paper is organized as follows: Section 2 concentrates on literature review and theoretical framework. Section 3 describes the methodology. Section 4 dwells on data presentation, analysis, and discussions while section 5 will focus on conclusion and policy recommendations.
2. LITERATURE REVIEW AND THEORETICAL FRAMEWORK
2.1. Empirical Literature
There has been a plethora of literature over the years on the relationship between exports and economic growth. For instance, Okoh (2004![]() ) in their study employed the Vector Error Correction Model to delineate the long run relationship between growth in non-oil exports, growth in import of capital inputs and global integration, which was proxied by the index of openness. Their results revealed that global integration though positive was not significant in explaining the behaviour of non-oil exports in the long run as well as in the short run. Nevertheless, a positive connection was found between growth in import of capital inputs and the growth of non-oil exports. Abual-Foul (2004
) in their study employed the Vector Error Correction Model to delineate the long run relationship between growth in non-oil exports, growth in import of capital inputs and global integration, which was proxied by the index of openness. Their results revealed that global integration though positive was not significant in explaining the behaviour of non-oil exports in the long run as well as in the short run. Nevertheless, a positive connection was found between growth in import of capital inputs and the growth of non-oil exports. Abual-Foul (2004![]() ) employed the Vector autoregressive (VAR), Error Correction Modelling (ECM) and Granger causality test methodologies to investigate the validity of the export-led growth (ELG) hypothesis for Jordan for the period 1976 to 1997. The results revealed that exports had a positive impact on economic growth thereby validating the ELG hypothesis for Jordan.
) employed the Vector autoregressive (VAR), Error Correction Modelling (ECM) and Granger causality test methodologies to investigate the validity of the export-led growth (ELG) hypothesis for Jordan for the period 1976 to 1997. The results revealed that exports had a positive impact on economic growth thereby validating the ELG hypothesis for Jordan.
Abu-Qarn and Abu-Bader (2004![]() ) investigated empirically the relationship between export growth and economic growth for nine Middle East and North Africa (MENA) countries using time series techniques. They used the following time periods: 1963-1999 for Algeria, Egypt, Israel, and Morocco; 1976-1999 for Iran; 1976-1998 for Jordan; 1960-1991 for Sudan; 1963-1998 for Tunisia; and 1966-1996 for Turkey. When they considered total exports, the unidirectional causality runs from exports to GDP only in the case of Iran. Yet when they considered manufactured exports, the results support the ELG hypothesis. The results showed that not all exports contribute equally to the GDP. However, the results also support the importance of promoting manufactured exports to boost economic growth in MENA countries.
) investigated empirically the relationship between export growth and economic growth for nine Middle East and North Africa (MENA) countries using time series techniques. They used the following time periods: 1963-1999 for Algeria, Egypt, Israel, and Morocco; 1976-1999 for Iran; 1976-1998 for Jordan; 1960-1991 for Sudan; 1963-1998 for Tunisia; and 1966-1996 for Turkey. When they considered total exports, the unidirectional causality runs from exports to GDP only in the case of Iran. Yet when they considered manufactured exports, the results support the ELG hypothesis. The results showed that not all exports contribute equally to the GDP. However, the results also support the importance of promoting manufactured exports to boost economic growth in MENA countries.
Using Cointegration and Granger Causality tests, Abou-Sait (2005![]() ) investigated the export-led growth hypothesis for Egypt for the period 1977-2003. The cointegration test revealed that exports, imports and GDP were cointegrated and the results from Granger causality tests indicated that causality was running from exports to growth hence supporting the Export-led Growth (ELG) for Egypt. The impulse response functions analysis showed that shocks to exports lead to a significant response in GDP, which, in return, supports the ELG.
) investigated the export-led growth hypothesis for Egypt for the period 1977-2003. The cointegration test revealed that exports, imports and GDP were cointegrated and the results from Granger causality tests indicated that causality was running from exports to growth hence supporting the Export-led Growth (ELG) for Egypt. The impulse response functions analysis showed that shocks to exports lead to a significant response in GDP, which, in return, supports the ELG.
Musonda (2007![]() ) utilized Cointegration and ECM methodologies to investigate the validity of the ELG hypothesis for Zambia. Using annual time series data from 1970 to 2003, their results showed that the ELG hypothesis is valid for Zambia. A long-run relationship was also confirmed between exports and economic growth. Merza (2007
) utilized Cointegration and ECM methodologies to investigate the validity of the ELG hypothesis for Zambia. Using annual time series data from 1970 to 2003, their results showed that the ELG hypothesis is valid for Zambia. A long-run relationship was also confirmed between exports and economic growth. Merza (2007![]() ) investigated the validity of the export-led growth (ELG) hypothesis for Kuwait over the period 1970-2004. Applying a number of econometric techniques: unit root test, cointegration test, ECM, VAR, impulse response function (IRF), and Granger Causality test, they confirmed a bidirectional causality between oil-exports and economic growth and a uni-directional causality from non-oil exports to economic growth in Kuwait. In addition, they confirmed the existence of a long run relationship among oil export, non-oil export and economic growth in Kuwait.
) investigated the validity of the export-led growth (ELG) hypothesis for Kuwait over the period 1970-2004. Applying a number of econometric techniques: unit root test, cointegration test, ECM, VAR, impulse response function (IRF), and Granger Causality test, they confirmed a bidirectional causality between oil-exports and economic growth and a uni-directional causality from non-oil exports to economic growth in Kuwait. In addition, they confirmed the existence of a long run relationship among oil export, non-oil export and economic growth in Kuwait.
In a related study, Wong (2008![]() ) employed the Granger causality test methodology to investigate the importance of exports and domestic demand to economic growth in five Association of South East Asian Nations (ASEAN-5) of Thailand, the Philippines, Malaysia, Indonesia, and Singapore before Asia financial crisis of 1997- 1998. The results revealed evidence of bi-directional causality between exports and economic growth and between private consumption and economic growth. The link between investment and economic growth and also between government consumption and economic growth was less conclusive. Based on the lack of strong empirical evidence, there was no suggestion that the ELG strategy was the main cause of the Asia financial crisis.
) employed the Granger causality test methodology to investigate the importance of exports and domestic demand to economic growth in five Association of South East Asian Nations (ASEAN-5) of Thailand, the Philippines, Malaysia, Indonesia, and Singapore before Asia financial crisis of 1997- 1998. The results revealed evidence of bi-directional causality between exports and economic growth and between private consumption and economic growth. The link between investment and economic growth and also between government consumption and economic growth was less conclusive. Based on the lack of strong empirical evidence, there was no suggestion that the ELG strategy was the main cause of the Asia financial crisis.
Onayemi and Akintoye (2009![]() ) employed a Vector Error Correction Model over the period of 1986 to 2004 to find out to what extent Nigerian export promotion strategies have been effective in the diversification of the revenue base of the Nigerian economy away from crude oil as the main foreign exchange earner. The results revealed that non-oil exports, on the whole, have performed below expectations, thereby questioning the efficacy of the export promotion strategies in the Nigerian economy. The main revenue earner is crude oil and the economy has not been diversified away from it.
) employed a Vector Error Correction Model over the period of 1986 to 2004 to find out to what extent Nigerian export promotion strategies have been effective in the diversification of the revenue base of the Nigerian economy away from crude oil as the main foreign exchange earner. The results revealed that non-oil exports, on the whole, have performed below expectations, thereby questioning the efficacy of the export promotion strategies in the Nigerian economy. The main revenue earner is crude oil and the economy has not been diversified away from it.
Chimobi and Uche (2010![]() ) employed the Granger Causality and Cointegration test to examine the relationship between export, domestic demand and economic growth in Nigeria. The cointegration test showed that there is no long-run relationship between the variables. Causality runs from economic growth to both export and domestic demand whereas domestic demand proxied by government consumption was Granger caused by export. Onudugo et al. (2013
) employed the Granger Causality and Cointegration test to examine the relationship between export, domestic demand and economic growth in Nigeria. The cointegration test showed that there is no long-run relationship between the variables. Causality runs from economic growth to both export and domestic demand whereas domestic demand proxied by government consumption was Granger caused by export. Onudugo et al. (2013![]() ) adopted the Augmented Production Function (APF), employing the Endogenous Growth Model (EGM) to investigate the impact of non-oil exports on economic growth in Nigeria using data between 1981 and 2012. The results revealed a very weak and infinitesimal impact of non-oil export in influencing rate of change in the level of economic growth in Nigeria.
) adopted the Augmented Production Function (APF), employing the Endogenous Growth Model (EGM) to investigate the impact of non-oil exports on economic growth in Nigeria using data between 1981 and 2012. The results revealed a very weak and infinitesimal impact of non-oil export in influencing rate of change in the level of economic growth in Nigeria.
Jun (2013![]() ) employed Cointegration and ECM methodologies to examine the link between exports and economic growth in China by using data from 1978 to 2011. The results showed that there is a long-run relationship between exports and GDP. In addition, the results revealed that exports had a positive impact on economic growth. In Malawi, Nyasulu (2013
) employed Cointegration and ECM methodologies to examine the link between exports and economic growth in China by using data from 1978 to 2011. The results showed that there is a long-run relationship between exports and GDP. In addition, the results revealed that exports had a positive impact on economic growth. In Malawi, Nyasulu (2013![]() ) used data from 1970 to 2010 to examine the impact of exports and imports on economic growth. Employing the Ordinary Least Squares methodology on a neoclassical economic growth model comprising labour force, capital, imports, and exports as explanatory variables of analysis and GDP as a measure of economic growth for the study, they found that exports had a positive and statistically significant impact on economic growth in Malawi. Conversely, imports had a negative and insignificant effect on economic growth.
) used data from 1970 to 2010 to examine the impact of exports and imports on economic growth. Employing the Ordinary Least Squares methodology on a neoclassical economic growth model comprising labour force, capital, imports, and exports as explanatory variables of analysis and GDP as a measure of economic growth for the study, they found that exports had a positive and statistically significant impact on economic growth in Malawi. Conversely, imports had a negative and insignificant effect on economic growth.
Duru (2013![]() ) investigated the link between exports and economic growth in Nigeria over the period 1970-2013. Employing a number of econometric techniques: unit root test, cointegration test, ECM, VAR, impulse response function (IRF), and Granger Causality test, they confirmed that causality runs from economic growth to exports in Nigeria. In addition, the results revealed a uni-directional causality from economic growth to non-oil exports. Furthermore, a uni-directional causality runs from non-oil exports to oil-exports in Nigeria. However, no causality was established between economic growth and oil exports.
) investigated the link between exports and economic growth in Nigeria over the period 1970-2013. Employing a number of econometric techniques: unit root test, cointegration test, ECM, VAR, impulse response function (IRF), and Granger Causality test, they confirmed that causality runs from economic growth to exports in Nigeria. In addition, the results revealed a uni-directional causality from economic growth to non-oil exports. Furthermore, a uni-directional causality runs from non-oil exports to oil-exports in Nigeria. However, no causality was established between economic growth and oil exports.
Using Cointegration, Granger causality and Vector Error Correction Modelling techniques, Jibrilla (2014![]() ) in a related study investigated the export-led growth hypothesis for Nigeria using quarterly time series data from 1986 to 2013. The results showed no short-run causality from exports to economic growth. In addition, the results revealed that there was no empirical evidence in support of the export-led growth hypothesis in Nigeria. Kaberuka et al. (2014
) in a related study investigated the export-led growth hypothesis for Nigeria using quarterly time series data from 1986 to 2013. The results showed no short-run causality from exports to economic growth. In addition, the results revealed that there was no empirical evidence in support of the export-led growth hypothesis in Nigeria. Kaberuka et al. (2014![]() ) utilized the Cointegration and Error Correction Modelling methodologies to investigate the validity of the export-led growth under structural changes that took place in Uganda from 1960 to 2010 using annual time series data. The causal relationship between total labour force and exports was also tested in this study. The results revealed a uni-directional relationship from exports to economic growth in the long-run only in the post-trade liberalization period (1988-2010).
) utilized the Cointegration and Error Correction Modelling methodologies to investigate the validity of the export-led growth under structural changes that took place in Uganda from 1960 to 2010 using annual time series data. The causal relationship between total labour force and exports was also tested in this study. The results revealed a uni-directional relationship from exports to economic growth in the long-run only in the post-trade liberalization period (1988-2010).
In addition, the study showed that trade liberalization had a negative but insignificant effect on real GDP while causality runs from the total labour force to total exports in the post-trade liberalization era only. Furthermore, Forgha and Aquilas (2015![]() ) in another similar study investigated the link between timber exports and economic growth in Cameroon using time-series data from 1980 to 2014. The results from Cointegration and Error Correction Modelling techniques revealed that timber exports exerted a negative and insignificant impact on economic growth in the short-run. However, in the long-run, the results showed a positive and statistically significant relationship between timber exports and economic.
) in another similar study investigated the link between timber exports and economic growth in Cameroon using time-series data from 1980 to 2014. The results from Cointegration and Error Correction Modelling techniques revealed that timber exports exerted a negative and insignificant impact on economic growth in the short-run. However, in the long-run, the results showed a positive and statistically significant relationship between timber exports and economic.
On the same subject and employing the Cointegration and Error Correction Modelling methodologies, Lam (2016![]() ) investigated the causality between real exports of goods and services and real GDP of the ASEAN-4 countries of Thailand, Philippines, Indonesia and Malaysia. The results of the short-run dynamics showed a bi-directional causality between exports and output growth for Thailand, Philippines and Malaysia. However, a uni-directional causality runs from GDP growth to exports growth for Indonesia. On the other hand, the results of the long-run relationship revealed a bi-directional causality between exports and GDP growth for Malaysia and Thailand; a uni-directional causality from GDP growth to exports growth for Indonesia and an inverse relationship exists between these two variables for the Philippines. Utilizing the Bound Testing technique, Eboreime and Umoru (2016
) investigated the causality between real exports of goods and services and real GDP of the ASEAN-4 countries of Thailand, Philippines, Indonesia and Malaysia. The results of the short-run dynamics showed a bi-directional causality between exports and output growth for Thailand, Philippines and Malaysia. However, a uni-directional causality runs from GDP growth to exports growth for Indonesia. On the other hand, the results of the long-run relationship revealed a bi-directional causality between exports and GDP growth for Malaysia and Thailand; a uni-directional causality from GDP growth to exports growth for Indonesia and an inverse relationship exists between these two variables for the Philippines. Utilizing the Bound Testing technique, Eboreime and Umoru (2016![]() ) estimated Nigeria's exports competitiveness in the World market and concluded that Nigeria's exports are highly competitive in Canada, the United States and Japan but less competitive in the United Kingdom. The results further revealed that for Canada, Japan and the United States, exchange rate and the level of foreign income strongly influences Nigeria's exports.
) estimated Nigeria's exports competitiveness in the World market and concluded that Nigeria's exports are highly competitive in Canada, the United States and Japan but less competitive in the United Kingdom. The results further revealed that for Canada, Japan and the United States, exchange rate and the level of foreign income strongly influences Nigeria's exports.
Verter and Bečvářová (2016![]() ) utilized the Ordinary Least Squares, Granger causality, Impulse Response Function and Variance Decomposition techniques to examine the impact of agricultural exports on economic growth in Nigeria. Based on the OLS and Granger causality results, the hypothesis of agricultural exports-led economic growth was supported for Nigeria. However, the results revealed a negative relationship between the agricultural degree of openness and economic growth in Nigeria. The Impulse Response Function depicted an upward and downward shock from agricultural exports to economic growth. Furthermore, the results of the Variance Decomposition test revealed that a shock to agricultural exports can contribute to the oscillation in the variance of economic growth in the long run. Kromtit et al. (2017
) utilized the Ordinary Least Squares, Granger causality, Impulse Response Function and Variance Decomposition techniques to examine the impact of agricultural exports on economic growth in Nigeria. Based on the OLS and Granger causality results, the hypothesis of agricultural exports-led economic growth was supported for Nigeria. However, the results revealed a negative relationship between the agricultural degree of openness and economic growth in Nigeria. The Impulse Response Function depicted an upward and downward shock from agricultural exports to economic growth. Furthermore, the results of the Variance Decomposition test revealed that a shock to agricultural exports can contribute to the oscillation in the variance of economic growth in the long run. Kromtit et al. (2017![]() ) used the Auto-regressive distributed lag (ARDL) model to examine the link between non-oil exports and economic growth in Nigeria from 1985-2015. The results revealed a positive and significant relationship between non-oil exports and economic growth in Nigeria. Using annual time series data from 1980-2016 and the Engel Granger Model for cointegration methodology, Vincent (2017
) used the Auto-regressive distributed lag (ARDL) model to examine the link between non-oil exports and economic growth in Nigeria from 1985-2015. The results revealed a positive and significant relationship between non-oil exports and economic growth in Nigeria. Using annual time series data from 1980-2016 and the Engel Granger Model for cointegration methodology, Vincent (2017![]() ) in a related study investigated the association between non-oil exports and economic growth in Nigeria with a view to knowing whether they have been effective in diversifying the productive base of the Nigerian economy away from crude oil as the main source of foreign exchange. However, the results failed to support the assertion that non-oil exports drive economic growth in Nigeria.
) in a related study investigated the association between non-oil exports and economic growth in Nigeria with a view to knowing whether they have been effective in diversifying the productive base of the Nigerian economy away from crude oil as the main source of foreign exchange. However, the results failed to support the assertion that non-oil exports drive economic growth in Nigeria.
It is evident from the literature review above that while a plethora of empirical studies has been undertaken to investigate the link between exports and economic growth, the results have been mixed and inconclusive. A study on the relationship between exports and economic growth in SANE countries is sparse, has received limited attention and calls for further studies. These confer the justification for this study. This study contributes to the existing literature by exploring this relationship in the context of SANE countries.
2.2. Theoretical Framework
There are a plethora of theories underpinning trade that has thrived in development economics literature for the analysis of exports and economic growth. This ranges from the Harrod-Domar model, the two-gap model, the neoclassical growth model and the new growth model or the endogenous growth model, just to mention a few. The model predominantly employed by authors for examining the association between exports and economic growth is the new growth theory or the endogenous growth theory of Romer (1986![]() ), Lucas (1988
), Lucas (1988![]() ), Romer (1990
), Romer (1990![]() ), Grosman and Helpman (1991
), Grosman and Helpman (1991![]() ) and Barro and Sala-i-Martin (1995
) and Barro and Sala-i-Martin (1995![]() ). Despite the fact that these growth models differ in their transmission mechanisms for the trade-growth nexus, they are all in defence of the export-led growth (ELG) and import-led growth (ILG) hypotheses. Based on this, this study will adopt the new growth theory or the endogenous growth theory as a working theoretical framework.
). Despite the fact that these growth models differ in their transmission mechanisms for the trade-growth nexus, they are all in defence of the export-led growth (ELG) and import-led growth (ILG) hypotheses. Based on this, this study will adopt the new growth theory or the endogenous growth theory as a working theoretical framework.
The failure of the neoclassical growth theory to identify the reasons for the mammoth disparities in the levels of national income between developing and developed countries as corroborated by the occurrence of the Latin American debt crisis in the early 1980s led to the development of the new growth theory or the endogenous growth theory (Dasgupta, 1998![]() ). In the view of Dasgupta (1998
). In the view of Dasgupta (1998![]() ) the new growth model's emphasis on inputs of production exhibiting constant marginal returns to capital formation and productivity makes it different from the neo-classical growth model. However, the neoclassical growth theory assumes diminishing marginal returns to scale of the inputs to the level of output (Nyasulu, 2013
) the new growth model's emphasis on inputs of production exhibiting constant marginal returns to capital formation and productivity makes it different from the neo-classical growth model. However, the neoclassical growth theory assumes diminishing marginal returns to scale of the inputs to the level of output (Nyasulu, 2013![]() ). The new growth theory endogenises growth because of its contention that internal production processes are responsible for the increase in Gross Domestic Product (GDP). The new growth theory contends that the state of technology in an economy originates from transfers of capital between developed countries and Less-developed Countries (LDCs) (Todaro and Smith, 2009
). The new growth theory endogenises growth because of its contention that internal production processes are responsible for the increase in Gross Domestic Product (GDP). The new growth theory contends that the state of technology in an economy originates from transfers of capital between developed countries and Less-developed Countries (LDCs) (Todaro and Smith, 2009![]() ). On the other hand, the neo-classical growth theory assumes that technology is fixed (Lal, 1992
). On the other hand, the neo-classical growth theory assumes that technology is fixed (Lal, 1992![]() ).
).
Hence, the role of international trade (imports and exports) in the economy is manifested through these international capital movements (Nyasulu, 2013![]() ). Exports act as a channel for capital injections in the forms of technology and foreign direct investments from developed to developing countries thereby increasing the level of GDP in the latter. In the contention of the endogenous growth model, increased specialization in exported products might result from increased competition and economies of scale leading to higher economic growth occasioned by improvement in the level of skills and the level of productivity (Sleptsova, 2010
). Exports act as a channel for capital injections in the forms of technology and foreign direct investments from developed to developing countries thereby increasing the level of GDP in the latter. In the contention of the endogenous growth model, increased specialization in exported products might result from increased competition and economies of scale leading to higher economic growth occasioned by improvement in the level of skills and the level of productivity (Sleptsova, 2010![]() ). In addition, Chow (1987
). In addition, Chow (1987![]() ) noted that the expansion of exports might lead to industrial upgrading. The endogenous growth model stressed that more efficiency gains result from better management practices, learning-by-doing effects and access to technologies (see (Hart, 1983
) noted that the expansion of exports might lead to industrial upgrading. The endogenous growth model stressed that more efficiency gains result from better management practices, learning-by-doing effects and access to technologies (see (Hart, 1983![]() ; Krugman, 1987
; Krugman, 1987![]() ; Lucas, 1988
; Lucas, 1988![]() ; Romer, 1990
; Romer, 1990![]() )). In a related manner, Lal and Rajapatirana (1987
)). In a related manner, Lal and Rajapatirana (1987![]() ) opined that entrepreneurial activity might be enhanced by export-led growth (ELG) plan, which will benefit the developing economies of the world.
) opined that entrepreneurial activity might be enhanced by export-led growth (ELG) plan, which will benefit the developing economies of the world.
2.3. Overview of Exports in SANE Countries
2.3.1. Overview of Exports in South Africa
South African’s principal exports include gold, corn, metals, diamonds, platinum, ores, iron and steel, distillation products, machinery, equipment, electrical and electronic equipment, sugar, fruits, wool, and minerals. Regional and bilateral trade arrangements, which basically describe trade policy has been reformed in South Africa Economist Intelligence Unit (2014![]() ). The South African Reserve Bank is saddled with the responsibility of exchange controls. However, it assigns routine transactions to approved private-sector banks. This includes virtually all the larger domestic and foreign banks. Exchange controls were abolished as a result of the major steps taken by the government. However, some of the exchange controls remained in place. The government has made efforts to build trade ties with important emerging economies and will continue with it EIU (2014
). The South African Reserve Bank is saddled with the responsibility of exchange controls. However, it assigns routine transactions to approved private-sector banks. This includes virtually all the larger domestic and foreign banks. Exchange controls were abolished as a result of the major steps taken by the government. However, some of the exchange controls remained in place. The government has made efforts to build trade ties with important emerging economies and will continue with it EIU (2014![]() ). There are selected trade tariffs in place for the protection of vulnerable industries. Efforts towards Regional economic integration is expected to advance slowly in South Africa. The main export destinations of South Africa are China 12.7%, United States of America 7.2%, Japan 5.8% and Botswana 4.8%.
). There are selected trade tariffs in place for the protection of vulnerable industries. Efforts towards Regional economic integration is expected to advance slowly in South Africa. The main export destinations of South Africa are China 12.7%, United States of America 7.2%, Japan 5.8% and Botswana 4.8%.
As was observed by Cipamba (2013![]() ) the institution of market-oriented policies and import protection by the Apartheid government in the 1970s with a view to diversifying the export sector away from reliance on gold marked the first phase of trade reforms in South Africa. In the views of Rangasamy (2009
) the institution of market-oriented policies and import protection by the Apartheid government in the 1970s with a view to diversifying the export sector away from reliance on gold marked the first phase of trade reforms in South Africa. In the views of Rangasamy (2009![]() ) a tax allowance for marketing expenditures with export colouration proclaimed in 1972 was the initial direct form of export incentives. In order to ease the burden on exporters, subsidies on export and export incentive schemes were boosted afterwards throughout the late 1980s and early 1990s. The introduction of the General Export Incentive Scheme (GEIS) marked the initial demonstration of this laudable initiative. As was documented by Subramanian and Jonsson (2001
) a tax allowance for marketing expenditures with export colouration proclaimed in 1972 was the initial direct form of export incentives. In order to ease the burden on exporters, subsidies on export and export incentive schemes were boosted afterwards throughout the late 1980s and early 1990s. The introduction of the General Export Incentive Scheme (GEIS) marked the initial demonstration of this laudable initiative. As was documented by Subramanian and Jonsson (2001![]() ) and Cassim et al. (2004
) and Cassim et al. (2004![]() ) the major objective of GEIS was the provision of tax-free subsidy to exporters with a view to promoting higher value-added exports. A key change in policy took place as a result of a newly democratically elected government in 1994 leading to further strengthening of liberal trade policies.
) the major objective of GEIS was the provision of tax-free subsidy to exporters with a view to promoting higher value-added exports. A key change in policy took place as a result of a newly democratically elected government in 1994 leading to further strengthening of liberal trade policies.
This led to substantial liberalization of the South African trade regime. A major case is the declaration of a tariff liberalization program that went beyond its commitments to the World Trade Organization (WTO) in the Uruguay Round (Subramanian and Jonsson, 2001![]() ). As a result of the reappearance of South Africa on the global arena, various bilateral and regional trade agreements were also envisioned. Nevertheless, the planned employment of tariffs in line with current developments in the global trademarks the approach of the new government to trade policy. These events resulted to the inauguration of a strategic agenda for trade policy by the government in 2009 with a view to alleviating poverty, diversifying export production, boosting economic growth and creating employment through trade policies (Cipamba, 2013
). As a result of the reappearance of South Africa on the global arena, various bilateral and regional trade agreements were also envisioned. Nevertheless, the planned employment of tariffs in line with current developments in the global trademarks the approach of the new government to trade policy. These events resulted to the inauguration of a strategic agenda for trade policy by the government in 2009 with a view to alleviating poverty, diversifying export production, boosting economic growth and creating employment through trade policies (Cipamba, 2013![]() ). The application of identical tariff liberalization is not likely to lead to the attainment of these objectives. Consequently, a flexible and selective application of tariffs on sector by sector bases is necessary to guarantee that the economy does not dwell in the production and export of primary commodities for a long period of time (see Department of Trade and Industry (2009
). The application of identical tariff liberalization is not likely to lead to the attainment of these objectives. Consequently, a flexible and selective application of tariffs on sector by sector bases is necessary to guarantee that the economy does not dwell in the production and export of primary commodities for a long period of time (see Department of Trade and Industry (2009![]() )).
)).
The upsurge in trade expected after South Africa's trade liberalization did not materialize. However, the country experienced a sluggish growth rate of export over the past years (Angomoko, 2017![]() ). Regardless of significant reforms in South Africa, Mosikari and Sikwila (2013
). Regardless of significant reforms in South Africa, Mosikari and Sikwila (2013![]() ) observed that the average growth rate of export nose-dived from 6.2 per cent to 5.6 per cent since 1994. The export growth rate of 2002 corroborated the anticipation of the higher growth rate of export because of the expected recovery in the global economy (South African Revenue Services, 2002
) observed that the average growth rate of export nose-dived from 6.2 per cent to 5.6 per cent since 1994. The export growth rate of 2002 corroborated the anticipation of the higher growth rate of export because of the expected recovery in the global economy (South African Revenue Services, 2002![]() ). As a result of the global economic and financial crisis in the world, there was repression in the volume of goods and services export from 2008 to 2009 occasioned by a deceleration in international demand. The negative growth rate of export recorded in 2009 is an indication that the magnitude of the recession became more pronounced.
). As a result of the global economic and financial crisis in the world, there was repression in the volume of goods and services export from 2008 to 2009 occasioned by a deceleration in international demand. The negative growth rate of export recorded in 2009 is an indication that the magnitude of the recession became more pronounced.
As was opined by Angomoko (2017![]() ) the size of manufactured exports and mining exports declined as a result of lower investment spending in Europe and weaker demand respectively. Exports diminished more as a result of limited credit finance for the exporters. The growth rate of South African exports deteriorated in 2012 as a result of domestic and external factors. The weakening of foreign demand as a result of the global financial crisis and stoppage of production, principally in the mining sector (Department of Research and Information, 2013
) the size of manufactured exports and mining exports declined as a result of lower investment spending in Europe and weaker demand respectively. Exports diminished more as a result of limited credit finance for the exporters. The growth rate of South African exports deteriorated in 2012 as a result of domestic and external factors. The weakening of foreign demand as a result of the global financial crisis and stoppage of production, principally in the mining sector (Department of Research and Information, 2013![]() ). As opined by International Monetary Fund (2013
). As opined by International Monetary Fund (2013![]() ) an estimated 2 points drop in exports was recorded as a result of the mining strike. In the view of Angomoko (2017
) an estimated 2 points drop in exports was recorded as a result of the mining strike. In the view of Angomoko (2017![]() ) the overall growth of South Africa's export sector will be affected by any negative growth in the mining sector since the mining sector is the main constituent of its export sector. The attainment of robust economic growth and development in South Africa is subject to increase in the growth rate of exports. This is based on the premise that export industries are more productive than non-export industries (Brenton and Walkenhorst, 2010
) the overall growth of South Africa's export sector will be affected by any negative growth in the mining sector since the mining sector is the main constituent of its export sector. The attainment of robust economic growth and development in South Africa is subject to increase in the growth rate of exports. This is based on the premise that export industries are more productive than non-export industries (Brenton and Walkenhorst, 2010![]() ).
).
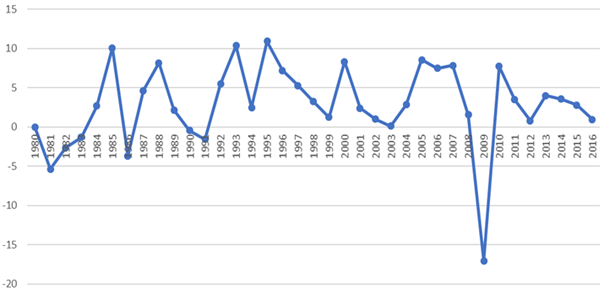
Figure-1. The growth rate of South Africa’s export 1980-2016.
Source: World Bank World Development Indicators (WDI) database.
The growth rate of export in South Africa from 1980-2016 is shown in Figure 1. The growth rate of South Africa's export is exemplified by high moments of leaps and bounds cycles. The growth rate of South African export exhibited a downward trend from 1980-1983. However, it displayed an upward trend from 1984 to 1985. With the exception of 1986, 1990 and 1991 that South Africa had negative growth rates of export, she had positive export growth rates throughout the rest of the 1986-1999 era. The reasons for the favourable performance of export during these periods were the boosting of subsidies on export and export incentive schemes, particularly the GEIS. In addition, further strengthening of liberal trade policies as a result of a major policy change embarked upon by the newly democratically elected government in 1994 contributed to the favourable performance of export during these periods. South Africa recorded a positive export growth rate from 2000 to 2008. However, the downward trend recorded in 2008 for export growth was as a result of a deceleration in international demand caused by the global economic and financial crisis. Negative growth rate of export was recorded in South Africa in 2009. This was attributable to the effects of the global economic and financial crisis. In addition, positive growth rates of export were recorded in South Africa from 2010 to 2016. Nevertheless, the growth rate of export deteriorated in 2012 as a result of the weakening of foreign demand occasioned by the global economic and financial crisis and stoppage of production in the mining sector.
2.3.2. Overview of Exports in Algeria
Oil and other fuels constitute the export products of Algeria. The natural resources in Algeria are iron ore, uranium, lead, zinc, petroleum and natural gas. Petroleum and natural gas exports are the mainstays of the Algerian economy. Library of Congress Federal Research Division (2008![]() ) stated that Algeria has 12.3 billion barrels of oil reserves. They have the eighth largest natural gas reserves in the world estimated at 161.7 trillion cubic feet (LCFRD, 2008
) stated that Algeria has 12.3 billion barrels of oil reserves. They have the eighth largest natural gas reserves in the world estimated at 161.7 trillion cubic feet (LCFRD, 2008![]() ). Their main export partners are France, Italy, Canada, Spain, Netherlands, Brazil and the United States. Over 95% of Algerian export earnings come from hydrocarbons. In the contention of Brika and Mekarssi (2016
). Their main export partners are France, Italy, Canada, Spain, Netherlands, Brazil and the United States. Over 95% of Algerian export earnings come from hydrocarbons. In the contention of Brika and Mekarssi (2016![]() ) the exports value was less than the imports value in the seventies as depicted by export/import coverage index of less than one.
) the exports value was less than the imports value in the seventies as depicted by export/import coverage index of less than one.
The coverage index increased to 1.06 and 1.17 respective during the 1974-1979 era. This improvement was as a result of the upsurge in export revenue occasioned by the first and second adjustments in the oil prices. When compared to the previous periods, higher values of the export/import index was recorded in the eighties. As a result of the decline in export revenues, an index value of 1.48 recorded in 1980 fell to 1.01 in 1982. The export/import coverage index surged once more to 1.07 and 1.15 for the 1983 and 1984 periods respectively. This increase in the index value was as a result of an increase in exports. Owing to a sudden drop in oil prices, the index dropped to 1.03 and 0.85 in 1985 and 1986 respectively. Due to the drop in oil prices to virtually half when compared with 1985, there was a remarkable reduction in exports.
However, the coverage index rose to 1.17 in 1987 and 1.11 in 1988 after this crisis. This increase was as a result of improvement in oil prices and non-oil exports. However, the coverage index dropped to 0.97 in 1989 as a result of the upsurge in the value of imports, particularly foodstuffs. Because of the reduction in oil exports, the coverage index fell from 1.58 in 1991 to 0.89 in 1993 during the era of 1990-2014 (Brika and Mekarssi, 2016![]() ). The coverage index slumped to 0.89 and 0.95 respectively for the 1994 and 1995 periods. The drop in oil exports revenue accounted for the drop in coverage index for these two years. Reduction in oil prices and the upsurge in the volume of imports were responsible for the decline in oil exports revenue. There was a significant improvement in the export/import coverage index to a value greater than one after 1995.
). The coverage index slumped to 0.89 and 0.95 respectively for the 1994 and 1995 periods. The drop in oil exports revenue accounted for the drop in coverage index for these two years. Reduction in oil prices and the upsurge in the volume of imports were responsible for the decline in oil exports revenue. There was a significant improvement in the export/import coverage index to a value greater than one after 1995.
However, the slump of 1998 was evident with a reduction in the coverage index from 1.47 in 1996 to 1.09 in 1998. This was caused by a major drop in oil prices from USD 25.52 per barrel in 1997 to USD 16.74 per barrel. This resulted in a 26.46% drop in exports amounting to USD 3676 million compared to 1997 (Brika and Mekarssi, 2016![]() ). The rise in the oil price to USD 35.5 per barrel in 2000 resulted in a substantial surplus in the balance of trade of about USD 12858 million with a very high coverage index value of 2.40. As a result of the reduction in the volume of oil exports and fluctuations in oil prices, the export/import coverage index slumped to 1.62 in 2001 and 1.57 in 2002. There was a substantial improvement in the coverage index to an average of 2.1 from 2003 to 2008. As a result of the reduction in exports, the export/import coverage index declined to 1.15 in 2009. Though, it rose to 1.41 in 2010. Due to higher imports and lower exports for 2011 and 2014 periods respectively, the coverage index nose-dived from 1.56 in 2011 to 1.01 in 2014.
). The rise in the oil price to USD 35.5 per barrel in 2000 resulted in a substantial surplus in the balance of trade of about USD 12858 million with a very high coverage index value of 2.40. As a result of the reduction in the volume of oil exports and fluctuations in oil prices, the export/import coverage index slumped to 1.62 in 2001 and 1.57 in 2002. There was a substantial improvement in the coverage index to an average of 2.1 from 2003 to 2008. As a result of the reduction in exports, the export/import coverage index declined to 1.15 in 2009. Though, it rose to 1.41 in 2010. Due to higher imports and lower exports for 2011 and 2014 periods respectively, the coverage index nose-dived from 1.56 in 2011 to 1.01 in 2014.
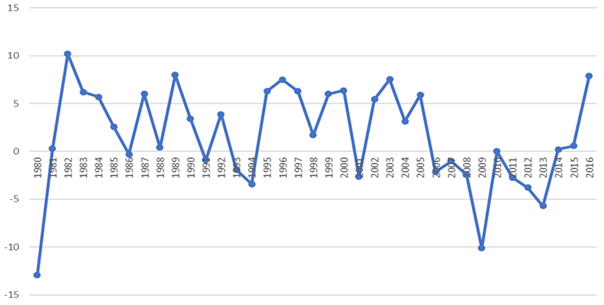
Figure-2. The growth rate of Algeria’s export 1980-2016.
Source: World Bank World Development Indicators (WDI) database.
Figure 2 depict the trends in the growth of Algeria’s export from 1980 to 2016. The growth rate of Algeria’s export is personified by high moments of leaps and bounds cycles. As can be seen from Figure 2 Algeria attained the highest rate of export growth in 1982. However, the lowest export growth rate was recorded in 1980.
2.3.3. Overview of Exports in Nigeria
The main exports commodities in Nigeria are oil and natural gas. The Nigerian economy depends heavily on these exports commodities as they account for over 91% of total exports. Nigeria's main export partners are Netherlands (20.5 per cent of total exports), India (18.2 per cent), Spain (8.3 per cent), the US (8.2 per cent) and France (6.3 per cent). From 1970 to 2005, Nigeria's share of the world's total export was less than 1 per cent on the average (in fact 0.53%). The country recorded this alarming figure despite the fact that it was one of the main oil producing and exporting countries in the globe. The export share of Nigeria in Less-developed Countries (LDCs) export revealed that she accounted for 1.62% mean value from 1970 to 2005 (Ekpo and Afangideh, 2009![]() ). It is worth noting that Nigeria's export share in LDCs and the world has been deteriorating ever since the 1980s. The plausible reasons for this were the monolithic nature of the Nigerian economy as the quota approved by the Organization of Petroleum Exporting Countries (OPEC) determines the demand for Nigeria's oil, and the crisis in Niger Delta region of Nigeria where agitations by militants have extremely hampered oil exploration activities (Ekpo and Afangideh, 2009
). It is worth noting that Nigeria's export share in LDCs and the world has been deteriorating ever since the 1980s. The plausible reasons for this were the monolithic nature of the Nigerian economy as the quota approved by the Organization of Petroleum Exporting Countries (OPEC) determines the demand for Nigeria's oil, and the crisis in Niger Delta region of Nigeria where agitations by militants have extremely hampered oil exploration activities (Ekpo and Afangideh, 2009![]() ).
).
The government introduced new trade policies and regularly reviewed the existing ones with a view to earning higher foreign exchange from the global market and improving the performance of exports. As opined by Sanni (2006![]() ) the main objective of Nigeria’s trade policy are: increase in domestic production through the use of local raw materials, protection of local industries against stiff competition, promotion of exports through formulation and implementation of sound export policies, attraction of foreign investment as well as enhancing the competitiveness of domestic products through the creation of conducive macroeconomic environment. In furtherance of this discussion on the general idea of Nigeria's exports, the policies that underpinned trade was divided into sub-periods of 1960 to 1985 and 1986 to date respectively. The specific episodes approximated by these periods in the annals of Nigeria history are the Pre-Adjustment era (the time before the introduction of Structural Adjustment Programme (SAP)) and the Post-adjustment era (the time after the SAP).
) the main objective of Nigeria’s trade policy are: increase in domestic production through the use of local raw materials, protection of local industries against stiff competition, promotion of exports through formulation and implementation of sound export policies, attraction of foreign investment as well as enhancing the competitiveness of domestic products through the creation of conducive macroeconomic environment. In furtherance of this discussion on the general idea of Nigeria's exports, the policies that underpinned trade was divided into sub-periods of 1960 to 1985 and 1986 to date respectively. The specific episodes approximated by these periods in the annals of Nigeria history are the Pre-Adjustment era (the time before the introduction of Structural Adjustment Programme (SAP)) and the Post-adjustment era (the time after the SAP).
During the Pre-SAP era (1960-1985), discriminatory tariff structure and harsh exchange control measures were adopted. This was informed by the Pre SAP policy objective of protecting the local industries against foreign competition. The institution of SAP in 1986 marked the beginning of foreign trade liberalization, deregulation of the foreign exchange market, the abolition of import licensing and the introduction of foreign currency Domiciliary Account Scheme (Sanni, 2006![]() ). The foreign currency Domiciliary Account Scheme was instituted to enable exporters to retain all repatriated foreign exchange proceeds in their domiciliary accounts. This will encourage more export activities through stress-free access to these funds. The SAP economic agenda was intended for the attainment of structural transformation and economic stability in Nigeria. As observed by Ojo (1998
). The foreign currency Domiciliary Account Scheme was instituted to enable exporters to retain all repatriated foreign exchange proceeds in their domiciliary accounts. This will encourage more export activities through stress-free access to these funds. The SAP economic agenda was intended for the attainment of structural transformation and economic stability in Nigeria. As observed by Ojo (1998![]() ) the SAP was meant to address the imbalances in the economy, stimulate the agricultural sector, remove over-dependence on the petroleum sub-sector, reduce dependence on imports, and boost non-oil exports for the transformation and stabilization of the economy. In addition, the strategy of economic policy that was in place during the SAP was for the correction of structural distortions in the economy and the creation of an environment conducive for steady growth and development.
) the SAP was meant to address the imbalances in the economy, stimulate the agricultural sector, remove over-dependence on the petroleum sub-sector, reduce dependence on imports, and boost non-oil exports for the transformation and stabilization of the economy. In addition, the strategy of economic policy that was in place during the SAP was for the correction of structural distortions in the economy and the creation of an environment conducive for steady growth and development.
During the Post-SAP era (1986 to date), and 1986 to be precise, the Second-tier-Foreign Exchange Market (SFEM) was instituted for exchange rate management and allocation of foreign exchange resources under a market-based system Sanni (2006![]() ). The abolishment of the Commodity Boards in the same period made it possible for exporters to market their products directly. A large number of incentives were given to export-oriented industries for export manufactures under Decree No.18 of 11th July 1986 and this ranges from export insurance to outright grant. To guarantee the efficacy of these incentives for export promotion, institutional backing was offered by the government through Nigerian Export Promotion Council (NEPC), the Nigerian Export-Import Bank (NEXIM), Nigerian Investment Promotion Commission (NIPC) and the Nigerian Export Processing Zone Authority (NEPZA). To spur the stable growth and development of export in Nigeria, boost production for export and to guarantee that export incentives are administered effectively, the NEPC was established in 1976. The NEXIM was inaugurated in 1991 as an export credit agency for improving the general growth of export. As observed by Ojo (1998
). The abolishment of the Commodity Boards in the same period made it possible for exporters to market their products directly. A large number of incentives were given to export-oriented industries for export manufactures under Decree No.18 of 11th July 1986 and this ranges from export insurance to outright grant. To guarantee the efficacy of these incentives for export promotion, institutional backing was offered by the government through Nigerian Export Promotion Council (NEPC), the Nigerian Export-Import Bank (NEXIM), Nigerian Investment Promotion Commission (NIPC) and the Nigerian Export Processing Zone Authority (NEPZA). To spur the stable growth and development of export in Nigeria, boost production for export and to guarantee that export incentives are administered effectively, the NEPC was established in 1976. The NEXIM was inaugurated in 1991 as an export credit agency for improving the general growth of export. As observed by Ojo (1998![]() ) NEXIM was required to provide finance to exporters both in local and foreign currencies and investment guarantee, credit guarantee insurance, and investment insurance of market risks such as price, exchange rate and interest rate risks were the forms of risk-bearing facilities meant to support exports. In order to promote exports and foreign investment in the country, the NIPC was instituted under Decree No.16 of 1995. The need to accelerate and boost exports led to the institution of the Export Processing Zone in Calabar in mid-1996.
) NEXIM was required to provide finance to exporters both in local and foreign currencies and investment guarantee, credit guarantee insurance, and investment insurance of market risks such as price, exchange rate and interest rate risks were the forms of risk-bearing facilities meant to support exports. In order to promote exports and foreign investment in the country, the NIPC was instituted under Decree No.16 of 1995. The need to accelerate and boost exports led to the institution of the Export Processing Zone in Calabar in mid-1996.
The NEPZA was established and charged with the responsibility of superintending the management of export processing zones in the country. To encourage the inflow of foreign investment capital in the productive sector with a view to boosting exports, the Enterprises Promotion Decree of 1977 was abolished. In addition, the government repealed the Exchange Control Act of 1962. The need to determine the naira exchange rate by market forces led to the introduction of the Foreign Exchange Market. It was also meant to guarantee the price competitiveness of goods produced locally and reduction in the outflow of foreign exchange. Hence, with the exception of 1994, the government introduced a market-determined exchange rate through monetary authority. As stated by Sanni (2006![]() ) to enhance the earnings from exports, new incentives were offered and the economy was deregulated in the 1990s. The Dutch Auction System (DAS) was instituted to realize a stable exchange rate for the naira and improve the competitiveness of the country’s exports. The institutional framework for administering the various policies meant to promote exports failed to realize the objective of diversification irrespective of the various measures meant to boost export in the country (Sanni, 2006
) to enhance the earnings from exports, new incentives were offered and the economy was deregulated in the 1990s. The Dutch Auction System (DAS) was instituted to realize a stable exchange rate for the naira and improve the competitiveness of the country’s exports. The institutional framework for administering the various policies meant to promote exports failed to realize the objective of diversification irrespective of the various measures meant to boost export in the country (Sanni, 2006![]() ).
).
Therefore, the lion's share of Nigeria's foreign exchange earnings originates from the oil sector. The portion of non-oil exports in the country's total exports is immaterial. The growth of the non-oil exports sub-sector has been severely obstructed by the non-diversification of the Nigerian economy. In the contention of Sanni (2006![]() ) from 1995 to 2001, the existing tariff regimes in the country were modified and streamlined to conform to the international best practices. The goal of trade policy in 1998 was to boost the deregulation of major sectors of the economy. In the contention of Thliza (2007
) from 1995 to 2001, the existing tariff regimes in the country were modified and streamlined to conform to the international best practices. The goal of trade policy in 1998 was to boost the deregulation of major sectors of the economy. In the contention of Thliza (2007![]() ) and under the subject of trade policy, the Federal Government proclaimed a ‘'Guided Privatization and Commercialization Policy'' and the government was to hold 40% equity share at the most in the privatized enterprises. The excise duties levied on goods produced locally were repealed. Outside the immediate trade policy regime of 1998, from 2003 to 2007, the Nigerian government employed a medium-term economic reform strategy termed the National Economic Empowerment Development Strategy (NEEDS). Through the diversity of reforms in the areas of privatization, deregulation, transparency and accountability, macroeconomic stability and liberalization, NEEDS was meant to raise the standard of living in the country. The NEEDS was also expected to diversify the economy and boost non-energy exports among other things. The State Economic Empowerment and Development Strategy (SEEDS) was an initiative linked to NEEDs at the state level.
) and under the subject of trade policy, the Federal Government proclaimed a ‘'Guided Privatization and Commercialization Policy'' and the government was to hold 40% equity share at the most in the privatized enterprises. The excise duties levied on goods produced locally were repealed. Outside the immediate trade policy regime of 1998, from 2003 to 2007, the Nigerian government employed a medium-term economic reform strategy termed the National Economic Empowerment Development Strategy (NEEDS). Through the diversity of reforms in the areas of privatization, deregulation, transparency and accountability, macroeconomic stability and liberalization, NEEDS was meant to raise the standard of living in the country. The NEEDS was also expected to diversify the economy and boost non-energy exports among other things. The State Economic Empowerment and Development Strategy (SEEDS) was an initiative linked to NEEDs at the state level.
The government introduced Nigeria's Vision 20:2020 (NV:2020), an economic transformation blueprint considered a long-term strategy for promoting the economic growth of Nigeria and launching the country unto a path of sustained and rapid socio-economic development. This eleven-year agenda spanning 2009-2020 was expected to be implemented through a series of the medium-term national development plans. The transformation from a mono-product economy to a diversified industrialized economy was one of the objectives of NV20:2020. The export sector of Nigeria was affected seriously through the contagion effect of the economic and financial upheaval faced by the world economy in 2008. This instability led to severe declines in the value of oil exports, the rapid depreciation of exchange rate, worsening of investor sentiments in the banking sector, fall in foreign direct investment and remittances (Ekpo and Afangideh, 2009![]() ). Trade policies were regularly reviewed by the government with a view to earning higher foreign exchange through improvement in the performance of exports in the global market.
). Trade policies were regularly reviewed by the government with a view to earning higher foreign exchange through improvement in the performance of exports in the global market.
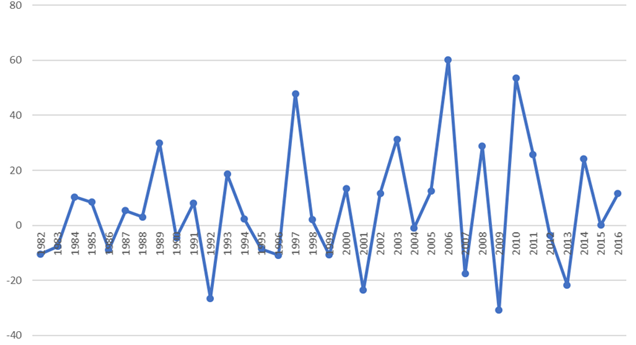
Figure-3. The Growth rate of Nigeria’s export 1980-2016.
Source: World Bank World Development Indicators (WDI) database.
Figure 3 depicts the trends in the growth rate of Nigeria’s export from 1982 to 2016. The growth rate of Nigeria’s export is typified by high moments of leaps and bounds cycles. A downward trend was exhibited by export in 1982 and 1983. During the structural adjustment period, roughly 1986-1997, export responded to economic adjustment policies and recorded positive growth for most of the years. However, export had negative growth rates in 1986, 1990, 1992, 1995 and 1996. The declining trend in export growth rate from 1998 to 2016 resulted from slow export diversification and a small share of non-oil exports to total exports. In addition, the global economic and financial crisis was responsible for the nose-diving of the export growth rate in 2007 and 2009 respectively. Nonetheless, the upward trend in the growth rate of exports for the period under review can be attributed to improvement in the international prices of crude oil, favourable macroeconomic environment, stable nominal and real exchange rates and increased investment in the oil sector.
2.3.4. Overview of Exports in Egypt
A quarter of the Egyptian GDP is accounted for by exports. Egyptian major exports are agricultural products, livestock and fats (11 per cent of total exports), textiles, especially cotton (10.5 per cent of total exports), chemical products (12 per cent of total exports), and oil and mineral products (32 percent of total exports) (Egypt Exports, 2019![]() ). Machinery and electrical appliances (4.5 per cent of total exports), base metals (5.5 per cent of total exports) and foodstuff, beverages and tobacco (4 per cent of total exports) constitute other export products. Their main export partners are the European countries (38 per cent of total exports and 31 per cent of total imports) and Arab countries (28 per cent of exports and 13.5 per cent of imports) constituting of France, Spain, Saudi Arabia, Italy, and Turkey (Egypt Exports, 2019
). Machinery and electrical appliances (4.5 per cent of total exports), base metals (5.5 per cent of total exports) and foodstuff, beverages and tobacco (4 per cent of total exports) constitute other export products. Their main export partners are the European countries (38 per cent of total exports and 31 per cent of total imports) and Arab countries (28 per cent of exports and 13.5 per cent of imports) constituting of France, Spain, Saudi Arabia, Italy, and Turkey (Egypt Exports, 2019![]() ). Others are Brazil, Argentina, United States, India and China. The macroeconomic trend in Egypt can be explained through seven eras (CIA World Fact Book, 2019
). Others are Brazil, Argentina, United States, India and China. The macroeconomic trend in Egypt can be explained through seven eras (CIA World Fact Book, 2019![]() ). During these eras, various stages of development were embarked upon in the economy. The 1952-1966 periods was the import substitution and nationalization era. It is worth noting that the first programme of industrialization in 1957 was established in this era with investment in heavy industries such as chemical and iron and steel industries (CIAWFB, 2019
). During these eras, various stages of development were embarked upon in the economy. The 1952-1966 periods was the import substitution and nationalization era. It is worth noting that the first programme of industrialization in 1957 was established in this era with investment in heavy industries such as chemical and iron and steel industries (CIAWFB, 2019![]() ).
).
The relevance of the private sector was affected by nationalization. There was a restriction on trade and foreign direct investments were practically banned. The 1967-1973 periods was the interwar era. During these periods, the role of the public sector in import substitution and the performance of the economy was badly affected. The 1974-1985 periods marked the openness euphoria era. This marked the period of trade liberalization and the introduction of policies that encouraged it and foreign investments through a series of incentives. The development of tourism and textile manufacturing industries was stressed as propellers of economic growth. There was an expansion in the economy which proved unsustainable leading to a decline in growth rate. The 1985-1990 periods was the era of the external debt crisis. The periods of 1991-2007 marked the economic reform era. This era saw the relaxation of price controls, reduction of subsidies, reduction of inflation, reduction of taxes, liberalization of trade and investment. The 2008-2011 periods were the Post Global Financial Crisis era while the Post-Revolution era was the 2012-2016 periods. The 2011 revolution resulted in a serious downturn that affected the Egyptian economy adversely. The restoration of growth, market and investor confidence was as a result of serious efforts by the government after many challenges faced by it (CIAWFB, 2019![]() ).
).
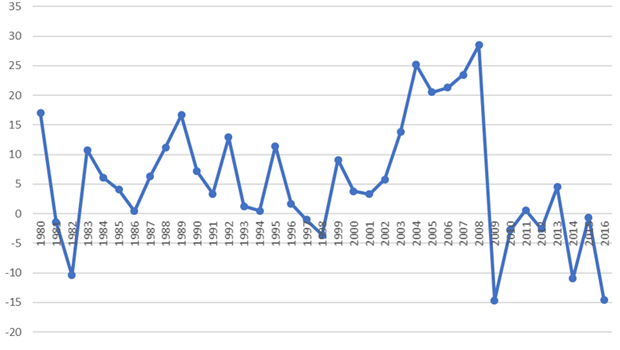
Figure-4. The Growth rate of Egypt’s export 1980-2016.
Source: World Bank World Development Indicators (WDI) database.
The growth rate of export in Egypt from 1980-2016 is shown in Figure 4. The growth rate of Egypt's export is epitomized by high moments of leaps and bounds cycles. The favourable performance of export recorded during the 1980-1985 period can be credited to trade liberalization and institution of policies that encouraged it and foreign investments through a series of incentives. Despite the fact that Egypt liberalized trade and introduced trade policies during the 1974-1985 period, regarded as the openness euphoria era, the export performance was unfavourable in 1981 and 1982. The economic reforms introduced during the 1991-2007 era such as reduction of subsidies, relaxation of price controls, reduction of inflation, reduction of taxes and liberalization of trade and investment accounted for the favourable export performance recorded during these periods. However, the growth rate of export was negative for 1997 and 1998. The declining trend in export growth rate from 2009 to 2011 can be attributed to the effects of the global economic and financial crisis. In addition, the 2011 revolution contributed to the nose-diving of the export growth rate in 2011. The effects of the 2011 revolution resulted in the downward trend in export growth in 2012, 2014, 2015 and 2016. However, export had positive growth rates in 2013. The plausible explanation for this could be the restoration of growth, market and investor confidence by the government.
3. METHODOLOGY
3.1. Sources of Data
This study used time series data from 1980 to 2016 (see Table 9, Table 10 and Table 11 in the appendices). The data needs were identified on the basis of the objectives of the study. The data for this study were derived from the World Bank's (WB), World Development Indicators (WDI) database and the African Development Bank's (AFDB) Socio-Economic Database. The choice of a thirty-six years period was informed by the intention to critically address the SANE economies specific dimension to the export-led growth debate. In addition, the choice of the period was informed by the developments in the SANE economy. The prevailing development agenda in many developing countries and especially countries in Africa, South Asia and Latin American in the 1950s, 1960s, and 1970s was the paradigm of Import Substitution Industrialization (ISI) and widespread use of restrictive trade policies for economic diversification (Samen, 2010![]() ). On the other hand, export-led growth and outward-oriented strategy were implemented in the post-1980 period, particularly in the 1980s, 1990s and early 2000s as a result of the success stories of exporting countries of the East Asian Tigers, India and China. Thus, 1980 can be regarded as a landmark in the annals of SANE economies trade policy. Hence, the period of export-led and outward-oriented strategy is covered by the scope of this study. The variable definitions, measures, apriori sign expectation and data source is depicted in Table 1.
). On the other hand, export-led growth and outward-oriented strategy were implemented in the post-1980 period, particularly in the 1980s, 1990s and early 2000s as a result of the success stories of exporting countries of the East Asian Tigers, India and China. Thus, 1980 can be regarded as a landmark in the annals of SANE economies trade policy. Hence, the period of export-led and outward-oriented strategy is covered by the scope of this study. The variable definitions, measures, apriori sign expectation and data source is depicted in Table 1.
Table-1. Variable definitions, measures, apriori sign expectation and data source.
| Variable | Description | Apriori sign expectation | Data source(s) |
| Dependent variable | |||
| GDP per capita growth rate | Annual percentage growth rate of GDP per capita (%) (Constant 2010 US$) | WB, WDI | |
| Independent variables | |||
| Imports of goods and services | Imports of goods and services (% of GDP) | Negative | WB, WDI |
| Exports of goods and services | Exports of goods and services (% of GDP) | Positive | WB, WDI |
3.2. Model Specification
This paper builds on Merza (2007![]() ) model which explains economic growth as a function of oil exports and non-oil exports. The strength of the model lies in the incorporation of at least three variables. This is because some scholars like Njikam (2003
) model which explains economic growth as a function of oil exports and non-oil exports. The strength of the model lies in the incorporation of at least three variables. This is because some scholars like Njikam (2003![]() ) argued that the use of bi-variate approaches (exports and GDP) is biased. The weakness of this model is the non-inclusion of labour and capital inputs and other variables that can significantly affect the economic growth of developing countries besides the three variables employed. For example, imports were unearthed by Riezman et al. (1996
) argued that the use of bi-variate approaches (exports and GDP) is biased. The weakness of this model is the non-inclusion of labour and capital inputs and other variables that can significantly affect the economic growth of developing countries besides the three variables employed. For example, imports were unearthed by Riezman et al. (1996![]() ) as one of the variables that affect economic growth. On the other hand, Henriques and Sadorsky (1996
) as one of the variables that affect economic growth. On the other hand, Henriques and Sadorsky (1996![]() ) established real exchange rates and others. However, this study added the aggregated value of exports of goods and services and imports of goods and services which may have a significant influence on export-economic growth nexus in SANE countries. Hence the model is specified in the linear regression form as:
) established real exchange rates and others. However, this study added the aggregated value of exports of goods and services and imports of goods and services which may have a significant influence on export-economic growth nexus in SANE countries. Hence the model is specified in the linear regression form as:
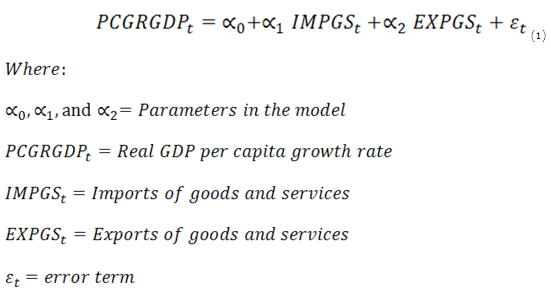
The Augmented Dickey-Fuller (ADF) and Phillips-Perron (PP) unit root tests were employed to check the time series properties of the data for stationarity before estimating the growth equation. Our specification was also subjected to diagnostic and stability tests to ascertain the goodness of fit and adequacy of our model. The autoregressive distributed lag (ARDL) bounds test to cointegration proposed first by Pesaran and Shin (1999![]() ) and advocated by Pesaran et al. (2001
) and advocated by Pesaran et al. (2001![]() ) were employed for the estimation of the growth equations. This is based on the premise that it shows the short-run and long-run dynamics of the variables for estimation. Version 9 of the E-views econometric software facilitated the computation of the above statistical techniques.
) were employed for the estimation of the growth equations. This is based on the premise that it shows the short-run and long-run dynamics of the variables for estimation. Version 9 of the E-views econometric software facilitated the computation of the above statistical techniques.
Restating Equation 1 as an ARDL model in line with the framework of Pesaran et al. (2001![]() ) we have:
) we have:
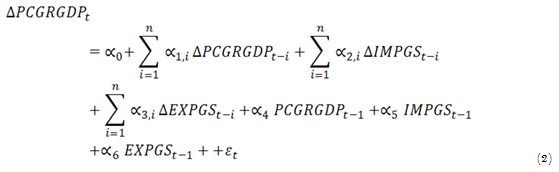
Where Δ denotes the difference operator, α0 is the drift component, Et is the error term, α1, α2, α3 are coefficients of short-run dynamics while α4, α5, α6 represent the long-run relationship. The trend characteristics were eliminated through differencing. The lag lengths for each of the variables is represented by n.
The bounds test was employed to examine the existence of a level relationship between PCGRGDP, IMPGS, and EXPGS. The existence of a long-run relationship among the variables is empirically realized through an F-test employing OLS. This is simply a test of the hypothesis of no cointegration among the variables against the existence of cointegration among the variables. The coefficients to be tested in Equation 2 are:
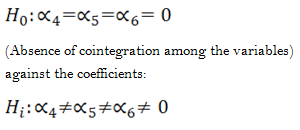
(Presence of cointegration among the variables)
The asymptotic critical value bounds of the F-statistic proposed by Pesaran et al. (2001![]() ) is used for ascertaining the existence or absence of cointegration among the variables. if the computer F–statistic is less than the lower bounds of the critical values of the F-statistic, the absence of cointegration will be confirmed. However, If the computed F–statistic is greater than the upper bounds of the critical values, the alternative hypothesis of cointegration will be accepted among the variables in the model. Furthermore, if the F–statistic falls between these bounds, the inference is inconclusive and prior knowledge of the cointegration rank (r) of the forcing variable is required (see Manwa (2015
) is used for ascertaining the existence or absence of cointegration among the variables. if the computer F–statistic is less than the lower bounds of the critical values of the F-statistic, the absence of cointegration will be confirmed. However, If the computed F–statistic is greater than the upper bounds of the critical values, the alternative hypothesis of cointegration will be accepted among the variables in the model. Furthermore, if the F–statistic falls between these bounds, the inference is inconclusive and prior knowledge of the cointegration rank (r) of the forcing variable is required (see Manwa (2015![]() )).
)).
If there is no cointegration among the variables, the procedure terminates after the initial bounds test. On the other hand, if there is cointegration among the variables in the model, based on Equation 3, the long run elasticities can be calculated using OLS.
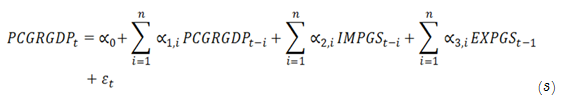
With insights from Manwa (2015![]() ) once the long-run (cointegration) relationship between the variables in the model has been determined, the calculation of short-run elasticities will be the final step. In this case, causality is established using an error correction model associated with the long run estimates as described in Equation 4.
) once the long-run (cointegration) relationship between the variables in the model has been determined, the calculation of short-run elasticities will be the final step. In this case, causality is established using an error correction model associated with the long run estimates as described in Equation 4.
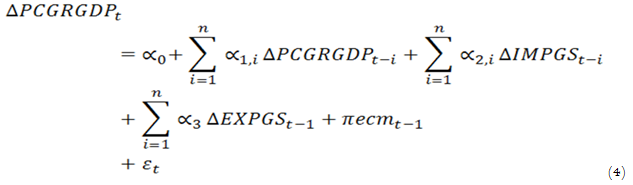
Where α1, α2, α3 represent the short-run dynamics coefficients of the model’s convergence to equilibrium, π is the speed of adjustment to long-run equilibrium following a shock to the system and ecmt-1 is the error correction term. The parameter π is expected to show a negative sign. The error correcting term ecmt-1 shows how disequilibrium in output can be adjusted in the short-run. The ecm coefficient shows the speed with which the system converges to equilibrium. Shocks to the system are measured by the error correction term. Through a series of short-run adjustments, the error correcting term ensure the correction of deviations from long-run equilibrium. After introducing shocks in the system in the short-run, the rate of adjustment back to long-run equilibrium is determined by the magnitude of π. The significance of the coefficient of the lagged error correction term and joint significance of the coefficients of the lagged differences of the right-hand side variables using the F–test are the basis for determining causality (Manwa, 2015![]() ).
).
3.3. The Toda and Yamamoto Multivariate Causality Test
There are many tests in the econometric literature for testing causality between economic variables. These are Granger (1969![]() ); Geweke et al. (1983
); Geweke et al. (1983![]() ); Sims et al. (1990
); Sims et al. (1990![]() ); Toda and Phillips (1993
); Toda and Phillips (1993![]() ); Toda and Yamamoto (1995
); Toda and Yamamoto (1995![]() ) and Dolado and Lütkepohl (1996
) and Dolado and Lütkepohl (1996![]() ). Toda and Yamamoto's causality test approach is employed in the study to avoid the problems inherent in other techniques for testing causality. This technique is preferred to other approaches based on the following: First and most importantly, the approach is appropriate despite the order of integration and cointegration properties of the variables; as opined by Maddala (2001
). Toda and Yamamoto's causality test approach is employed in the study to avoid the problems inherent in other techniques for testing causality. This technique is preferred to other approaches based on the following: First and most importantly, the approach is appropriate despite the order of integration and cointegration properties of the variables; as opined by Maddala (2001![]() ) and Gujarati (2006
) and Gujarati (2006![]() ) the omission of significant variables under the Granger causality technique would provoke inefficient estimates and spurious significance; again, the Granger (1969
) the omission of significant variables under the Granger causality technique would provoke inefficient estimates and spurious significance; again, the Granger (1969![]() ) test for inferring causality will generate spurious results if there are time lags on integrated variables in the functions and the F-statistics can only be valid when the variables in levels are cointegrated; the alternative techniques such as the error correction model of Engle and Granger (1987
) test for inferring causality will generate spurious results if there are time lags on integrated variables in the functions and the F-statistics can only be valid when the variables in levels are cointegrated; the alternative techniques such as the error correction model of Engle and Granger (1987![]() ) and the vector auto regression of Johansen and Juselius (1990
) and the vector auto regression of Johansen and Juselius (1990![]() ) and Johansen (1991
) and Johansen (1991![]() ) for the testing of non-causality between economic time series are burdensome; in addition, evidence from Toda and Phillips (1993
) for the testing of non-causality between economic time series are burdensome; in addition, evidence from Toda and Phillips (1993![]() ) revealed the possibility of incorrect inference when the Granger causality tests are conducted in Error Correction Models (ECMs) platform; moreso, under the platform of error correction model, Granger causality can lead to wrong conclusions as a result of parameter dependency which in some cases are asymptotic [see Toda and Phillips (1993
) revealed the possibility of incorrect inference when the Granger causality tests are conducted in Error Correction Models (ECMs) platform; moreso, under the platform of error correction model, Granger causality can lead to wrong conclusions as a result of parameter dependency which in some cases are asymptotic [see Toda and Phillips (1993![]() ))]; furthermore, modified Wald test (MWald) and Seemingly Unrelated Regression (SUR) models are the basis for conducting Toda and Yamamoto test for Granger non-causality (Rambaldi and Doran, 1996
))]; furthermore, modified Wald test (MWald) and Seemingly Unrelated Regression (SUR) models are the basis for conducting Toda and Yamamoto test for Granger non-causality (Rambaldi and Doran, 1996![]() ). Finally, as observed by Toda and Yamamoto (1995
). Finally, as observed by Toda and Yamamoto (1995![]() ) this technique guarantees that under the null hypothesis that Wald test will have its normal asymptotic chi-square distribution for examining the link between two variables.
) this technique guarantees that under the null hypothesis that Wald test will have its normal asymptotic chi-square distribution for examining the link between two variables.
The estimation of an augmented VAR is necessitated in the causality approach developed by Toda and Yamamoto (1995![]() ) and this can be applied regardless of the integration or cointegration properties of the system. This technique involves the application of a Modified Wald (MWALD) test for testing the restrictions on the parameters of the VAR (k) model (where k is the lag length in the system). The asymptotic chi-square (𝜒2) distribution of the Wald Statistic with k degrees of freedom in the limit is assured through the estimation of a VAR (k+dmax), dmax resulted as a resulting of the overfitting (augmenting) of the VAR model with an extra lag, where dmax denotes the maximal order of integration for the series in the model. This would result in the order of VAR becoming p = k+d. The application of this method requires two steps: The establishment of the true lag length (k) and the maximum order of integration (d) of the variables in the model is considered the first step. Having established the order of integration d (max) and given that the VAR (k) has been designated, a level VAR (k+d) can then be estimated. The application of the standard Wald tests to the first k VAR parameter matrix (with the exclusion of all lagged parameters) to conduct inference on Granger causality is considered the second step (Manap and Shirazi, 2004
) and this can be applied regardless of the integration or cointegration properties of the system. This technique involves the application of a Modified Wald (MWALD) test for testing the restrictions on the parameters of the VAR (k) model (where k is the lag length in the system). The asymptotic chi-square (𝜒2) distribution of the Wald Statistic with k degrees of freedom in the limit is assured through the estimation of a VAR (k+dmax), dmax resulted as a resulting of the overfitting (augmenting) of the VAR model with an extra lag, where dmax denotes the maximal order of integration for the series in the model. This would result in the order of VAR becoming p = k+d. The application of this method requires two steps: The establishment of the true lag length (k) and the maximum order of integration (d) of the variables in the model is considered the first step. Having established the order of integration d (max) and given that the VAR (k) has been designated, a level VAR (k+d) can then be estimated. The application of the standard Wald tests to the first k VAR parameter matrix (with the exclusion of all lagged parameters) to conduct inference on Granger causality is considered the second step (Manap and Shirazi, 2004![]() ). It is worth noting that only the first k parameter matrices are included in the Wald test. However, the coefficients of the last d-max lagged vectors are excluded. As opined by Toda and Yamamoto (1995
). It is worth noting that only the first k parameter matrices are included in the Wald test. However, the coefficients of the last d-max lagged vectors are excluded. As opined by Toda and Yamamoto (1995![]() ) these techniques guarantee that Wald test statistic have their normal asymptotic chi-square distribution under the null hypothesis through the employment of an augmented VAR such as VAR (k+d).
) these techniques guarantee that Wald test statistic have their normal asymptotic chi-square distribution under the null hypothesis through the employment of an augmented VAR such as VAR (k+d).
The multivariate framework of our case study can be arithmetically stated in Equation 5, Equation 6 and Equation 7 as follows:
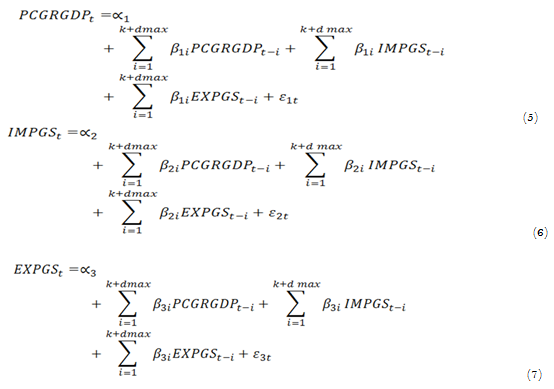
4. DATA PRESENTATION, ANALYSIS AND DISCUSSION OF RESULTS
4.1. Results of Augmented Dickey-Fuller (ADF) and Phillips Perron Unit Root Tests on Series
Table-2a. Unit root tests results.
| Country: South Africa | ||||||
| LEVEL | ||||||
| Augmented Dickey-Fuller (ADF) | Phillips-Perron (PP) | |||||
| Constant | Constant & Trend | None | Constant | Constant & Trend | None | |
| PCGRGDP | -3.719483*** | -4.141479*** | -3.739374*** | -3.719425*** | -4.141479*** | -3.733189*** |
| IMPGS | -1.484740 | -2.751640 | -0.083279 | -1.333817 | -2.529969 | 0.075919 |
| EXPGS | -2.676862* | -3.590069** | -0.554775 | -2.791783* | -3.590069** | -0.562156 |
| First difference | ||||||
| PCGRGDP | -6.972346*** | -6.869103*** | -7.063648*** | -8.664530*** | -8.394232*** | -8.918694*** |
| IMPGS | -6.416880*** | -6.526433*** | -6.517630*** | -6.488475*** | -7.164620*** | -6.589623*** |
| EXPGS | -6.155379*** | -6.051057*** | -6.259406*** | -7.742557*** | -8.239182*** | -7.753029*** |
| Country: Algeria | ||||||
| Level | ||||||
| Augmented Dickey-Fuller (ADF) | Phillips-Perron (PP) | |||||
| Constant | Constant & Trend | None | Constant | Constant & Trend | None | |
| PCGRGDP | -3.369519*** | -3.498827* | -3.120784*** | -3.460288** | -3.613382* | -3.197123*** |
| IMPGS | -1.855664 | -2.449871 | -0.012598 | -1.808726 | -2.063149 | 0.311685 |
| EXPGS | -1.462938 | -1.486439 | -0.839003 | -1.563769 | -1.631977 | -0.839003 |
| First difference | ||||||
| PCGRGDP | -6.101647*** | -5.998622*** | -6.211017*** | -8.565634*** | -8.406393*** | -8.709283*** |
| IMPGS | -5.453770*** | -6.410065*** | -5.528347*** | -6.021520*** | -9.482024*** | -6.009241*** |
| EXPGS | -5.358974*** | -4.379515*** | -5.409886*** | -5.362639*** | -5.297163*** | -5.413061*** |
| Country: Nigeria | ||||||
| Level | ||||||
| Augmented Dickey-Fuller (ADF) | Phillips-Perron (PP) | |||||
| Constant | Constant & Trend | None | Constant | Constant & Trend | None | |
| PCGRGDP | -4.531113*** | -5.176280*** | -4.550880*** | -4.535913*** | -5.176280*** | -4.561884*** |
| IMPGS | -2.754672* | -2.673225 | -1.006475 | -2.695557* | -2.609347 | -0.943083 |
| EXPGS | -2.434064 | -2.336802 | -0.701400 | -2.357580 | -2.241087 | -0.892337 |
| First difference | ||||||
| PCGRGDP | -9.483971*** | -9.438176*** | -9.620148*** | -17.97725*** | -32.09500*** | -16.59432*** |
| IMPGS | -8.308418*** | -4.078642** | -8.399188*** | -11.13627*** | -14.77997*** | -10.81162*** |
| EXPGS | -8.778229*** | -5.949251*** | -8.894305*** | -8.822906*** | -10.21492*** | -8.942731*** |
| Country: Egypt | ||||||
| Level | ||||||
| Augmented Dickey-Fuller (ADF) | Phillips-Perron (PP) | |||||
| Constant | Constant & Trend | None | Constant | Constant & Trend | None | |
| PCGRGDP | -4.764458*** | -2.475367 | -2.945366*** | -4.764458*** | -4.657756*** | -2.885482*** |
| IMPGS | -2.086514 | -3.134986 | -1.423878 | -2.048883 | -2.373518 | -1.467227 |
| EXPGS | -3.418981** | -2.482457 | -1.524194 | -1.976449 | -2.040782 | -1.274766 |
| First difference | ||||||
| PCGRGDP | -3.833354*** | -3.752552** | -3.927265*** | -10.81665*** | -10.61173*** | -10.97580*** |
| IMPGS | -5.956267*** | -5.962204*** | -5.777519*** | -5.951688*** | -5.957389*** | -5.788624*** |
| EXPGS | -4.444015*** | -4.376032*** | -4.356931*** | -4.579701*** | -4.519372*** | -4.490068*** |
Note: ***, **, and * implies significance at 1%, 5%, and 10% levels respectively.
Table 2a depicts the unit root tests results of the variables included in the export-economic growth model.
Table-2b. Summary of unit root tests results.
| Country/ variable |
ADF |
Order of integration |
PP |
Order of integration |
||
Level |
1st difference |
Level |
1st difference |
|||
| South Africa PCGRGDP IMPGS EXPGS |
-4.141479b*** -2.751640b -3.590069b*** |
- -6.526433b*** - |
I(0) I(1) I(0) |
-4.141479b*** -2.529969b -3.590069b** |
- -7.164620b*** - |
I(0) I(1) I(0) |
| Algeria PCGRGDP IMPGS EXPGS |
-3.498827b* -2.449871b -1.486439b |
- -6.410065b*** -5.409886c*** |
I(0) I(1) I(1) |
-3.613382b* -2.063149b -1.631977b |
- -9.482024b*** -5.413061c*** |
I(0) I(1) I(1) |
| Nigeria PCGRGDP IMPGS EXPGS |
-5.176280b*** -2.754672a* -2.434064a |
- - -8.894305c*** |
I(0) I(0) I(1) |
-5.176280b*** -2.695557a* -2.357580a |
- - -10.21492b*** |
I(0) I(0) I(1) |
| Egypt PCGRGDP IMPGS EXPGS |
-4.764458a*** -3.134986b -3.418981a** |
- -5.962204b*** - |
I(0) I(1) I(0) |
-4.764458a*** -2.373518b -2.040782b |
- -5.957389b*** -4.579701a*** |
I(0) I(1) I(1) |
Note: ***, **, and * implies significance at 1%, 5%, and 10% levels respectively. Also, 'a' denotes model with constant, 'b' is for the model with constant and trend and ‘c' is the model without constant and trend.
Table 2b shows the ADF and PP tests results of the variables included in the export–economic growth model. The results for South Africa, Algeria, Nigeria, and Egypt revealed that the variables are either I(0) or I(1) justifying the application of the ARDL methodology to our model.
4.2. Results of Diagnostic Tests for ARDL Model
The goodness of fit and model adequacy is ascertained through the diagnostic tests. Table 3 depicts the diagnostic tests for the ARDL model. In the case of South Africa, Algeria, and Egypt, there is no indication of autocorrelation. The models pass the normality tests and It is evident from the tests that the errors are normally distributed. In addition, the models pass the Ramsey RESET test for the correct specification of the model as well as the test for heteroskedasticity. However, in the case of Nigeria, the model passed the Ramsey RESET test and the heteroskedasticity test. However, for the Jarque-Bera normality test depicted in Figure 5a, Figure 5b, Figure 5c and Figure 5d in the appendices, the null hypothesis was rejected at the 95% confidence level. Furthermore, for the Breusch-Godfrey Serial Correlation LM Test, the null hypothesis was rejected at the 95% confidence level. Therefore, the model did not pass both tests. Under the normality test, the null hypothesis that the residuals are normally distributed was tested against the alternative hypothesis that the residuals are not normally distributed. The null hypothesis of normal distribution was rejected because the probability value was less than the Jacque Bera chi-square at the 5% level of significance. Hence, all the variables were not normally distributed. Under the Breusch-Pagan-Godfrey test for serial correlation, the p-value of the F-Statistic was less than the chosen level of significance. Therefore, we rejected the null hypothesis of no autocorrelation and conclude that the variables are serially correlated.
4.3. Results of the Bounds Test for Cointegration
Table 4 depicts the results of the bounds tests for the existence of cointegration between economic growth and the causal variables. In the case of South Africa, the computed F-statistic for the joint test of the coefficients α4, α5, and α6 is 14.28250. The critical value bounds at the 95 per cent level are 4.87 and 5.85. Since the computed F-statistic is above the 95 per cent upper bound I(1) of the critical value band computed by Narayan (2004![]() ) and Pesaran et al. (2001
) and Pesaran et al. (2001![]() ) the null hypothesis of no cointegration between the variables in the model cannot be accepted. The null hypothesis was rejected. In other words, a long run relationship exists among the variables in our model. It is evident from the results that a long-run relationship exists among the variables in our model with reference to Algeria, Nigeria and Egypt. In the case of Algeria, the F-statistic obtained (4.566650) falls between the lower bound I(0) and upper bound I(1). Thus, the justification for both long-run and short-run models. After ascertaining the presence of a long-run relationship among the variables in the models, the long-run parameters and short-run dynamics of the growth equation was estimated with the ARDL cointegration method.
) the null hypothesis of no cointegration between the variables in the model cannot be accepted. The null hypothesis was rejected. In other words, a long run relationship exists among the variables in our model. It is evident from the results that a long-run relationship exists among the variables in our model with reference to Algeria, Nigeria and Egypt. In the case of Algeria, the F-statistic obtained (4.566650) falls between the lower bound I(0) and upper bound I(1). Thus, the justification for both long-run and short-run models. After ascertaining the presence of a long-run relationship among the variables in the models, the long-run parameters and short-run dynamics of the growth equation was estimated with the ARDL cointegration method.
Table-3. Diagnostic results for ARDL model.
| Country: South Africa | ||||
| Test | Test statistic |
P-value |
Null hypothesis |
Conclusion |
| Breusch-Godfrey Serial Correlation LM Test | 1.862162 |
0.1747 |
Ho: No serial correlation |
Cannot reject Ho |
| Ramsey RESET test | 0.536584 |
0.5958 |
Ho: Correctly specified |
Cannot reject Ho |
| Jarque-Bera normality test | 0.483268 |
0.785344 |
Ho: Normal distribution |
Cannot reject Ho |
| Heteroskedasticity Test: ARCH | 1.021202 |
0.4313 |
Ho: Homoskedasticity |
Cannot reject Ho |
| Country: Algeria | ||||
| Test | Test statistic |
P-value |
Null hypothesis |
Conclusion |
| Breusch-Godfrey Serial Correlation LM Test | 0.345674 |
0.7106 |
Ho: No serial correlation |
Cannot reject Ho |
| Ramsey RESET test | 0.967575 |
0.3410 |
Ho: Correctly specified |
Cannot reject Ho |
| Jarque-Bera normality test | 0.671858 |
0.714674 |
Ho: Normal distribution |
Cannot reject Ho |
| Heteroskedasticity Test: ARCH | 0.539137 |
0.7081 |
Ho: Homoskedasticity |
Cannot reject Ho |
| Country: Nigeria | ||||
| Test | Test statistic |
P-value |
Null hypothesis |
Conclusion |
| Breusch-Godfrey Serial Correlation LM Test | 4.151711 |
0.0264 |
Ho: No serial correlation |
Cannot reject Ho |
| Ramsey RESET test | 0.507048 |
0.6160 |
Ho: Correctly specified |
Cannot reject Ho |
| Jarque-Bera normality test | 59.49614 |
0.000000 |
Ho: Normal distribution |
Cannot reject Ho |
| Heteroskedasticity Test: ARCH | 0.540894 |
0.7437 |
Ho: Homoskedasticity |
Cannot reject Ho |
| Country: Egypt | ||||
| Test | Test statistic |
P-value |
Null hypothesis |
Conclusion |
| Breusch-Godfrey Serial Correlation LM Test | 0.590936 |
0.5603 |
Ho: No serial correlation |
Cannot reject Ho |
| Ramsey RESET test | 2.047243 |
0.0495 |
Ho: Correctly specified |
Cannot reject Ho |
| Jarque-Bera normality test | 1.386230 |
0.500016 |
Ho: Normal distribution |
Cannot reject Ho |
| Heteroskedasticity Test: ARCH | 2.329513 |
0.0780 |
Ho: Homoskedasticity |
Cannot reject Ho |
4.4. Results of the Long-Run Relationship
Table 5 revealed that some of the variables had the expected signs and were significant. The variables were significant for Nigeria. The export variable was significant for Algeria. However, imports of goods and services and exports of goods and services had a non-significance relationship with real GDP per capita growth rate for South Africa, and Egypt. The results for most of the variables defied theoretical expectations. The import variable defied theoretical expectations for Algeria and Egypt. Nevertheless, the export variable had the expected sign for all the countries under study. In the case of South Africa, imports had a negative relationship with real GDP per capita growth rate as expected.
This could be attributed to the fact that an increase in imports reduces the international reserves of countries thereby reducing the real GDP per capita growth rate. Again, imported consumption goods cannot add to capital generation and are ineffective in fostering economic growth. The coefficient of imports reveals that a unit increase in imports will result in 0.05 per cent reduction in real GDP per capita growth rate in the long-run. This means that as imports increases, the rate of economic growth reduces. This result is in line with the submissions of Musonda (2007![]() ) and Duru (2013
) and Duru (2013![]() ) but contrary to the finding of Kaberuka et al. (2014
) but contrary to the finding of Kaberuka et al. (2014![]() ). On the other hand, exports of goods and services had a positive and non-significant relationship with real GDP per capita growth rate. This can be attributed to the catalytic role of international trade in South Africa's economic growth. This implies that as the level of exports increases, the rate of economic growth will also increase. Hence a unit increase in exports will trigger a 0.07 per cent increase in real GDP per capita growth rate. This result is in line with the submissions of most empirical studies on the export-led growth literature amongst which are the studies of Chanthunya (1992
). On the other hand, exports of goods and services had a positive and non-significant relationship with real GDP per capita growth rate. This can be attributed to the catalytic role of international trade in South Africa's economic growth. This implies that as the level of exports increases, the rate of economic growth will also increase. Hence a unit increase in exports will trigger a 0.07 per cent increase in real GDP per capita growth rate. This result is in line with the submissions of most empirical studies on the export-led growth literature amongst which are the studies of Chanthunya (1992![]() ); Matemvu (1997
); Matemvu (1997![]() ); Adelegan (2000
); Adelegan (2000![]() ); Vohra (2001
); Vohra (2001![]() ); Sentsho (2000
); Sentsho (2000![]() ); Broda and Tille (2003
); Broda and Tille (2003![]() ); Njikam (2003
); Njikam (2003![]() ) and Musonda (2007
) and Musonda (2007![]() ). However, the result is contrary to the submissions of Musinguzi et al. (2000
). However, the result is contrary to the submissions of Musinguzi et al. (2000![]() ) and Atoyebi et al. (2012
) and Atoyebi et al. (2012![]() ).
).
Table-4. Bounds tests for the existence of cointegration.
| Country: South Africa | |||||
| Test statistic | Value |
Lag |
Significance level |
Bound critical values* Lower bound upper bound |
|
| F-statistic | 14.28250 |
2 |
I(0) |
I(1) |
|
1% |
6.34 |
7.52 |
|||
5% |
4.87 |
5.85 |
|||
10% |
4.19 |
5.06 |
|||
| Country: Algeria | |||||
| Test statistic | Value |
Lag |
Significance level |
Bound critical values* Lower bound upper bound |
|
| F-statistic | 4.566650 |
2 |
I(0) |
I(1) |
|
1% |
6.34 |
7.52 |
|||
5% |
4.87 |
5.85 |
|||
10% |
4.19 |
5.06 |
|||
| Country: Nigeria | |||||
| Test statistic | Value |
Lag |
Significance level |
Bound critical values* Lower bound upper bound |
|
| F-statistic | 11.34897 |
2 |
I(0) |
I(1) |
|
1% |
6.34 |
7.52 |
|||
5% |
4.87 |
5.85 |
|||
10% |
4.19 |
5.06 |
|||
| Country: Egypt | |||||
| Test statistic | Value |
Lag |
Significance level |
Bound critical values* Lower bound upper bound |
|
| F-statistic | 10.22260 |
2 |
I(0) |
I(1) |
|
1% |
6.34 |
7.52 |
|||
5% |
4.87 |
5.85 |
|||
10% |
4.19 |
5.06 |
|||
| Critical value bounds for the F-statistic at 90% confidence level from Pesaran et al. (2001 |
|||||
Table-5. Results for estimated long-run coefficients.
| Country: South Africa | ||||
| Dependent Variable: PCGRGDP | ||||
| Variable | Coefficient |
Std. error |
t-Statistic |
Prob. |
| C | -1.805736 |
3.173620 |
-0.568983 |
0.5737 |
| IMPGS | -0.054175 |
0.187999 |
-0.288165 |
0.7753 |
| EXPGS | 0.067119 |
0.194621 |
0.344870 |
0.7327 |
| Country: Algeria | ||||
| C | -8.503187 |
4.590185 |
-1.852471* |
0.0735 |
| IMPGS | 0.220855 |
0.167350 |
1.319721 |
0.1966 |
| EXPGS | 0.136072 |
0.069428 |
1.959889* |
0.0591 |
| Country: Nigeria | ||||
| C | -11.296967 |
3.628812 |
-3.113131*** |
0.0040 |
| IMPGS | -0.449831 |
0.200774 |
-2.240479** |
0.0326 |
| EXPGS | 0.568699 |
0.175147 |
3.246989*** |
0.0029 |
| Country: Egypt | ||||
| C | -1.910579 |
2.607966 |
-0.732594 |
0.4693 |
| IMPGS | 0.123688 |
0.115309 |
1.072665 |
0.2917 |
| EXPGS | 0.008961 |
0.103590 |
0.086506 |
0.9316 |
Note: ***, **, and * denote significance at 1%, 5%, and 10% levels respectively.
For Algeria, imports surprisingly exerted a positive and insignificant relationship with real GDP per capita growth rate contrary to expectation. This could be attributed to the importation of producers’ goods that add to capital generation and are efficient in promoting economic growth. This implies that a unit increase in imports will result in a 0.22 per cent increase in real GDP per capita growth rate in the long-run. This means that as imports increases, the rate of economic growth also increases. This implies that the government should encourage policies promoting imports of productive foreign technologies as ways of achieving economic growth. This result is contrary to the submissions of most empirical studies on the export-led growth literature amongst which are the studies of Musonda (2007![]() ) and Duru (2013
) and Duru (2013![]() ). This assertion finds an advocate in Kaberuka et al. (2014
). This assertion finds an advocate in Kaberuka et al. (2014![]() ). However, exports of goods and services had a positive and significant relationship with real GDP per capita growth rate as expected. This can be attributed to the catalytic role of international trade in economic growth. This means that as the level of exports increases, the rate of economic growth will also increase. Therefore, a unit increase in exports will trigger a 0.14 per cent increase in real GDP per capita growth rate. This implies that export-led economic growth and development strategies should be continued by the Algerian government. This result is in line with the submissions of most empirical studies on the export-led growth literature amongst which are the studies of Chanthunya (1992
). However, exports of goods and services had a positive and significant relationship with real GDP per capita growth rate as expected. This can be attributed to the catalytic role of international trade in economic growth. This means that as the level of exports increases, the rate of economic growth will also increase. Therefore, a unit increase in exports will trigger a 0.14 per cent increase in real GDP per capita growth rate. This implies that export-led economic growth and development strategies should be continued by the Algerian government. This result is in line with the submissions of most empirical studies on the export-led growth literature amongst which are the studies of Chanthunya (1992![]() ); Matemvu (1997
); Matemvu (1997![]() ); Adelegan (2000
); Adelegan (2000![]() ); Vohra (2001
); Vohra (2001![]() ); Sentsho (2000
); Sentsho (2000![]() ); Broda and Tille (2003
); Broda and Tille (2003![]() ); Njikam (2003
); Njikam (2003![]() ) and Musonda (2007
) and Musonda (2007![]() ). However, the result is contrary to the submissions of Musinguzi et al. (2000
). However, the result is contrary to the submissions of Musinguzi et al. (2000![]() ) and Atoyebi et al. (2012
) and Atoyebi et al. (2012![]() ).
).
In the case of Nigeria, imports had a negative and significant relationship with real GDP per capita growth in line with expectation. This could be attributed to the importation of consumer goods that do not add to capital generation and are inefficient in promoting economic growth. This implies that a unit increase in imports will result in 0.45 per cent decrease in real GDP per capita growth rate in the long-run. This means that as imports increases, the rate of economic growth reduces. The negative and statistically significant relationship between imports and the real GDP per capita growth rate implies that the government should encourage export promotion measures as alternative ways of fostering economic growth and forsake measures promoting imports. There is a need for the government to urgently implement economic and trade policies that promote growth but restrict imports. However, the policy actions to be taken should be implemented in such a way that it will not prevent the import of productive foreign technology that could foster growth in a technology-deficient economy like Nigeria. Again, it should discourage non-productive imports and encourage growth-enhancing imports in order to sustain Nigeria's international reserve and real GDP per capita growth rate.
This result is in line with the submissions of Musonda (2007![]() ) and Duru (2013
) and Duru (2013![]() ) but contrary to the finding of Kaberuka et al. (2014
) but contrary to the finding of Kaberuka et al. (2014![]() ). As expected, exports of goods and services had a positive and significant relationship with real GDP per capita growth rate. This can be attributed to the catalytic role of international trade in economic growth. This means that as the level of exports increases, the rate of economic growth will also increase. Therefore, a unit increase in exports will trigger a 0.57 per cent increase in real GDP per capita growth rate. This implies that export-led economic growth and development strategies such as the Economic Recovery and Growth Plan (ERGP) should be continued by the Nigerian government. This result is in line with the submissions of most empirical studies on the export-led growth literature amongst which are the studies of Chanthunya (1992
). As expected, exports of goods and services had a positive and significant relationship with real GDP per capita growth rate. This can be attributed to the catalytic role of international trade in economic growth. This means that as the level of exports increases, the rate of economic growth will also increase. Therefore, a unit increase in exports will trigger a 0.57 per cent increase in real GDP per capita growth rate. This implies that export-led economic growth and development strategies such as the Economic Recovery and Growth Plan (ERGP) should be continued by the Nigerian government. This result is in line with the submissions of most empirical studies on the export-led growth literature amongst which are the studies of Chanthunya (1992![]() ); Matemvu (1997
); Matemvu (1997![]() ); Adelegan (2000
); Adelegan (2000![]() ); Vohra (2001
); Vohra (2001![]() ); Sentsho (2000
); Sentsho (2000![]() ); Broda and Tille (2003
); Broda and Tille (2003![]() ); Njikam (2003
); Njikam (2003![]() ) and Musonda (2007
) and Musonda (2007![]() ). However, the result is contrary to the submissions of Musinguzi et al. (2000
). However, the result is contrary to the submissions of Musinguzi et al. (2000![]() ) and Atoyebi et al. (2012
) and Atoyebi et al. (2012![]() ).
).
Another intriguing result in the context of the Egyptian economy is the nexus between imports of goods and services and economic growth. This is because unproductive consumer goods that add nothing to capital generation and are ineffective in encouraging economic growth are mostly imported by African countries. Imports exerted a positive and insignificant relationship with real GDP per capita growth rate. This could be attributed to the importation of producers’ goods that add to capital generation and are efficient in promoting economic growth. This implies that a unit increase in imports will result in a 0.12 per cent increase in real GDP per capita growth rate in the long-run. This means that as imports increases, the rate of economic growth also increases. This implies that the government should encourage policies promoting imports of productive foreign technologies as ways of achieving economic growth. This result is contrary to the submissions of most empirical studies on the export-led growth literature amongst which are the studies of Musonda (2007![]() ) and Duru (2013
) and Duru (2013![]() ). However, it is in line with the submission of Kaberuka et al. (2014
). However, it is in line with the submission of Kaberuka et al. (2014![]() ). However, exports of goods and services had a positive and insignificant relationship with real GDP growth rate. This implies that a unit increase in exports of goods and services would increase growth by 0.001 per cent. This result is supported by economic theory that emphasizes the catalytic role of international trade in promoting economic growth. The implication of this result is that as exports of goods and services increases, real GDP growth also increases. This result is in line with the submissions of most empirical studies on the export-led growth literature amongst which are the studies of Chanthunya (1992
). However, exports of goods and services had a positive and insignificant relationship with real GDP growth rate. This implies that a unit increase in exports of goods and services would increase growth by 0.001 per cent. This result is supported by economic theory that emphasizes the catalytic role of international trade in promoting economic growth. The implication of this result is that as exports of goods and services increases, real GDP growth also increases. This result is in line with the submissions of most empirical studies on the export-led growth literature amongst which are the studies of Chanthunya (1992![]() ); Matemvu (1997
); Matemvu (1997![]() ); Adelegan (2000
); Adelegan (2000![]() ); Vohra (2001
); Vohra (2001![]() ); Sentsho (2000
); Sentsho (2000![]() ); Broda and Tille (2003
); Broda and Tille (2003![]() ); Njikam (2003
); Njikam (2003![]() ) and Musonda (2007
) and Musonda (2007![]() ). However, the result is contrary to the submissions of Musinguzi et al. (2000
). However, the result is contrary to the submissions of Musinguzi et al. (2000![]() ) and Atoyebi et al. (2012
) and Atoyebi et al. (2012![]() ).
).
4.5. Results of the Short-run Dynamic Model
Table-6. Results of estimated short-run error correction model.
| Country: South Africa | ||||
| Dependent variable: PCGRGDP | ||||
| Variable | Coefficient |
Std. Error |
t-Statistic |
Prob. |
| D(IMPGS) | 0.619005 |
0.149318 |
4.145544*** |
0.0003 |
| D(EXPGS) | -0.204887 |
0.151839 |
-1.349372 |
0.1877 |
| ECMt-1 | -0.760578 |
0.142848 |
-5.324377*** |
0.0000 |
| ECM = PCGRGDP – 0.0671*EXPGS – 0.0542*IMPGS – 1.8057*C + 0.0887*D | ||||
| Country: Algeria | ||||
| D(IMPGS) | 0.134170 |
0.089880 |
1.492767 |
0.1456 |
| D(EXPGS) | 0.082664 |
0.045206 |
1.828618* |
0.0771 |
| ECMt-1 | -0.607503 |
0.163116 |
-3.724359*** |
0.0008 |
| ECM = PCGRGDP – 0.1361*EXPGS + 0.2209*IMPGS – 8.5032*C - 0.0326*D | ||||
| Country: Nigeria | ||||
| D(IMPGS) | -0.470791 |
0.203156 |
-2.317390** |
0.0275 |
| D(EXPGS) | 0.131740 |
0.140263 |
0.939233 |
0.3551 |
| ECMt-1 | -1.046595 |
0.163916 |
-6.384930*** |
0.0000 |
| ECM = PCGRGDP – 0.5687*EXPGS - 0.4498*IMPGS – 11.2970*C + 0.2347*D | ||||
| Country: Egypt | ||||
| D(IMPGS) | 0.105285 |
0.101076 |
1.041639 |
0.3056 |
| D(EXPGS) | 0.007628 |
0.088207 |
0.086477 |
0.9316 |
| ECMt-1 | -0.851214 |
0.168042 |
-5.065472*** |
0.0000 |
| ECM = PCGRGDP – 0.0090*EXPGS + 0.1237*IMPGS – 1.9106*C + 0.0229*D | ||||
Note: ***, ** and * denote significance at 1%, 5% and 10% respectively.
Table 6 showed that the model performed satisfactorily with some of the explanatory variables having the expected relation with real GDP per capita growth rate. Most of the variables had the expected outcomes. The results of the estimated short-run error correction model provide estimates of short-run elasticities while the ecmt-1 coefficient shows the speed with which the system converges to equilibrium. In the case of South Africa, change in imports exerted a positive and significant relationship with real GDP per capita growth rate in the short-run implying that imports contribute to real output growth. This implies that the government should encourage policies promoting imports of productive foreign technologies as ways of achieving economic growth. Exports of the previous year had a negative and insignificant relationship with the growth rate of real GDP per capita in the short-run. This means that economic growth would reduce by 0.20 per cent, should exports be increased by 1 per cent. This does not conform to the result of the long run growth equation. The coefficient of the lagged error correction term or ecmt-1 for the growth equation was -0.7606, implying that real GDP per capita growth rate corrects about 76% of its past deviation from equilibrium every year. This value supports the presence of a long-run equilibrium relationship between exports and economic growth.
For Algeria, the short-run effect of imports of the previous year on real GDP per capita growth rate was positive and insignificant. This means that if imports go up by 1 per cent, economic growth will increase by 0.13 per cent. Change in exports had a positive and significant relationship with real GDP per capita growth rate in the short run. This implies that economic growth would increase by 0.08 per cent, should exports be deepened by 1 per cent. These results are consistent with the outcome of the long-run results. The coefficient of the lagged error correction term or ecmt-1 for the growth equation was -0.6075. This implies that divergence from short-run to long-run equilibrium in real GDP per capita growth rate is 61% within one year. This value justifies the existence of a long-run equilibrium relationship between exports and economic growth.
In the case of Nigeria, change in imports and exports maintained their negative and significant relationship with real output growth as in the long-run equation. The coefficient of the lagged error correction term or ecmt-1 for the growth equation was -1.0466. This means that divergence from short-run to long-run equilibrium in real GDP per capita growth rate is 105% within one year. This high significant value supports the presence of a long-run equilibrium relationship between exports and economic growth. For Egypt, imports and exports of the previous year maintained a positive and insignificant relationship with real output growth in the dynamic growth equation consistent with the long-run results. The coefficient of the lagged error correction term for Egypt suggests that divergence from short-run to long-run equilibrium in real GDP per capita growth rate is 85% within one year. This high significant value justifies the existence of a long-run equilibrium relationship between exports and economic growth. The individual countries under study had high speeds of adjustments. As observed by Granger (1988![]() ) the significance of the coefficients of the lagged error correction term indicates that a long-run Granger causality runs from the explanatory variables to the dependent variable. Besides, the negative sign and high significance of the speeds of adjustments to long-run stable equilibrium based on the estimated ecmt-1 still confirms the existence of a long-run relationship between real GDP per capita growth rate and the independent variables.
) the significance of the coefficients of the lagged error correction term indicates that a long-run Granger causality runs from the explanatory variables to the dependent variable. Besides, the negative sign and high significance of the speeds of adjustments to long-run stable equilibrium based on the estimated ecmt-1 still confirms the existence of a long-run relationship between real GDP per capita growth rate and the independent variables.
4.6. The Results of Toda and Yamamoto Multivariate Causality Test
The results of the TY estimation are depicted in Table 7. The results showed the existence of a bidirectional Granger-causality between exports and imports for South Africa. This means that these variables reinforce each other. This is because the null hypothesis of Granger no-causality from imports to exports and exports to imports were rejected for South Africa. In the case of South Africa, since the rejection of no-causality is proved by the rejection of the null hypothesis, thus, the existence of Granger causality would be confirmed by the rejection of the null hypothesis. In addition, the results showed the existence of a uni-directional causality from real GDP per capita growth rate to imports and a uni-directional causality from real GDP per capita growth rate to exports respectively for South Africa. Therefore, there is overwhelming evidence of the import-led export hypothesis, export-led import hypothesis, growth-led export (GLE) hypothesis and growth-led import hypothesis for South Africa. This suggests that the implementation of imports and exports promotion policies would reinforce imports and exports, and the South African Government should embark on economic growth policies necessary to expand imports and exports.
However, the results revealed the existence of a bi-directional relationship between imports and real GDP per capita growth rate on one hand and a one-way causality from exports to imports for Algeria. In addition, the results revealed a bi-directional relationship between imports and exports for Nigeria on one hand and a uni-directional causality from exports to real GDP growth rate, on the other hand, suggesting evidence of export-led growth (ELG) hypothesis for Nigeria. Furthermore, a one-way causality from imports to real GDP per capita growth rate and exports to real GDP per capita growth rate was revealed for Egypt respectively. The uni-directional causality running from exports to real GDP per capita growth rate indicates the existence of export-led growth (ELG) hypothesis for Egypt. The arrows indicating the direction of causality between the variables is depicted in Table 8.
Table-7. Results of the granger causality test (TY Augmented Lags Methods).
Sources of Causation |
|||
| Country/Dependent Variable | PCGRGDP x2 |
IMPGS x2 |
EXPGS x2 |
| South Africa PCGRGDP IMPGS EXPGS |
- 5.637409 7.464190 |
158.59066*** - 149.1578*** |
38.49540*** 25.42370*** - |
| Algeria PCGRGDP IMPGS EXPGS |
- 18.55539*** 6.881905 |
19.22163*** - 19.67463*** |
7.873544 3.055033 - |
| Nigeria PCGRGDP IMPGS EXPGS |
- 1.916780 2.961885* |
1.284925 - 13.63466*** |
0.786227 2.756613* - |
| Egypt PCGRGDP IMPGS EXPGS |
- 57.72067*** 50.49091*** |
5.629681 - 3.304317 |
5.658699 3.936121 - |
Note: ***, ** and * Indicate significance at the 1 per cent, 5 per cent and 10 per cent respectively.
Table-8. The causality results among IMPGS, PCGRGDP, and EXPGS for South Africa, Algeria, Nigeria and Egypt.
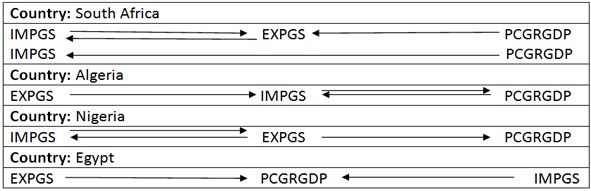
Note: Arrows indicate the direction of Granger Causality between the variables.
5. CONCLUSION AND RECOMMENDATIONS
The development of a dynamic export sector has the potential to transform the entire economic and social fabric of any economy. Besides its capacity for income generation, platforms provided by it in the past forty years have played a pivotal role in the development agenda of numerous developing countries tagged as successful. Furthermore, it has the capacity to narrow the gaps created by insufficient savings and inadequate foreign exchange in most developing countries to increase economic growth. Based on empirical results, these major findings emerged: The long-run results revealed that exports had a positive and significant relationship with growth in Algeria and Nigeria. However, exports exerted a positive and insignificant effect on economic growth in South Africa and Egypt. In the short-run, exports had a positive and significant relationship with economic growth in Algeria. In addition, exports exerted a positive and insignificant effect on economic growth in Nigeria and Egypt. Nevertheless, exports had a negative effect on economic growth in South Africa.
Based on the Granger causality results, whereas uni-directional causality runs from exports to real GDP per capita growth rate in Nigeria and Egypt; the uni-directional causality from real GDP per capita growth rate to exports of goods and services exist for South Africa. The export-led growth (ELG) hypothesis was valid for Nigeria and Egypt. On the other hand, the growth-led export (GLE) hypothesis was valid for South Africa. However, there was no evidence of either an ELG hypothesis or GLE hypothesis for Algeria. The policy implications are that exports were a major driver of economic growth in the Nigerian and Egyptian economies. This result is as a result of Egypt's and Nigeria's dynamic trade policies and involvement in world trade. In addition, it emphasizes the relevance of export promotion measures and firm macroeconomic policies. Hence, an appropriate strategy for these economies to grow will be the application of export promotion policies. On the other hand, a particular level of growth will be a precondition for South Africa to increase its exports.
The key policy recommendations that can be drawn from this study are as follows: The governments should discourage the consumption of non-productive imports through restrictive trade policy measures with a view to conserving international reserves, the technological base of these economies should be boosted through educational development with a view to reducing reliance on developed economies for import of productive foreign technologies, the spate of political instabilities should be discouraged through democratic ideals with a view to attracting foreign investors in the export sector, there is a need for infrastructural development in the energy and transport sectors which would lead to capital formation and economic growth by attracting foreign investors, the Nigerian and Egyptian governments should continue with export-led development strategies, in order to sustain the export-led growth strategy, there is a need for diversification of exports in South Africa, the South African government should continue with growth-led development strategies, in order to sustain the growth-led export strategy, stabilization of the exchange rate, some of the regulatory agencies like the customs management should ensure through their supervisory activities and surveillance that these economies do not become the dumping ground for unproductive consumer goods from developed economies, and there is a need for the diversification of Nigeria's export base away from oil to exports of solid minerals using revenues from oil.
6. LIMITATIONS OF THE STUDY
Under the overview of exports in Nigeria, the graph depicting the growth rate of Nigeria's export was plotted from 1982-2016 instead of 1980-2016. This was caused by the non-availability of data on the export growth rate for 1980 and 1981 respectively. Besides, the data was extracted from WDI and were only available up to 2016. Data on some of the variables were available for some countries in 2017 while others were not available. This prevented us from extending the study to 2018.
Funding: This study received no specific financial support. |
Competing Interests: The authors declare that they have no competing interests. |
Acknowledgement: Both authors contributed equally to the conception and design of the study. |
REFERENCES
Abou-Sait, F., 2005. Are exports the engine of economic growth? An application of cointegration and causality analysis for Egypt, 1977-2003. Economic Research Working Paper No 76, African Development Bank.
Abu-Qarn, A.S. and S. Abu-Bader, 2004. The validity of the ELG hypothesis in the MENA region: Cointegration and error correction model analysis. Applied Economics, 36(15): 1685-1695.Available at: https://doi.org/10.1080/0003684042000266865.
Abual-Foul, B., 2004. Testing the export-led growth hypothesis: Evidence from Jordan. Applied Economics Letters, 11(6): 393-396.Available at: https://doi.org/10.1080/1350485042000228268.
Adelegan, J.O., 2000. Foreign direct investment and economic growth in Nigeria: A seemingly unrelated model. Milan, Italy: African Review of Money, Finance and Banking, Supplementary Issues of ‘’Savings and Development. pp: 5-25.
Afxentiou, P.C. and A. Serletis, 1991b. Exports in the Canadian economic development: 1926-1983. Economic Notes, 20(2): 354-366.
Ahmad, J. and A.C. Kwan, 1991. Causality between exports and economic growth: Empirical evidence from Africa. Economics Letters, 37(3): 243-248.
Al-Yousif, Y.K., 1999. On the role exports in the economic growth of Malaysia: A multivariate analysis. International Economic Journal, 13(3): 67-75.Available at: https://doi.org/10.1080/10168739900080022.
Angomoko, B.B., 2017. The effect of Chinese economic growth on South Africa’s exports to China. An Unpublished Master of Commerce in Economics, University of South Africa.
Anyanwu, J.C. and A.E.O. Erhijakpor, 2009. Education expenditure and school enrolment in Africa: Illustrations from Nigeria and other SANE countries. Proceeding of the Nigerian Economic Society Conference 2007. Ibadan, Nigeria. pp: 219-40.
Atoyebi, K.O., A.O. Jubril, A.O. Felix and F. Edun, 2012. Foreign trade and economic growth in Nigeria: An empirical analysis. American Academic and Scholarly Research Journal 4(5): 1.
Balassa, B., 1978a. Exports and economic growth: Further evidence. Journal of Development Economics, 5(2): 181-189.
Balassa, B., 1985. Exports, policy choices, and economic growth in developing countries after the 1973 oil shock. Journal of Development Economics, 18(1): 23-35.Available at: https://doi.org/10.1016/0304-3878(85)90004-5.
Barro, R.J. and X. Sala-i-Martin, 1995. Economic growth. New Delhi: McGraw-Hill.
Brenton, P. and P. Walkenhorst, 2010. Impacts of the rise of China on developing country trade: Evidence from North Africa. African Development Review, 22: 577-586.Available at: https://doi.org/10.1111/j.1467-8268.2010.00265.x.
Brika, S. and L. Mekarssi, 2016. Analysis of Algerian trade performance: From 1970 to 2014. Journal of Behavioural Economics, Finance, Entrepreneurship, Accounting and Transport, 4(1): 13-17.
Broda, C. and C. Tille, 2003. Coping with terms-of-trade shocks in developing countries. Current Issues in Economics and Finance, 9(11): 1-7.
Cassim, R., D. Onyango and D.E. Van Seventer, 2004. The state of trade policy in South Africa. Available from http://www.tips.org.za.
Chanthunya, C.I., 1992. Trade regime and economic growth: Special reference to Zambia and Malawi. Unpublished Ph.D. Thesis, University of Wales.
Chenery, H.B., 1979. Structural change and development policy. New York: Oxford University Press.
Chimobi, O.P. and U.C. Uche, 2010. Export, domestic demand and economic growth in Nigeria: Granger causality analysis. European Journal of Social Sciences, 13(2): 211-218.
Chow, P.C., 1987. Causality between export growth and industrial development: Empirial evidence from the NICs. Journal of Development Economics, 26(1): 55-63.Available at: https://doi.org/10.1016/0304-3878(87)90051-4.
CIA World Fact Book, 2019. Economy of Egypt. United States: Central Intelligence Agency.
Cipamba, P.C.W., 2013. The export-output relationship in South Africa: An empirical investigation. Economic Research Southern Africa (ERSA) Working Paper 355:1–20.
Dasgupta, D., 1998. The macroeconomy. London: Oxford University Press.
Department of Research and Information, 2013. South African economy: An overview of key trends since 1994. South Africa: Industrial Development Corporation. Available from: https://www.idc.co.za › wp-content › uploads › 2018/11 › IDC-RI-publicat.
Department of Trade and Industry, 2009. South African trade policy and strategic framework, Pretoria. Available from www.tralac.org › files › 2012/12 › Trade-Policy-and-Strategy-Framework.
Dolado, J.J. and H. Lütkepohl, 1996. Making Wald tests work for cointegrated VAR systems. Econometric Reviews, 15(4): 369-386.Available at: https://doi.org/10.1080/07474939608800362.
Duru, I.U., 2013. Exports and economic growth in Nigeria: An empirical investigation, 1970-2013. An Unpublished Ph.D Economics Thesis of the Department of Economics, Faculty of Social Sciences, University of Abuja, Nigeria.
Dutt, S.D. and D. Ghosh, 1994. The export growth-economic growth nexus: A causality analysis. Journal of Developing Areas, 30(2): 167-182.
Eboreime, O. and D. Umoru, 2016. An econometric estimation of Nigeria’s export competitiveness in the global market. European Scientific Journal, 12(7): 396-417.Available at: https://doi.org/10.19044/esj.2016.v12n7p396.
Economist Intelligence Unit, 2014. Egypt: A country profile. Central Intelligence Agency World Stock Exchange.
Egypt Exports, 2019. Available from http://www.tradingeconomics.com [Accessed 12/07/16].
Ekpo, A.H. and U.J. Afangideh, 2009. Global economy in crisis: A re-thinking of received economic doctrine with some evidence from Nigeria.
Ekpo, A.H. and F.O. Egwaikhide, 1994. Export and economic growth: A reconsideration of the evidence. Journal of Economic Management, 2(1): 57-73.
Engle, R.F. and C.W.J. Granger, 1987. Cointegration and error correction: Representation estimation and testing. Econometrica, 55(2): 251–276.Available at: https://doi.org/10.2307/1913236.
Fajana, 1977. Demand shortages: A case study of selected food imports in Nigeria. The Nigerian Journal of Economic and Social Studies, 19(1): 109-120.
Forgha, N.G. and N.A. Aquilas, 2015. The impact of timber exports on economic growth in Cameroon: An econometric investigatio. Asian Journal of Economic Modelling, 3(3): 46-60.
Fosu, A.K., 1990. Export composition and the impact of exports on economic growth of developing economies. Economics Letters, 34(1): 67-71.Available at: https://doi.org/10.1016/0165-1765(90)90183-2.
Geweke, J., R. Meese and W. Dent, 1983. Comparing alternative tests of causality in temporal systems: Analytic results and experimental evidence. Journal of Econometrics, 21(2): 161-194.Available at: https://doi.org/10.1016/0304-4076(83)90012-x.
Granger, C.W., 1988. Some recent development in a concept of causality. Journal of Econometrics, 39(1-2): 199-211.Available at: https://doi.org/10.1016/0304-4076(88)90045-0.
Granger, C.W.J., 1969. Investigating causal relationships by economic models and cross spectral models. Econometrica, 37(3): 424–438.Available at: https://doi.org/10.2307/1912791.
Grosman, G. and E. Helpman, 1991. Innovation and growth in the global economy. Cambridge: MIT Press.
Gujarati, D.N., 2006. Essential of econometrics. 3rd Edn., New York: McGraw-Hill International.
Hart, O., 1983. The market mechanism as an incentive scheme. Bell Journal of Economics, 14(2): 366-382.Available at: https://doi.org/10.2307/3003639.
Henriques, I. and P. Sadorsky, 1996. Export-led growth or growth-driven exports? The Canadian case. Canadian Journal of Economics, 29(3): 540-555.Available at: https://doi.org/10.2307/136249.
International Monetary Fund, 2013. Staff Report for the year 2013, Article IV Consultation. May 22-June 4, 2013 Pretoria, Johannesburg and Cape Town, South Africa. Available from www.treasury.gov.za › publications › other › South Africa 2013 Article IV.
Jibrilla, A., 2014. Export-led growth hypothesis: Evidence from Nigeria. An Unpublished Master’s of Science Degree in Applied Econometrics Thesis of the Kingston University, London, United Kingdom.
Johansen, S., 1991. Estimation and hypothesis testing of cointegration vectors in gaussian vector autoregressive models. Econometrica, 59(6): 1551–1580.Available at: https://doi.org/10.2307/2938278.
Johansen, S. and K. Juselius, 1990. Maximum likelihood estimation and inference on cointegration—with applications to the demand for money. Oxford Bulletin of Economics and Statistics, 52(2): 169-210.Available at: https://doi.org/10.1111/j.1468-0084.1990.mp52002003.x.
Jun, M.Z., 2013. Export and economic growth: The case of China. An Unpublished Thesis for the Degree of Master of Social Sciences at the University of Macau.
Kaberuka, W., E.T. Rwakinanga and W. Tibessigwa, 2014. Is export-led-growth hypothesis valid in Uganda? A cointegration and causality analysis (1960-2010). Issues in Business Management and Economics, 2(4): 060-073.
Kasekende, L.A., T.W. Oshikoya, P.O. Ondiege and B.Z. Danash, 2007. Competitiveness and investment climate in SANE Economies, chapter 1.3 in. The Africa Competitiveness Report" World Economic Forum. Available from: https://members.weforum.org/pdf/ger/africa/1.3.pdf. [Accessed 15/07/17].
Kavoussi, R.M., 1984. Export expansion and economic growth: Further empirical evidence. Journal of Development Economics, 14(1): 241-250.
Kromtit, M.J., C. Kanadi, D.P. Ndangra and S. Lado, 2017. Contribution of non oil exports to economic growth in Nigeria (1985-2015). International Journal of Economics and Finance, 9(4): 253-261.Available at: https://doi.org/10.5539/ijef.v9n4p253.
Krueger, A., 1978. Foreign trade regimes and economic development: Liberalization attempts and consequences. New York: National Bureau of Economic Research.
Krugman, P., 1987. The narrow moving band, the Dutch disease, and the competitive consequences of Mrs. Thatcher: Notes on trade in the presence of dynamic scale economies. Journal of Development Economics, 27(1-2): 41-55.Available at: https://doi.org/10.1016/0304-3878(87)90005-8.
Kwan, A.C.C. and J. Cotsomitis, 1990. Economic growth and the expanding export sector: China 1952-1985. International Economic Review, 5(1): 105-117.Available at: https://doi.org/10.1080/10168739100080008.
Lal, D., 1992. Development economics. Brookfield: Elgar Publishers.
Lal, D. and S. Rajapatirana, 1987. Foreign trade regimes and economic growth in developing countries. The World Bank Research Observer, 2(2): 189-217.Available at: https://doi.org/10.1093/wbro/2.2.189.
Lam, T.-D., 2016. An empirical analysis of the ASEAN-4’s causality between exports and output growth. International Journal of Economics and Financial Issues, 6(2): 497-502.
Langley, K.M., 1968. The external resource factor in Nigerian economic development. The Nigerian Journal of Economic and Social Studies, 10(2): 155-181.
Library of Congress Federal Research Division, 2008. Country profile: Algeria. Available from https://www.loc.gov › frd › profiles › Algeria.
Lucas, R.E.J., 1988. On the mechanics of economic development. Journal of Monetary Economics, 22(1): 3-42.
Maddala, G.S., 2001. Introduction to econometrics. 3rd Edn., England: John Wiley and Sons, Inc.
Manap, T.A.A. and N.S. Shirazi, 2004. Export-led growth hypothesis: Further econometric evidence from Pakistan. Pakistan Development Review, 43(4): 563-581.
Manwa, F., 2015. Impact of trade liberalisation on economic growth: The case of the Southern African customs union (SACU) countries. PhD thesis, Southern Cross University, Lismore, NSW.
Matemvu, B., 1997. Causal relationship between exports and economic growth in selected SADC countries. Unpublished M.A. Thesis, Chancellor College, University of Malawi.
Merza, E., 2007. Oil exports, non-oil exports and economic growth: Time series analysis for Kuwait (1970-2004). An Unpublished Ph.D Economics Dissertation, Kansas State University, Manhattan, Kansas.
Michele, A. and E.B. Michael, 2010. The trade specialization of SANE: Evidence from manufacturing industries. The European Journal of Comparative Economics, 7(1): 145-178.
Mordi, C.N.O., A. Englama and B.S. Adebusuyi, 2010. The changing structure of the Nigerian economy. Lagos: Atisele Vanessa Cards Co.
Mosikari, T.J. and M.N. Sikwila, 2013. The relationship between trade openness and GDP growth rate: The case of South Africa (1994Q1-2008Q4). Journal of Economics and Behavioural Studies, 5(10): 669-677.
Musinguzi, P., B.M. Obwona and J.D. Stryker, 2000. Monetary and exchange rate policy in Uganda. African Economic Policy Discussion Paper, Number 23. Economic Policy Research Centre, Kampala.
Musonda, I., 2007. Is economic growth led by exports in Zambia. Lusaka, Zambia: Ministry of Finance and National Planning – Planning and Economic Management.
Narayan, P.K., 2004. Reformulating critical values for the bounds F-statistics approach to cointegration: An application to the tourism demand model for Fiji. Department of Economics Discussion Papers, Working Paper No. 02/04.
Njikam, O., 2003. Exports and economic growth in Sub-Saharan Africa: Is there a connection? Cameroon: University of Yaoundé.
Nyasulu, T., 2013. Assessing the impact of exports and imports on economic growth: A case study of Malawi from 1970 to 2010”. An Unpublished Master’s of Economics in Development Studies thesis of the Institute of Social Development, Faculty of Economic and Management Sciences, University of the Western Cape.
Ojo, M.O., 1998. Export development in Nigeria: An appraisal of strategies, acievements and the prospects. Central Bank of Nigeria Research Department’s Seminar Paper No.6.
Okoh, R.N., 2004. Global integration and the growth of Nigeria’s non-oil exports Paper Presented at the African Conference 21-22, March, Oxford, UK.
Oladipo, O.S., 1998. Trade liberalization and economic growth. Ife Social Science Review, 15(1): 80-92.
Onayemi, S. and I. Akintoye, 2009. Diversifying the productive base of Nigeria, an econometric approach to the assessment of non-oil export promotion strategies. International Research Journal of Finance and Economics, 24(1): 209-222.
Onudugo, V.A., M. Ikpe and O.F. Anowor, 2013. Non-oil export and economic growth in Nigeria: A time series econometric model. International Journal of Business Management and Research, 3(2): 115-124.
Oshikoya, T.W., 2007. The SANE as Africa’s growth poles. AFDB development briefing note 1. Tunisia: African Development Bank.
Oxley, L., 1993. Cointegration, causality and export-led growth in Portugal, 1865–1985. Economics Letters, 43(2): 163-166.Available at: https://doi.org/10.1016/0165-1765(93)90030-g.
Papageorgiou, C. and N. Spatafora, 2012. Economic diversification in LICs: Stylized facts and macroeconomic implications”. IMF Staff Discussion Note, SDN 12/13: 1-22.
Pesaran, M.H. and Y. Shin, 1999. An autoregressive distributed lag modelling approach to cointegration analysis. Econometrics and Economic Theory in the 20th Century: The Ragnar Frisch Centennial Symposium. Cambridge:Cambridge University Press, chapter 11.
Pesaran, M.H., Y. Shin and R.J. Smith, 2001. Bounds testing approaches to the analysis of level relationships. Journal of Applied Econometrics, 16(3): 289-326.Available at: https://doi.org/10.1002/jae.616.
Prebisch, R., 1950. The economic development of Latin America and its principal problems. New York: United Nations.
Ram, R., 1985. Exports and economic growth: Some additional evidence. Economic Development and Cultural Change, 33(2): 415-425.Available at: https://doi.org/10.1086/451468.
Rambaldi, A.N. and H.E. Doran, 1996. Testing for granger non-causality in cointegrated systems made easy, Working Papers in econometrics and applied statistics. England: Department of Econometrics, the University of New England, No. 88.
Rangasamy, L., 2009. Exports and economic growth: The case of South Africa. Journal of International Development: The Journal of the Development Studies Association, 21(5): 603-617.Available at: https://doi.org/10.1002/jid.1501.
Riezman, R.G., P.M. Summers and C.H. Whiteman, 1996. The engine of growth or its handmaiden? A time series asessment of export-led growth. Empirical Economics, 21(1): 77-113.
Romer, P.M., 1986. Increasing returns and long-run growth. Journal of Political Economy, 94(5): 1002-1037.Available at: https://doi.org/10.1086/261420.
Romer, P.R., 1990. Are non-convexities important for understanding growth? American Economic Review, 80(2): 97-103.
Salvatore, D. and T. Hatcher, 1991. Inward oriented and outward oriented trade strategies. The Journal of Development Studies, 27(3): 7-25.Available at: https://doi.org/10.1080/00220389108422201.
Samen, S., 2010. A primer on export diversification: Key concepts, theoretical underpinnings and empirical evidence. Growth and Crisis Unit, World Bank, Washington DC. Available from https://blogs.worldbank.org/files/growth/EXPORT_DIVERSIFICATION_A_PRIMER_May2010%281%29.pdf [Accessed 17/09/18].
Sanni, G.K., 2006. Nigeria’s foreign trade and the new perspectives for its Enhancement. Central Bank of Nigeria Bullion.
Sentsho, J., 2000. Export revenues as determinants of economic growth: Evidence from Botswana. Gaborane, Botswana: University of Botswana.
Serletis, A., 1992. Export growth and Canadian economic development. Journal of development Economics, 38(1): 133-145.Available at: https://doi.org/10.1016/0304-3878(92)90022-2.
Shan, J. and F. Sun, 1998a. Export-led growth hypothesis for Australia: An empirical re-investigation. Applied Economics Letters, 5(7): 423-428.Available at: https://doi.org/10.1080/135048598354555.
Sims, C.A., J.H. Stock and M.W. Watson, 1990. Inference in linear time series models with some unit roots. Econometrica, 58(1): 113-144.Available at: https://doi.org/10.2307/2938337.
Singer, H.W., 1950. The distributions of gains between investing and borrowing countries. The American Economic Review, 40(2): 473-485.
Sleptsova, E., 2010. Exports from Ukraine to the European Union: Macro, micro and political economy determinants. An Unpublished Ph.D Thesis of the Centre for Russian and East European Studies, School of Social Sciences, The University of Birmingham.
South African Revenue Services, 2002. Annual report and financial statements 2001/2002. South Africa: SARS. Available from http://www.sars.gov.za › AllDocs › SARSEntDoclib › SARS-AR-04 - Annual Re.
Subramanian, A. and G. Jonsson, 2001. Dynamics gains from trade: Evidence from South Africa. IMF Sta Papers N0 08/48.
Thliza, A.P., 2007. Expanding trade for sustainable development in Nigeria: Issues, prospects and challenges. Bullion, 31(1): 52-73.
Thornton, J., 1997. Exports and economic growth: Evidence from Nineteenth Century Europe. Economics Letters, 55(2): 235-240.Available at: https://doi.org/10.1016/s0165-1765(97)00074-8.
Toda, H.Y. and P.C.B. Phillips, 1993. Vector autoregressions and causality. Econometrica, 61(6): 1367-1393.
Toda, H.Y. and T. Yamamoto, 1995. Statistical inference in vector autoregressions with possibly integrated processes. Journal of Econometrics, 66(1-2): 225-250.Available at: https://doi.org/10.1016/0304-4076(94)01616-8.
Todaro, M. and P. Smith, 2009. Economic development. 11th Edn., Massachusetts: Addison-Wesley-Longman.
Tyler, W.G., 1981. Growth and export expansion in developing countries: Some empirical evidence. Journal of development Economics, 9(1): 121-130.
Verter, N. and V. Bečvářová, 2016. The impact of agricultural exports on economic growth in Nigeria. Acta Universitatis Agriculturae et Silviculturae Mendelianae Brunensis, 64(2): 691-700.Available at: https://doi.org/10.11118/actaun201664020691.
Vincent, K., 2017. An analysis of the impact of non-oil exports and economic growth in Nigeria from 1980 – 2016. International Journal of Innovative Research in Social Sciences & Strategic Management Techniques, 4(2): 83-94.
Vohra, R., 2001. Export and economic growth: Further time series evidence from less-developed countries. International Advances in Economic Research, 7(3): 345-350.Available at: https://doi.org/10.1007/bf02295403.
Wong, H.T., 2008. Exports and domestic demand: Some empirical evidence in ASEAN-5. Labuan Bulletin of International Business and Finance, 6: 39-55.Available at: 10.1.1.502.1313.
World Bank, 1995. World tables 1995. Baltimore, MD: Johns Hopkins University Press. Available from http://documents.worldbank.org/curated/en/281731468337205948/World-tables-1995.
Yaghmaian, B., 1994. An empirical investigation of exports, development, and growth in developing countries: Challenging the neoclassical theory of export-led growth. World Development, 22(12): 1977-1995.Available at: https://doi.org/10.1016/0305-750x(94)90187-2.
APPENDICES
Appendix 1: Data set on GDP Per Capita Growth Rate of SANE Countries.
Table-9. Data on PCGRGDP of SANE countries.
Year |
South Africa |
Algeria |
Nigeria |
Egypt |
1980 |
3.957183396 |
-2.21654997 |
1.2693165 |
7.3387601 |
1981 |
2.695113303 |
-0.12945619 |
-15.454782 |
1.192139697 |
1982 |
-2.918474204 |
3.13164697 |
-3.5952268 |
7.15090514 |
1983 |
-4.318571181 |
2.15985601 |
-7.4275512 |
4.659530018 |
1984 |
2.534528856 |
2.38980068 |
-4.468617 |
3.324883919 |
1985 |
-3.515164406 |
0.61163051 |
5.5820749 |
3.765187038 |
1986 |
-2.186854567 |
-2.51751778 |
-11.09884 |
-0.14338943 |
1987 |
-0.043365065 |
-3.5091435 |
-13.064542 |
-0.29833613 |
1988 |
2.055652256 |
-3.71175235 |
4.7500479 |
2.441610351 |
1989 |
0.247872981 |
1.64641531 |
3.7218425 |
2.237271643 |
1990 |
-2.493040934 |
-1.74678553 |
9.8949143 |
3.11381883 |
1991 |
-3.27744285 |
-3.58853186 |
-3.1158045 |
-1.22682776 |
1992 |
-4.43038328 |
-0.54738955 |
-2.0667969 |
2.199957873 |
1993 |
-1.127588019 |
-4.23219326 |
-0.4332008 |
0.818331847 |
1994 |
0.933127297 |
-2.91256612 |
-1.5748138 |
1.943238246 |
1995 |
0.985944465 |
1.85342379 |
-2.758613 |
2.641009755 |
1996 |
2.33636902 |
2.30508724 |
2.4133166 |
3.017657081 |
1997 |
0.863426945 |
-0.5082453 |
0.2759086 |
3.549320972 |
1998 |
-1.102548046 |
3.54478629 |
0.1888747 |
2.141894785 |
1999 |
0.798244546 |
1.75801111 |
-2.0023771 |
4.174958141 |
2000 |
2.629545602 |
2.4278757 |
2.7142907 |
3.439696362 |
2001 |
1.281027976 |
1.67647584 |
1.8217275 |
1.615120371 |
2002 |
2.254363334 |
4.27945303 |
1.200834 |
0.448033695 |
2003 |
1.603997922 |
5.85052083 |
7.5898866 |
1.25092589 |
2004 |
3.257225779 |
2.9432323 |
30.356582 |
2.156831224 |
2005 |
4.041077965 |
4.45275224 |
0.8046647 |
2.578956712 |
2006 |
4.439916026 |
0.21097167 |
5.422785 |
4.966033533 |
2007 |
4.256749263 |
1.7991969 |
4.0537147 |
5.234633028 |
2008 |
2.116509918 |
0.7139528 |
3.4921574 |
5.282444412 |
2009 |
-2.617337614 |
-0.10159976 |
4.1261868 |
2.755735398 |
2010 |
1.813628664 |
1.76368202 |
4.9998333 |
3.091669379 |
2011 |
1.942602704 |
0.93035517 |
2.1190936 |
-0.34131477 |
2012 |
0.796403155 |
1.32110931 |
1.5240856 |
-0.01428269 |
2013 |
1.019058245 |
0.69635367 |
2.6146256 |
-0.08356444 |
2014 |
0.405051486 |
1.7332809 |
3.5196242 |
0.668288269 |
2015 |
-0.097301741 |
1.79025396 |
-0.0222352 |
2.18436429 |
2016 |
-0.734889635 |
1.43140344 |
-4.1601066 |
2.263270591 |
Appendix-2. Data Set on Imports of Goods and Services of SANE Countries.
Table-10. Data on IMPGS of SANE countries.
Year |
South Africa |
Algeria |
Nigeria |
Egypt |
1980 |
26.54576964 |
30.3384617 |
19.1961398 |
42.86598 |
1981 |
29.41741229 |
30.8777429 |
26.1058046 |
48.80485 |
1982 |
26.02022242 |
28.9980749 |
19.9146647 |
41.93254 |
1983 |
20.34705822 |
25.8023112 |
12.5010114 |
36.42946 |
1984 |
22.92732945 |
27.4663675 |
7.90344982 |
35.81252 |
1985 |
21.86958899 |
26.7421877 |
8.51485994 |
32.04153 |
1986 |
21.07732891 |
23.1719532 |
10.4007277 |
25.59443 |
1987 |
19.70511093 |
18.4121097 |
14.7048067 |
22.76629 |
1988 |
21.90257 |
22.6037194 |
12.4573538 |
35.16113 |
1989 |
20.72376273 |
28.5140564 |
16.4104445 |
32.3514 |
1990 |
18.1877172 |
24.9370286 |
17.6859713 |
32.71329 |
1991 |
16.95276775 |
23.5997645 |
23.1755177 |
35.79569 |
1992 |
16.78372159 |
23.86949 |
23.5215962 |
30.91301 |
1993 |
17.29819269 |
23.1389364 |
24.2799866 |
30.09021 |
1994 |
19.29476677 |
26.0537125 |
17.9986417 |
28.05714 |
1995 |
21.47534006 |
28.9962292 |
24.0063412 |
27.69608 |
1996 |
22.58706515 |
23.9446996 |
25.4524262 |
26.19878 |
1997 |
22.85793118 |
21.3376001 |
35.0853943 |
24.89658 |
1998 |
23.89156288 |
22.5160965 |
36.4817252 |
25.71329 |
1999 |
22.16667685 |
22.778999 |
21.9768588 |
23.30949 |
2000 |
24.27889391 |
20.7886258 |
19.6501705 |
22.81682 |
2001 |
25.42680549 |
22.0168577 |
36.3647781 |
22.33064 |
2002 |
27.98379975 |
25.6296317 |
27.4179466 |
22.67089 |
2003 |
24.51676993 |
23.875943 |
35.4310029 |
24.38323 |
2004 |
25.61093793 |
25.6481997 |
18.2873785 |
29.58994 |
2005 |
26.70245124 |
24.0734044 |
19.0913882 |
32.6091 |
2006 |
31.00337066 |
21.9193259 |
21.4979844 |
31.56872 |
2007 |
32.50923678 |
24.8699634 |
30.7343877 |
34.82814 |
2008 |
37.24295217 |
28.7111769 |
25.0898447 |
38.63763 |
2009 |
27.50637343 |
35.9526777 |
31.0342381 |
31.59662 |
2010 |
27.37375583 |
31.4221139 |
17.3872693 |
26.5871 |
2011 |
29.65169022 |
28.6853216 |
21.4642997 |
24.68821 |
2012 |
31.17582008 |
28.5144314 |
12.9413891 |
24.3148 |
2013 |
33.2704187 |
30.4009258 |
12.9989534 |
23.35519 |
2014 |
32.9658559 |
31.9266593 |
12.4500677 |
22.67606 |
2015 |
31.4441028 |
36.5464586 |
10.6663422 |
21.6621 |
2016 |
30.08792761 |
35.2702838 |
11.5044092 |
19.67594 |
Source: World Bank, World Development Indicators Database.
Appendix 3: Data Set on Exports of Goods and Services of SANE Countries
Table-11. Data on EXPGS of SANE countries.
Year |
South Africa |
Algeria |
Nigeria |
Egypt |
1980 |
34.3411524 |
34.33846 |
29.3751744 |
30.5146377 |
1981 |
27.4705639 |
34.58725 |
22.1875176 |
33.3718237 |
1982 |
25.6185924 |
30.92486 |
17.8338376 |
27.0343088 |
1983 |
23.9562583 |
27.94181 |
14.5361609 |
25.4820025 |
1984 |
24.6880039 |
25.71002 |
15.7054326 |
22.3512479 |
1985 |
30.4421459 |
23.58393 |
17.3852037 |
19.914283 |
1986 |
29.6015918 |
12.85476 |
13.3160286 |
15.7315668 |
1987 |
29.3086909 |
14.27247 |
26.9418556 |
12.5587106 |
1988 |
28.188242 |
15.50787 |
22.8546247 |
17.3183872 |
1989 |
25.8672601 |
18.63926 |
43.9813166 |
17.8934794 |
1990 |
23.4949209 |
23.44369 |
35.3442495 |
20.0475985 |
1991 |
21.0980438 |
29.11782 |
41.701081 |
27.8156014 |
1992 |
20.7037368 |
25.31959 |
37.5093769 |
28.3968368 |
1993 |
21.8251292 |
21.78388 |
33.8298623 |
25.8376289 |
1994 |
21.4741865 |
22.53073 |
24.3102283 |
22.5714286 |
1995 |
22.1355986 |
26.19478 |
35.7614931 |
22.5490196 |
1996 |
24.0802633 |
29.76045 |
32.238568 |
20.749782 |
1997 |
23.9873307 |
30.90631 |
41.7745967 |
18.8416698 |
1998 |
25.0050548 |
22.57835 |
29.6915199 |
16.2143354 |
1999 |
24.6952092 |
28.15012 |
33.8695326 |
15.0520156 |
2000 |
27.15888 |
42.06972 |
51.7303607 |
16.2011173 |
2001 |
29.3748279 |
36.6893 |
45.448071 |
17.4797881 |
2002 |
31.7808365 |
35.50453 |
35.9656906 |
18.3161784 |
2003 |
26.8850612 |
38.24883 |
39.7878996 |
21.7964072 |
2004 |
25.4670962 |
40.05323 |
30.1607522 |
28.2299608 |
2005 |
26.4466642 |
47.20519 |
31.6569711 |
30.3435469 |
2006 |
29.2738937 |
48.81069 |
43.1113296 |
29.9498138 |
2007 |
31.1738505 |
47.06816 |
33.728521 |
30.2497315 |
2008 |
35.6224381 |
47.97335 |
39.8831292 |
33.0429927 |
2009 |
27.9118882 |
35.37165 |
30.7686162 |
24.9568221 |
2010 |
28.6152369 |
38.44455 |
25.2641156 |
21.3492458 |
2011 |
30.4609415 |
38.78695 |
31.3298052 |
20.5674276 |
2012 |
29.7238794 |
36.89055 |
31.4387476 |
16.3969666 |
2013 |
30.9713411 |
33.2099 |
18.0499066 |
17.0178456 |
2014 |
31.4686452 |
30.21912 |
18.4351261 |
14.2441315 |
2015 |
30.1560456 |
23.18644 |
10.631935 |
13.1838455 |
2016 |
30.7025974 |
21.00176 |
14.533531 |
10.3454639 |
Source: World Bank, World Development Indicators Database.
Appendix 4a: Graph of Diagnostic Tests for South Africa.
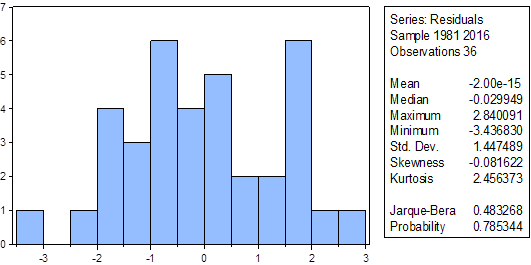
Figure-5a. Histogram for normality of residuals for South Africa.
Source: Extract from E-views econometric software.
Appendix 4b: Graph of Diagnostic Tests for Algeria.
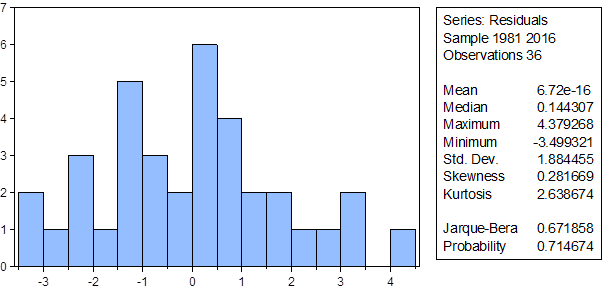
Figure-5b. Histogram for normality of residuals for Algeria.
Source: Extract from E-views econometric software.
Appendix 4c: Graph of Diagnostic Tests for Nigeria
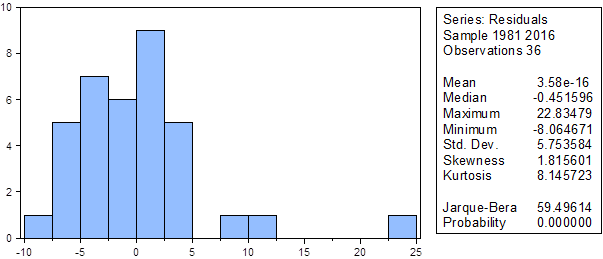
Figure-5c. Histogram for normality of residuals for Nigeria.
Source: Extract from E-views econometric software.
Appendix 4d: Graph of Diagnostic Tests for Egypt
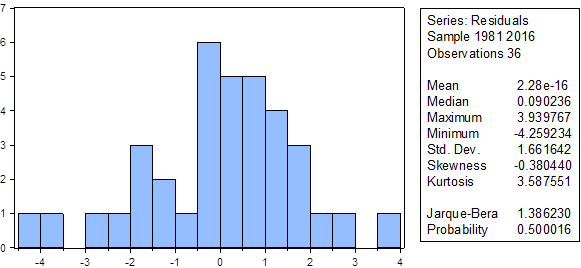
Figure-5d. Histogram for Normality of Residuals for Egypt.
Source: Extract from E-views econometrics software.
Appendix 5: The Relative Importance of SANE Economies
Table-12. The Relative Importance of SANE Economies.
SANE ECONOMIES |
REST OF AFRICA |
|||||||
| Indicators | South Africa |
Algeria |
Nigeria |
Egypt |
SANE |
Landlocked |
Coastal |
Total |
| Land Area (thousand Km2) | 1,221 |
2,382 |
924 |
1001 |
5528 |
10,324 |
14,455 |
30,307 |
| Share of Africa (%) | 5.8 |
11 |
4.4 |
4.7 |
4 |
34 |
46.7 |
100 |
| Population (millions) | 48 |
33 |
134 |
75 |
291 |
284 |
349 |
924 |
| Share of Africa (%) | 5 |
4 |
15 |
8 |
32 |
31 |
38 |
100 |
| Nominal GDP (US$ billions) | 262 |
128 |
120 |
104 |
613 |
95 |
385 |
1,093 |
| Share of Africa (%) | 24 |
12 |
11 |
10 |
56 |
9 |
35 |
100 |
| GDP (US$ billions PPP) | 605 |
256 |
186 |
327 |
1,373 |
326 |
905 |
2,605 |
| Share of Africa (%) | 23 |
10 |
7 |
13 |
53 |
13 |
35 |
100 |
| Annual GDP Growth Rate 1981-2018 (%) | 2 |
3 |
4 |
5 |
26.3 |
5 |
4 |
4 |
| Investment ratio, gross capital formation, % of GDP) | ||||||||
| Gross National Savings (% of GDP) | 19 |
31 |
20 |
18 |
21 |
21 |
20 |
21 |
| Foreign Reserves (US$ billions) | 13 |
56 |
36 |
20 |
28 |
17 |
26 |
23 |
| Share of Africa (%) | 23 |
82 |
49 |
23 |
176 |
15 |
122 |
314 |
| Trade Balance (US$ billions) | 7 |
26 |
16 |
7 |
56 |
5 |
39 |
100 |
| Current Account Balance (US$ billions) | 4 |
40 |
33 |
-11 |
57 |
2 |
17 |
72 |
| Share of African Exports (%) | 14 |
31 |
19 |
2 |
38 |
3 |
24 |
35 |
| Share of African Imports (%) | 16 |
16 |
16 |
5 |
52 |
6 |
42 |
100 |
| Export Growth 1982-2016 (%) | 23 |
8 |
10 |
10 |
50 |
9 |
41 |
100 |
| Import Growth 1982-2016 (%) | 3 |
2 |
6 |
6 |
4 |
6 |
4 |
4 |
| FDI (US$ millions) | 4 |
3 |
4 |
4 |
4 |
5 |
4 |
4 |
| Share of Africa (%) | 6,379 |
1,081 |
3,403 |
5,376 |
16,239 |
3,459 |
10,971 |
30,669 |
21 |
4 |
11 |
18 |
53 |
11 |
36 |
100 |
|
Source: Oshikoya (2007![]() ) and Authors Compilation based on World Bank’s World Development Indicators and AFDB Socio Economic Database.
) and Authors Compilation based on World Bank’s World Development Indicators and AFDB Socio Economic Database.
Appendix 6: Annual GDP per capita growth for SANE and African Economies, 1975-2019 (in percentage)
Table-13. Annual GDP per capita growth for SANE and African Economies, 1975-2019 (in percentage).
1975-1979 |
1980-1984 |
1985-1989 |
1990-1994 |
1995-1999 |
2000-2004 |
2005-2009 |
2010-2014 |
2015-2019 |
1.3 |
-0.3 |
0.4 |
-2.1 |
1.7 |
2.3 |
2.7 |
2.0 |
1.0 |
2.5 |
-0.1 |
0.6 |
-0.5 |
1.4 |
2.3 |
4.8 |
3.7 |
2.6 |
0.0 |
0.4 |
-0.9 |
-1.8 |
0.3 |
2.2 |
3.6 |
2.5 |
1.0 |
3.7 |
0.9 |
-1.4 |
-2.6 |
1.8 |
2.6 |
3.0 |
3.3 |
3.4 |
-0.8 |
-6.4 |
2.7 |
0.7 |
-0.1 |
2.7 |
6.4 |
6.3 |
1.3 |
7.2 |
4.8 |
1.9 |
1.5 |
3.5 |
1.9 |
6.1 |
2.6 |
4.6 |
Source: Michele and Michael (2010![]() ) and Authors Compilation based on AFDB Socio Economic Database.
) and Authors Compilation based on AFDB Socio Economic Database.
Appendix 7: Economic Indicators for the SANE and BRIC Economies (2005)
Table-14. Economic Indicators for the SANE and BRIC Economies (2005).
| Economies | Population (millions) |
National GDP (US$ billions) |
GDP per capita (US$) |
FDI (US$ millions) |
| SANE Economies | ||||
| South Africa | 48 |
240 |
5,100 |
6,379 |
| Algeria | 33 |
102 |
3,086 |
1,081 |
| Nigeria | 134 |
99 |
678 |
3,403 |
| Egypt | 75 |
93 |
1,315 |
5,376 |
| Total | 290 |
534 |
10,178 |
16,239 |
| Average GDP per capita income | 1,841 |
|||
| BRIC Economies | ||||
| Brazil | 184 |
792 |
4,315 |
15,066 |
| Russia | 143 |
763 |
5,348 |
14,600 |
| India | 1,094 |
775 |
714 |
6,598 |
| China | 1,308 |
2,225 |
1,703 |
72,406 |
| Total | 2,729 |
4,555 |
12,080 |
108,270 |
| Average GDP per capita income |
1,669 |
|||
Source: Kasekende et al. (2007![]() )
)
Views and opinions expressed in this article are the views and opinions of the author(s), Asian Development Policy Review shall not be responsible or answerable for any loss, damage or liability etc. caused in relation to/arising out of the use of the content. |