


PORTFOLIO ANALYSIS ON DISTANCE EDUCATION FACULTY MEMBERS

1,2Management Section, School of Distance Education, Universiti Sains Malaysia.
ABSTRACT
This paper examines the faculty members of distance education on their performance in relation to the BCG portfolio analysis. The faculty members were examined on their number of publications during the periods of 2010 to 2018; namely a lady boss (2010-2013) vs. a male boss (2014-2018). The process of data mining was done by using Google Scholar and faculty members’ website hosted by the school. Data analyses were done through the interpretation of data by using the matrix of the number of publications and number of years. The data was plotted on the BCG portfolio analysis in the quadrants, namely cash cow, star, question mark, dog, and in between quadrants. The plotting of the faculty members on the quadrants give a crystal clear to the head of the department on the historical evidence of faculty members performance in the past 9 years. Moreover, the information presented would be useful for the head of the department in determining the directions and directives toward achieving the school's key performance index by the end of 2019.
Keywords:Portfolio analysis, BCG matrix, Faculty members, Distance education, Higher education.
ARTICLE HISTORY: Received:1 February 2019 Revised:8 March 2019 Accepted:10 April 2019Published:29 May 2019 .
Contribution/ Originality:This paper examines the faculty members of distance education on their performance in relation to the BCG portfolio analysis.
1. INTRODUCTION
The school's top management, especially, the Head of Department (HOD) has to take charge of a given department. The person has been entrusted by the university's top management to carry out the duties for the university's ranking and the good name of the school. In the context of the Malaysian public universities, the school is required to fulfill their Key Performance Index (KPI) based on the Malaysian Research Assessment Instrument (MyRA) as determined by the Ministry of Education Malaysia (MOE). Thus, the HOD also known as the Dean has a vital responsibility in making sure the school’s KPI meet and even exceeded the KPI benchmarked of the school.
Interestingly, the KPI is not entrusted to specific faculties of the school, but it is based on the overall contribution of the school’s faculties on their yearly works. This paper will examine the KPI contributions of distance education faculties based on their number of publications. As for MyRA, there are eight items are being assessed on the KPI. This paper will only examine one item which is on the “quantity and quality of the researcher”. Moreover, the quantity and quality of the researcher will be examined using the management's concept of portfolio analysis. The objective of this paper is to associate the type of faculties based on the BCG portfolio analysis quadrants, namely cash cow, star, question mark, dog, and in between quadrants. The faculty’s publications from 2010 to 2018 will be calculated and examined in fitting into the BCG portfolio analysis quadrants. Furthermore, the objective is hoped to illuminate and assist the distance education school to identify each faculties’ type. By knowing the type, the school can consider several measures and programs to work with the faculties in getting them to work toward achieving the school’s KPI as stated in the MyRA for item “quantity and quality of researcher”.
2. LITERATURE REVIEW
The section of the literature review will elaborate on the earlier works, MyRA, and BCG portfolio analysis.
2.1. Earlier Works
Prior to this paper, a paper was published in The International Journal Of Business & Management (ISSN 2321–8916) Vol 5 Issue 5 in May 2017 with the title, Organizational Analysis: Case of a Leading Distance Education Provider in Malaysia. The objective of the paper was to relate the management’s organizational analysis toward faculties’ publication in 2015 and 2016 as their deliverables toward the school’s KPI (Asaari, 2017![]() ).
).
“This paper focuses on a case, a leading distance education provider, in Malaysia. The provider will be examined on its organizational analysis, namely its strengths and weaknesses. Moreover, the analysis will be on the number of publications produced by the provider's lecturers in 2015 and 2016 as deliverables toward their Key Performance Indicators (KPI). The distance education provided had the manpower of 76 lecturers in various programs, namely Science, Social Sciences, Arts, and Management. Positively, this paper contributes to views and suggestions in boosting the distance education provider's 2017 KPI and views on the distance education provider's leadership” (Asaari, 2017![]() ).
).
Moreover, the school has been providing a distance education programs for almost 50 years since 1971. They had provided well-known programs throughout the nation.
"The distance education provider had almost 7,000 undergraduate students (Universiti Sains Malaysia, 2016![]() ) who were registered under various programs and majors. There are four programs with thirteen majors. Firstly, Bachelor of Science (Honours) with majors in Biology, Chemistry, Physics, and Mathematics. Secondly, Bachelor of Social Sciences (Honours) with majors in Anthropology-Sociology, Political Science, and Economics. Thirdly, Bachelor of Arts (Honours) with majors in Geography, History, and Literature. Finally, Bachelor of Management (Honours) with majors in Organization, Marketing, and Finance” (Asaari, 2017
) who were registered under various programs and majors. There are four programs with thirteen majors. Firstly, Bachelor of Science (Honours) with majors in Biology, Chemistry, Physics, and Mathematics. Secondly, Bachelor of Social Sciences (Honours) with majors in Anthropology-Sociology, Political Science, and Economics. Thirdly, Bachelor of Arts (Honours) with majors in Geography, History, and Literature. Finally, Bachelor of Management (Honours) with majors in Organization, Marketing, and Finance” (Asaari, 2017![]() ).
).
As the conclusion of the paper, it was stated the HOD needs to work hand-in-hand with the faculties in achieving the school’s KPI.
“Being a leader in almost 50 years of establishment, even the oldest in the country that provides distance education, then it would not be an easy task to him/her to lead an educated team. Nonetheless, the appointed leader must outshine and excel his/her leadership by allowing he/she is accepted and trusted by the team of lecturers. Moreover, the leader must be seen taking charge of the ship toward the distance education provider's and the University's vision and mission, which is achieving the KPI as needed with the contributions of lecturers of the oldest distance education provider in the country. Realistically, the 2017 KPI is possible to be delivered as lecturers play their role and responsibility as needed and required” (Asaari, 2017![]() ).
).
2.2. Malaysian Research Assessment Instrument
Malaysian Research Assessment Instrument (MyRA) has been established by the Ministry of Higher Education Malaysia (MOHE) in 2006. The MyRA has the sprint of making an assessment on the performance of the public universities in the country. The MyRA’s objectives are as quoted below:
"…to meet the Malaysian Research University (MRU) agenda of the Ministry of Higher Education (MOHE) and that was to identify 5 universities in Malaysia for the award of the MRU status. Today, the MRU agenda is well enshrined in the National Higher Education Strategic Plan (PSPTN) 2007-2020, which is to elevate the standing of public higher education institutions to attain world-class status and to create differentiated higher education scenarios to meet the socio-economic aspirations of the country while being cognizant of the limited resources available to pursue such goals. Thus MyRA was used to accreditation and monitor the research performance of public universities, but beginning in 2014, all higher education institutions in the country were mandated to participate in the annual assessment exercise to coincide with the opening up of MOHE research grants to all universities (public or private) in the country” (USM, 2016![]() ).
).
Furthermore, the MyRA has been used to confer public and private higher education institutions in the country through a rating system. The rating system comprises of a 6-Star rating.
“Between March and October 2015, 27 auditors audited a total of 58 HEIs, and on the 30th of November 2015, at an inaugural gala ceremony, the Minister of Higher Education presented congratulatory certificates to all HEIs that achieved 3-Star rating and above for their 2014 MyRA assessment” (USM, 2016![]() ; Asaari, 2017
; Asaari, 2017![]() ).
).
Currently, there are two criteria for MyRA, namely MyRA I and MyRA II. Table 1 depicts the differences between MyRA I and MyRA II (USM, 2016![]() ).
).
Table-1. Criteria for MyRA I and MyRA II.
MyRA I |
MyRA II |
||||||
No |
Section |
Assessment Area |
% |
No |
Section |
Assessment Area |
% |
1 |
A |
General Information |
- |
1 |
A |
General Information |
- |
2 |
B |
Quantity and Quality of Researchers |
25 |
2 |
B |
Quantity and Quality of Researchers |
15 |
3 |
C |
Quantity and Quality of Research |
30 |
3 |
C |
Quantity and Quality of Research |
35 |
4 |
D |
Quantity of Postgraduates |
10 |
4 |
D |
Quantity and Quality of Postgraduates |
10 |
5 |
E |
Quality of Postgraduates |
5 |
5 |
E |
Innovation |
15 |
6 |
F |
Innovation |
10 |
6 |
F |
Professional Services and Gifts |
10 |
7 |
G |
Professional Services and Gifts |
7 |
7 |
G |
Networking and Linkages |
12 |
8 |
H |
Networking and Linkages |
8 |
8 |
H |
Support Facilities |
3 |
9 |
I |
Support Facilities |
3 |
||||
Source: USM (2016![]() ).
).
Meanwhile, Table 2 depicts the star rating system based on the MyRA’s scores.
Table-2. Star Rating and Range.
Star Rating |
Range |
Nil |
>= 0 to < 15 |
★ |
>= 15 to < 30 |
★★ |
>= 30 to < 45 |
★★★ |
>= 45 to < 60 |
★★★★ |
>= 60 to < 75 |
★★★★★ |
>= 75 to < 100 |
★★★★★★ |
>= 100 to < 156.71 |
Note: Maximum marks for MyRA I is 156.71.
For this paper, the analysis on faculties will be on their “quantity and quality of researchers” that relates to the number of publications from 2010 to 2018.
2.3. BCG Portfolio Analysis
In the context of a company’s products or services, portfolio analysis is defined as:
A product portfolio is the collection of all the products or services offered by a company. Product portfolio analysis can provide nuanced views on the stock type, company growth prospects, profit margin drivers, income contributions, market leadership, and operational risk. This is essential for investors conducting equity research by investors or analysts supporting internal corporate financial planning (Chen, 2018![]() ).
).
Moreover, portfolio analysis is also defined in the context of commerce as an analysis of elements of a company's product mix to determine the optimum allocation of its resources. Two most common measures used in a portfolio analysis are market growth rate and relative market share (Business Dictionary, 2018![]() ).
).
The portfolio analysis using the BCG Growth-Share Matrix (BCG Matrix) which was developed by the Boston Consulting Group. In the context of business institutions, the BCG Matrix is used by the companies’ strategic business units (SBUs) in assessing their product. The product assessment is measured based on the product’s market growth rate and relative market share.
“The Boston Growth-Share Matrix (BCG Matrix)…was developed by the Boston Consulting Group (BCG), which is a leading management consulting group and is today the best-known and most popular portfolio analysis and portfolio planning method. The Boston Matrix classifies all the companies SBUs according to the attractiveness of the SBUs industry or market, which is measured in terms of market growth rate, and the SBUs position in that industry or market, measured in terms of relative market share the company has. On the vertical axis, the market growth rate provides a measure for the attractiveness of the SBUs market. On the horizontal axis, relative market share measures the company's strength in that market" (Claessens, 2015![]() ).
).
The BCG Matrix comprises 4 quadrants, namely cash cow, star, question mark, and dog. The market growth and relative market share of each SBU lead to a classification into one of four categories as elaborated below by (Claessens, 2015![]() ):
):
- Stars are high-growth, high-share products or businesses. Those often require heavy investments to finance their rapid growth. Once their growth slows down, which will eventually be the case, Stars will turn into Cash Cows.
- Cash Cows are low-growth, but high-share products or businesses. They need less investment to hold their market share, being well-established and successful SBUs. Therefore, Cash Cows produce a lot of cash which the company can use to invest in and support other SBUs that need investments to finance their growth, namely Question Marks and Stars.
- Question Marks are low-share Strategic Business Units but in high-growth markets. To hold their share, not mentioning increasing it which would be desirable, Question Marks require a lot of cash. If Question Marks become a success, they will turn into Stars one day. However, the likelihood that they fail must not be neglected. For that reason, management has to decide carefully which Question Marks will receive attention and investment in order to build them into stars, and which other, less promising ones will be phased out.
- Dogs are low-growth, low-share businesses, and products. In other words, Dogs are the least desirable SBUs of a company. They may generate enough cash still to maintain themselves. However, Dogs will not be large sources of cash and should be phased out as soon as they become unprofitable or as soon as the firm can make better use of its resources to support other SBUs.
Figure 1 depicts the BCG portfolio analysis quadrants. Moreover, Claessens (2015![]() ) elaborates on the vertical axis, the market growth rate provides a measure for the attractiveness of the SBUs market. On the horizontal axis, relative market share measures the company's strength in that market.
) elaborates on the vertical axis, the market growth rate provides a measure for the attractiveness of the SBUs market. On the horizontal axis, relative market share measures the company's strength in that market.
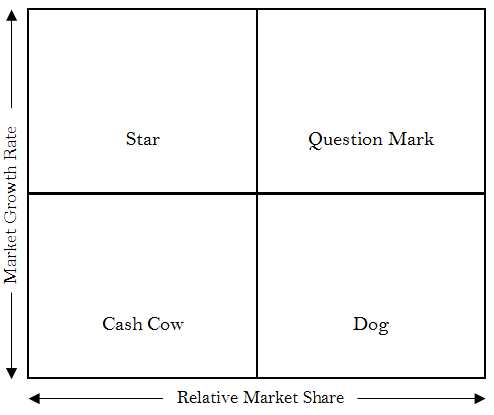
Figure-1. BGC Matrix Quadrants.
Source: Claessens (2015![]() ).
).
Moreover, the idea of having a portfolio analysis for a company is to determine the optimal allocation of available resources (Markowitz, 1959![]() ). He stated that:
). He stated that:
“Portfolio analysis involves quantification of the operational and financial impact of the investment portfolio, to evaluate the performance of the investment or product against set investment goals, and time returns effectively. Such quantification and evaluation of performance help achieve the best trade-off between risk tolerance and returns. It is used to (1) analyze existing business portfolio to separate efficient and inefficient portfolios, (2) decide whether businesses or projects require more investment, less investment, or scrapping, and (3) develop strategies to fuel growth by adding new products and/or businesses to the portfolio as well as dropping some existing investment products and businesses” (Markowitz, 1959![]() ).
).
3. METHODOLOGY
3.1. Population
The study's population is the faculty members of the school. The school has 86 faculty members who are in various fields, namely science, humanities, social sciences, management, and university course.
3.2. Administration Periods
Data mining period is collected between 2010 to 2018. There are two phases of different administration from 2010 to 2013 by a lady boss for 4 years with a humanities field. On the other hand, from 2014 to 2018 is a male boss for 5 years with a science field.
3.3. Data Mining
Data mining of faculty members were done by using the Google Scholar for the list of their publications from 2010 to 2018. The faculty name was keyed in the Google Scholar’s search in obtaining their list of publications captured by Google Scholar. Data from the Google Scholar needs to be cleaned as some faculty members had other scholars’ works in their list of publications due to similar last names. On the other hand, there were some faculty members who had made their data in Google Scholar as "invisible". As an alternative, their personal website hosted by the school has been visited in obtaining their list of publications. These list of publications were posted by the faculty members personally. Unfortunately, for those faculty members who had no record from the Google Scholar and personal website, they were considered as having no publications between 2010 to 2018.
3.4. Portfolio Analysis and Faculty Members
Although the concept of BCG Portfolio Analysis (BCG) is on the product assessment which is measured based on the product’s market growth rate and relative market share (Claessens, 2015![]() ) but the original concept is adapted and adopted in the analyzing the faculty members as "products" of the school. These faculty members were further analyzed based on their number of publications in the years 2010 to 2018.
) but the original concept is adapted and adopted in the analyzing the faculty members as "products" of the school. These faculty members were further analyzed based on their number of publications in the years 2010 to 2018.
The faculty members’ years of publications were analyzed based on their number of years publishing and not publishing between 2010 to 2018. The analysis was done by taking into consideration the number of years publishing against the number of years not published by the faculty members in the period of 9 years. Thus, the faculty members can have a range of analysis category of years in the form of 9:0 (9 years publishing; 0 years not publishing) to 0:0 (0 years publishing; 0 years not publishing). Furthermore, Table 3 depicts the analysis was categorized based on the BCG status, namely cash cow, star, question mark, and dog. Moreover, the BCG category could be in between the various status, namely cash cow-star, cash cow-dog, star-question mark, question mark-dog, cash cow-question mark, star-dog based also on the faculty members’ performance in their years of publishing or not publishing.
Table-3. Faculty Members’ BCG Status.
Years Publishing |
Years Not Publishing |
BCG Status |
9 |
0 |
Cash cow |
7 |
2 |
Cash cow-Star |
6 |
3 |
Cash cow-Question Mark |
5 |
4 |
Cash cow-Dog |
4 |
5 |
Star |
3 |
6 |
Star-Question Mark |
2 |
7 |
Star-Dog |
3 |
6 |
Question mark |
1 |
8 |
Question mark-Dog |
0 |
9 |
Dog |
3.5. Data Analysis
Table 4 depicts the comparison on the quantity of publication in the period 2010 to 2018 between the two Head of Department (HOD): the lady boss vs. the male boss. The lady boss held the office from 2010 to 2013 for 4 years which clocks 788 publications by faculty members. On the other hand, a male boss held the office from 2014 to 2018 for 5 years which clocks 737 publications by faculty members. The difference of 51 publications (6% drop) was recorded between the lady boss and male boss over the period of 9 years. Moreover, under the administration of the lady boss, she had an average total of 197 publications per year as compared to the male boss with a total of 148 publications per year.
Table-4. Publications Quantity (2010-2018).
Head of Department |
Periods |
Years |
n |
n/year |
Lady Boss |
2010-2013 |
4 |
788 |
197 |
Male Boss |
2014-2018 |
5 |
737 |
148 |
Difference |
51 |
|||
Percentage Difference |
6% |
|||
3.6. Faculty Members
The school has 86 faculty members as of December 2018. They were divided into various sections, namely the sciences, humanities, social sciences, management, and university course as depicted in Figure 2.
Firstly, Sciences Section has 4 fields, namely Science Biology with 8 faculty members (9.3%), Science Physic with 7 faculty members (8.1%), Science Chemistry with 8 faculty members (9.3%), and Science Mathematics with 6 faculty members (7.0%). Secondly, Social Sciences Section has 3 fields, namely Anthropology-Sociology with 8 faculty members (9.3%), Economic with 7 faculty members (8.1%), and Political Sciences with 7 members (8.1%). Thirdly, Humanities Section has 3 fields, namely Geography with 6 faculty members (7.0%), History with 7 faculty members (8.1%), and Literature with 3 faculty members (3.5%). Fourthly, Management Section has 15 faculty members (17.4%). Finally, the University Course Section has 4 faculty members (4.7%).
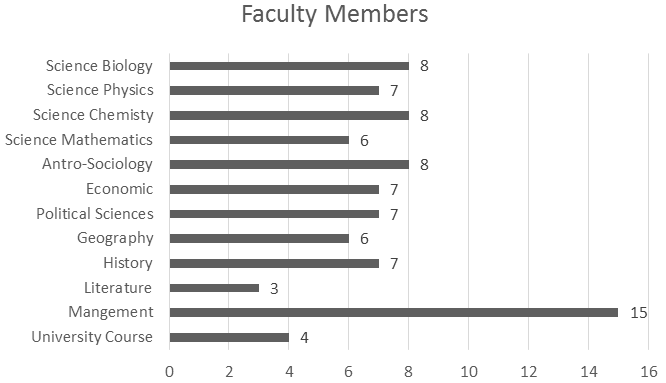
Figure-2. Number of Faculty Members.
Furthermore, the faculty members of the school can be divided into various academic ranks, namely senior lecturer, associate professor, and professor. Table 5 depicts the academic rank of faculty members. Majority of the faculty members were Senior Lecturers with 61 faculty members (70.9%). Followed by Associate Professors with 18 faculty members (20.9%) and Professor with 7 faculty members (8.1%).
Table-5. Academic Rank of Faculty Members.
Academic Rank |
n |
% |
Senior Lecturer |
61 |
70.9 |
Associate Professor |
18 |
20.9 |
Professor |
7 |
8.1 |
Total |
86 |
100 |
3.7. Publications
Analysis of publication by faculty members was made based on their academic ranks, and academic sections; namely, sciences, humanities, social sciences, management, and university course as depicted in Table 6. The analyses were done based on the head of department’s (HOD) administration which between the lady boss from 2010 to 2013 and the male boss from 2014 to 2018.
During the 9 years period, the faculty members had published a total of 1,525 publications in various journals, books, chapters in books, etc. The lady boss’ periods (2010-2013) had a total of 788 publications by faculty members. On the other hand, the male boss’ periods (2014-2018) had a total of 737 publications. Thus, there was a difference of 51 publications (6%) between the two HODs.
Figure 3 depicts the line chart from 2010 to 2018 on the number of publications per year by the school’s faculty members (n=86). The pattern of the faculty members’ number of publications per year had been roller coaster ever since. During the lady boss administration from 2010 to 2013 (n=4), the number of publications was on an upward trend in 2010 to 2012 (n of 2010=171, 2011=213, and 2012=216). Unfortunately, the faculty members’ number of publications was in a downward trend in 2013 (n of 2012=216 vs. n of 2013=188).
Table-6. Publications by Academic Ranks.
HOD |
Year |
Senior Lecturer |
Associate Professor |
Professor |
Total |
Lady Boss |
2010 |
60 |
48 |
63 |
788 |
2011 |
80 |
38 |
95 |
||
2012 |
92 |
50 |
74 |
||
2013 |
64 |
54 |
70 |
||
Male Boss |
2014 |
66 |
40 |
49 |
737 |
2015 |
71 |
35 |
46 |
||
2016 |
86 |
21 |
49 |
||
2017 |
115 |
39 |
33 |
||
2018 |
54 |
14 |
19 |
||
Total |
688 |
339 |
498 |
1,525 |
|
Percentage |
45% |
22% |
33% |
100% |
|
Difference |
51 |
||||
Percentage Difference |
6% |
||||
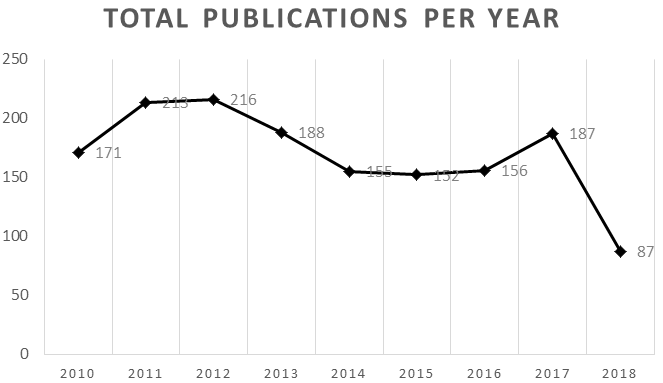
Figure-3. Publications per Year (2010-2018).
Meanwhile, during the male boss administration from 2014 to 2018 (n=5), the number of faculty members' publication has been plateaued in 2014 to 2016 (n of 2014=155, 2015=152, and 2016=156). In 2017, the number of faculty members' publication had risen from 156 to 187 with a difference of 31 additional publications. Unfortunately, the number of faculty members' publications had declined tremendously from 187 publications in 2017 to 87 publications in 2018 with a drop of 46.5%.
Table 7 depicts the publications by faculty members in the sciences section (n=29) from 2010 to 2018. During the lady boss' periods (2010-2013), they had a total of 377 publications by faculty members. On the other hand, the male boss' periods (2014-2018) had a total of 280 publications. Thus, there was a difference of 97 publications (26%) between the two HODs.
Table-7. Publications by Sciences Section.
HOD |
Year |
Biology |
Chemistry |
Physic |
Mathematics |
Total |
Lady Boss |
2010 |
26 |
25 |
28 |
8 |
377 |
2011 |
32 |
25 |
34 |
14 |
||
2012 |
36 |
7 |
28 |
20 |
||
2013 |
40 |
4 |
25 |
25 |
||
Male Boss |
2014 |
24 |
7 |
16 |
14 |
280 |
2015 |
15 |
2 |
21 |
12 |
||
2016 |
28 |
5 |
17 |
13 |
||
2017 |
16 |
5 |
18 |
22 |
||
2018 |
17 |
3 |
8 |
17 |
||
Total |
234 |
83 |
195 |
145 |
657 |
|
Percentage |
36% |
13% |
30% |
22% |
100% |
|
Difference |
97 |
|||||
Percentage Difference |
26% |
|||||
Figure 4 depicts the line chart from 2010 to 2018 on the number of publications per year for sciences section’s faculty members (n=29). During the lady boss administration from 2010 to 2013 (n=4), the number of publications among biology (n=8) faculty members was on an upward trend (n of 2010=26, 2011=32, 2012=36, and 2013=40). On the other hand, during the male boss administration, the biology faculty members were on a downward trend in 2014 (n=24) and 2015 (n=15). In 2016, there was a rebound for the biology faculty members with 28 publications. Unfortunately, they had a downward trend again in 2017 (n=16) and 2018 (n=17).
During the periods of the lady boss, physic (n=7) faculty members had a downward trend from 2011 to 2013 (n of 2011=34, 2012=28, 2013=25). On the other hand, they had not made an effort in their publications from 2014 to 2018 (n of 2014=16, 2015=21, 2016=17, 2017=18, and 2018=8) during the male boss periods.
During the lady boss periods (2010-2013), mathematics (n=6) faculty members had an upward trend in their publications with 2010=8, 2011=14, 2012=20, and 2013=25. Unfortunately, during the periods of the male boss, they had a downward trend in 2014 (n=14) to 2015 (n=12). Interestingly, they had clocked a good publications numbers in 2017 (n=22) as compared to 2018 (n=17).
Unfortunately, chemistry (n=8) faculty members had unstable publication years from 2010 to 2018 with downward and upward trends in their publications. Moreover, chemistry faculty members had the lowest number of publications as compared to mathematics, physics, and biology.
Table 8 depicts the publications by faculty members in the social sciences section (n=22) from 2010 to 2018. During the lady boss' periods (2010-2013), they had a total of 136 publications by faculty members. On the other hand, the male boss' periods (2014-2018) had a total of 154 publications. Thus, there was a difference of 18 publications (12%) between the two HODs.
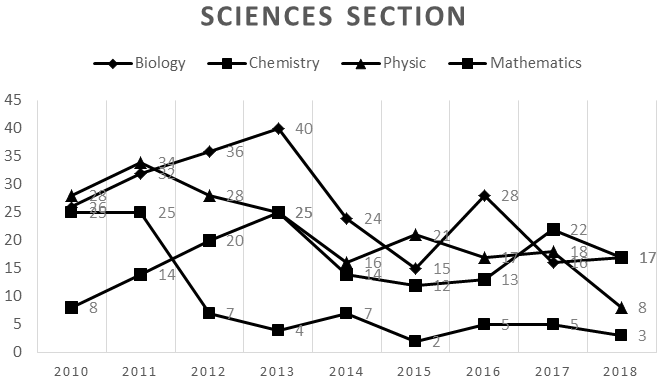
Figure-4. Publications by Sciences Section (2010-2018).
Table-8. Publications by Social Sciences Section.
HOD |
Year |
Anthropology- Sociology |
Economy |
Political Science |
Total |
Lady Boss |
2010 |
10 |
2 |
12 |
136 |
2011 |
17 |
8 |
9 |
||
2012 |
20 |
8 |
17 |
||
2013 |
4 |
9 |
20 |
||
Male Boss |
2014 |
11 |
8 |
14 |
154 |
2015 |
8 |
18 |
12 |
||
2016 |
1 |
10 |
8 |
||
2017 |
14 |
17 |
16 |
||
2018 |
8 |
1 |
8 |
||
Total |
93 |
81 |
116 |
290 |
|
Percentage |
32% |
28% |
40% |
100% |
|
Difference |
18 |
||||
Percentage Difference |
12% |
||||
Figure 5 depicts the line chart from 2010 to 2018 on the number of publications per year for social sciences (n=22) section’s faculty members. During the lady boss administration (2010-2013, n=4), the number of publications among anthropology-sociology (n=8) faculty members was on an upward trend (n of 2010=12, 2011=17, and 2012=20). Unfortunately, they had steep dive in 2013 (n=4) in the number of publications. On the other hand, during the male boss administration (2014-2018, n=5), the anthropology-sociology faculty members were on a downward trend in 2014 (n=11) but a downward trend in 2015 (n=8) and 2016 (n=1). Interestingly, anthropology-sociology faculty members had a rebound in 2017 (n=14), but poor publications in 2018 (n=8).
Economy (n=7) faculty members had an upward trend during the lady boss periods (2010-2013, n=4) were in 2010 (n=2) and an almost a stable trend from 2011 to 2013 (n of 2011=8, 2012=8, and 2013=9). On the other hand, during the male boss administration (2014-2018, n=5), the economy faculty members had positive publications in 2014 (n=11) but a roller coaster periods in 2015 to 2017 (n of 2015=18, 2016=10, 2017=17). Sadly, they had a bottom rock in 2018 with 1 publication.
Political sciences (n=7) faculty members had an upward trend during the lady boss periods (2010-2013, n=4) wherein 2010 (n=12) but drop to 9 publications in 2011. Interestingly, political sciences faculty members made a great effort in 2012 (n=17) and 2013 (n=20) on their total publications. On the other hand, during the male boss administration (2014-2018, n=5), the political sciences faculty members had downward trends from 2014 to 2016 (n of 2014=14, 2015=12, 2016=8). They made a rebound in 2017 with 16 publications. Unfortunately, political sciences faculty members had 50% between 2017 to 2018 (n=8).
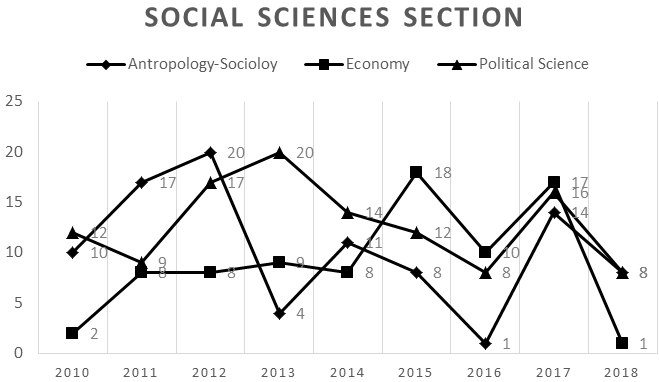
Figure-5. Publications by Social Sciences Section (2010-2018).
Table 9 depicts the publications by faculty members in the humanities (n=16) section from 2010 to 2018. During the lady boss’ periods (2010-2013), they had a total of 136 publications by faculty members. On the other hand, the male boss' periods (2014-2018) had a total of 149 publications. Thus, there was a difference of 13 publications (9%) between the two HODs.
Table-9. Publications by Humanities Section.
HOD |
Year |
History |
Geography |
Literature |
Total |
Lady Boss |
2010 |
5 |
19 |
1 |
136 |
2011 |
8 |
34 |
1 |
||
2012 |
16 |
26 |
2 |
||
2013 |
7 |
17 |
0 |
||
Male Boss |
2014 |
10 |
19 |
3 |
149 |
2015 |
13 |
22 |
1 |
||
2016 |
13 |
20 |
0 |
||
2017 |
15 |
25 |
0 |
||
2018 |
1 |
4 |
3 |
||
Total |
88 |
186 |
11 |
285 |
|
Percentage |
31% |
65% |
4% |
100% |
|
Difference |
13 |
||||
Percentage Difference |
9% |
||||
Figure 6 depicts the line chart from 2010 to 2018 on the number of publications per year for social sciences (n=16) section’s faculty members. During the lady boss administration (2010-2013, n=4), the number of publications among geography (n=6) faculty members was on an upward trend in 2010 (n=19) to 2011 (n=34). Unfortunately, in 2012 (n=26) and 2013 (n=17), geography faculty members had a downward trend in publications. On the other hand, during the male boss administration (2014-2018, n=5), the geography faculty members were on an upward and downward trends in 2014 to 2017 (n of 2014=19, 2015=22, 2016=20, and 2017=25). Unfortunately, there was a steep drop in publications among geography faculty members from 2017 (n=25) to 2018 (n=4).
History (n=7) faculty members had an upward trend during the lady boss periods (2010-2013, n=4) wherein 2010 (n=5), 2011 (n=8), and 2012 (n=16); unfortunately a downward trend in 2013 (n=7). On the other hand, during the male boss administration (2014-2018, n=5), the history faculty members had an upward trend in 2014 to 2017 (n of 2014=10, 2015 and 2016=13, respectively; and 2015=15); and surprisingly a steep downward trend in 2018 (n=1).
Literature (n=3) faculty members had flat trends during the lady boss periods (2010-2013, n=4) and the male boss administration (2014-2018, n=5). Literature section indicated not many efforts in their publications from 2010 to 2018. The most number of publications was in 2014 (n=3) and 2018 (n=3). The rest of the years was nil to 2 publications per year (n of 2012=2; 2010, 2011, and 2015 was 1 publication, respectively). Literature section had a poor performance in 2013, 2016, and 2017 with no publications, respectively.
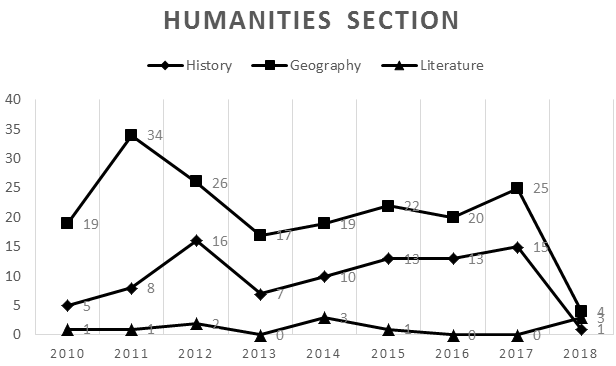
Figure-6. Publications by Humanities Section (2010-2018).
Table 10 depicts the publications by faculty members in the management (n=15) section from 2010 to 2018. During the lady boss' periods (2010-2013), they had a total of 115 publications by faculty members. On the other hand, the male boss' periods (2014-2018) had a total of 136 publications. Thus, there was a difference of 21 publications (15%) between the two HODs.
Table-10. Publications by Management Section.
HOD |
Year |
Management |
Total |
Lady Boss |
2010 |
25 |
115 |
2011 |
25 |
||
2012 |
33 |
||
2013 |
32 |
||
Male Boss |
2014 |
27 |
136 |
2015 |
27 |
||
2016 |
32 |
||
2017 |
34 |
||
2018 |
16 |
||
Total |
251 |
||
Difference |
21 |
||
Percentage Difference |
15% |
||
Figure 7 depicts the line chart from 2010 to 2018 on the number of publications per year for management (n=15) section's faculty members. During the lady boss administration (2010-2013, n=4), the number of publications among management faculty members was on the flat year of 2010 (n=25) and 2011 (n=25). Positively, the number of publications increased to 33 in 2012 and down by 32 in 2013. On the other hand, during the male boss administration (2014-2018, n=5), the management faculty members were also on flat years in 2014 and 2015 with 27 publications, respectively. The faculty members showed a positive attitude by having an uptrend publishing years in 2016 (n=32) and 2017 (n=34). Unfortunately, management faculty members had a steep fall in 2018 with 16 publications.
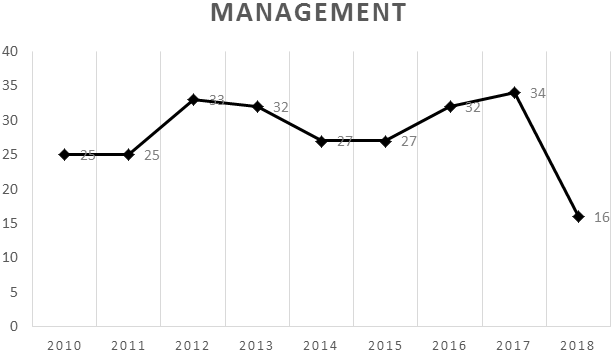
Figure-7. Publications by Management Section (2010-2018).
Table 11 depicts the publications by faculty members in the university course (n=4) section from 2010 to 2018. During the lady boss' periods (2010-2013), they had a total of 24 publications by faculty members. On the other hand, the male boss' periods (2014-2018) had a total of 18 publications. Thus, there was a difference of 6 publications (25%) between the two HODs.
Table-11. Publications by University Course Section.
HOD |
Year |
University Course |
Total |
Lady Boss |
2010 |
10 |
24 |
2011 |
6 |
||
2012 |
3 |
||
2013 |
5 |
||
Male Boss |
2014 |
2 |
18 |
2015 |
1 |
||
2016 |
9 |
||
2017 |
5 |
||
2018 |
1 |
||
Total |
42 |
||
Difference |
6 |
||
Percentage Difference |
25% |
||
Figure 8 depicts the line chart from 2010 to 2018 on the number of publications per year for university course (n=4) section's faculty members. During the lady boss administration (2010-2013, n=4), the number of publications among university course faculty members was on an avalanched from 2010 to 2012 (n of 2010=10, 2011=6, and 2012=3). They rebounded on their 2013 with 5 publications. On the other hand, during the male boss administration (2014-2018, n=5), the university course faculty members were also on an avalanched for the second time in 2014 (n=2) to 2015 (n=1). Interestingly, they made a rebound in 2016 with 9 publications. Unfortunately, they had another steep drop in 2017 (n=5) and 2018 (n=1).
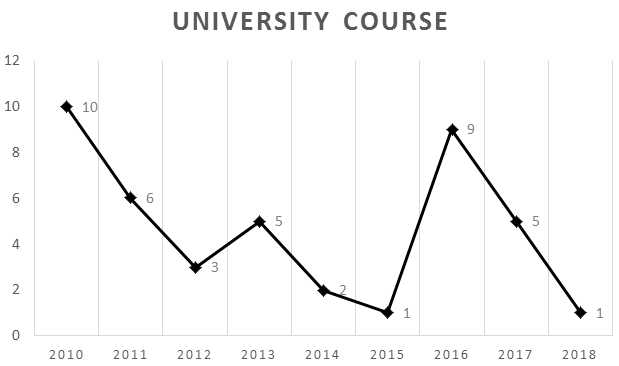
Figure-8. Publications by Management Section (2010-2018).
3.8. BCG Status for School’s Faculty Members
Table 12 depicts the list of faculty members in the school on their number of publishing and not publishing years for the period 2010 to 2018 in journals, books, chapter in books etc. These faculty members were categorized based on their efforts in the number of years publishing and not publishing according to the earlier methodology. Whereby, the faculty members can have a range of analysis category of years in the form of 9:0 (9 years publishing; 0 years not publishing) to 0:0 (0 years publishing; 0 years not publishing). Furthermore, then they will be given BCG status as cash cow, star, question mark, and dog. Firstly, thirty-four (40%) faculty members were categorized as cash cow, namely 14 faculty members in the sciences. This was followed by 7 faculty members in social sciences, 6 faculty members each in humanities and management, and one faculty member in university subject. Secondly, the faculty members were categorized as the star were 21 (24%). They were comprised of 6 faculty members in sciences. This was followed by 5 faculty members in social sciences and humanities, respectively; 4 faculty members in management, and one faculty member in university subject. Thirdly, the faculty members categorized as the dog were 10 (12%). They were comprised of 5 faculty members in sciences, 3 faculty members in social sciences, and one faculty member each in humanities and management. Fourthly, the faculty members categorized as the question mark were 9 (10%). They were comprised of 3 faculty members in sciences, 5 faculty members in social sciences, and 1 faculty member in management. Fifthly, the faculty members categorized as cash cow-star were 5 (6%). They were comprised of 1 faculty member in sciences, 3 faculty members each in humanities and management, and one in university subject. Sixthly, the faculty members categorized as cash cow-dog were 3 (3%). They were comprised of one faculty member each in social sciences, humanities and, management. Seventhly, the faculty members categorized as cash cow-question mark were 2 (2%). They were comprised of one faculty member each in social sciences and management. Eighthly, the faculty members categorized as star-dog was 1 (1%) in management. Finally, the faculty members categorized as question mark-dog were 1 (1%) in university subject.
Table-12. BCG Status of Faculty Member (2010-2018).
BCG Status |
Sciences |
Social Sciences |
Humanities |
Management |
University Subject |
Total |
% |
Cash cow |
14 |
7 |
6 |
6 |
1 |
34 |
40 |
Cash cow-Star |
1 |
3 |
1 |
5 |
6 |
||
Cash cow-Question mark |
1 |
1 |
2 |
2 |
|||
Cash cow-Dog |
1 |
1 |
1 |
3 |
3 |
||
Star |
6 |
5 |
5 |
4 |
1 |
21 |
24 |
Star-Dog |
1 |
1 |
1 |
||||
Question mark |
3 |
5 |
1 |
9 |
10 |
||
Question mark-Dog |
1 |
1 |
1 |
||||
Dog |
5 |
3 |
1 |
1 |
10 |
12 |
|
Total |
29 |
22 |
16 |
15 |
4 |
86 |
100 |
Figure 9 depicts the BCG status plotting of 86 faculty members on the BCG Portfolio Analysis in the quadrants, namely cash cow, star, question mark, and dog. Moreover, they were also plotted in between the quadrants, namely cash cow-star, cash cow-question mark, cash cow-dog, star-dog, and question mark-dog. The details of the 86 faculty members are listed in Appendix A.
Thirty-four faculty members who were classified as cash cow. This was followed by 21 faculty members as the star, 9 faculty members as the question mark, and 10 faculty members as dog. Moreover, there were several faculty members who were classified in between the quadrants, namely 5 faculty members as cash cow-dog, 2 faculty members as question mark-dog, 3 faculty members as cash cow-dog, and one faculty member each as star-dog and question mark-dog.
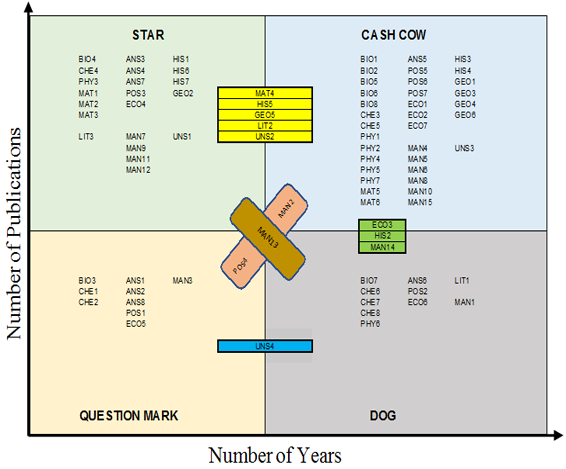
Figure-9. BCG Status Plotting of Faculty Members.
4. DISCUSSION
The BCG Portfolio Analysis of the faculty members of the school gives a good opportunity for self-reflection to the individual faculty member and the school’s management. Moreover, the analysis would help the school’s management to encourage their faculty members to work on their KPI, specifically in their publications in journals, books, chapter in books, etc.
The analysis provided a clear picture of every faculty members’ status and locations in their BCG Portfolio Analysis quadrants. Firstly, the school’s management needs to motivate 21 faculty members in the star quadrants to be industrious in their publications which in turn will place them in the cash cow quadrants.
Secondly, the school’s management needs to invest, support, and motivate the faculty members in the following quadrants, namely question mark with 9 faculty members, dog-star with one faculty member, dog-question mark with one faculty member, and dog with 10 faculty members; to be more industrious and being a star faculty members. This would further lead them to be placed in the cash cow faculty members in terms of their and the school’s KPI.
Thirdly, the school’s management needs to mobilize those faculty members who are in the following quadrants, namely star-cash cow with 5 faculty members, question mark-cash cow with 2 faculty members, and dog-cash cow with 3 faculty members, to be back on track of publishing and placed themselves as the cash cow faculty members.
Finally, not forgetting the 34 faculty members in the cash cow. They need to be kept motivated by the school’s management in ensuring them to churn more publications for the KPI.
Figure 10 depicts the flow of faculty members' status from quadrant to another quadrant. First phase, the mobilization of faculty members from quadrants; namely question mark, dog-question mark, dog-star, and dog into star will give a total of existing and new faculty members as a star status of 42. Subsequently, these 42 star faculty members will be motivated and nurtured to be in the cash cow status. Second phase, the mobilization of faculty members in star-cash cow, question mark-cash cow, and dog-cash cow into cash cow status. Finally, the motivation and support from the school toward all faculty members in their effort of publishing will be achieved as all, the 86, faculty members are in the cash cow status and contributing toward the school’s KPI.
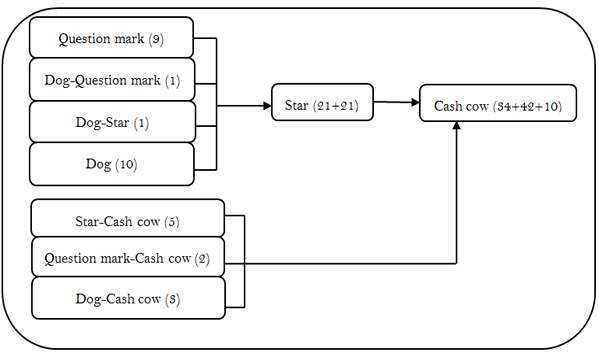
Figure-10. The Flow of Faculty Members Status.
Thus, the school would have all of their faculty members in the cash cow status as they contributed to the school's KPI through publications in the journals, books, chapter in books, etc. On the other hand, the top management of the school must provide psychological motivation among faculty members through self-reflection that they must fulfill their job description as faculty members by meeting the school's KPI in publications. Furthermore, the top management must provide relevant support and funding for the faculty members in publishing their works in journals. Most journals with the ISI, SCOPUS, and ERA status requires publication fees that ranges from USD250 to USD500 per publication.
Interesting discovery has been seen in the HOD periods, namely the lady boss (2010-2013) and the male boss (2014-2018). During the lady boss period, the number of publications was higher than the male boss (2014-2018). Interestingly, the lady boss is nominated as the new HOD for the periods of 2019 to 2021. It is expected that the level of teamwork and motivation among faculty members of the school will be elevated again toward achieving the school’s KPI. Moreover, the HOD needs to communicate her aspirations and motivations to faculty members of the school to work and support her during the tenure.
Moreover, the HOD needs to understand the nature of the faculty members’ in terms of McGregor’s Theory X and Y perspectives. There are faculty members that are considered as Theory X whereby they are “naturally lazy, want to avoid work as much as possible, do not wish to take responsibility, have no ambition and prefer to be supervised. The authoritarian leadership style is therefore the most appropriate leadership style in Theory X. According to this theory, pure work motivation consists of financial incentives. People want to avoid work and they must be continually coerced and controlled. Therefore, the system of rewards and punishments works best for them. Furthermore, their tasks and how these should executed must be laid down in detail. According to this theory, people definitely do not wish to bear any responsibility for their work” (Tools Hero, 2019![]() ). On the other hand, the HOD also needs to know the faculty members who are considered as the Theory Y that assumes “people are inherently happy to work , they want to exert themselves and they are motivated to pursue objectives. There is no need for the system that involves rewards and punishments. People are prepared to take responsibility for everything they do. People want to use their creativity and they like to take a creative problem solving approach (Tools Hero, 2019
). On the other hand, the HOD also needs to know the faculty members who are considered as the Theory Y that assumes “people are inherently happy to work , they want to exert themselves and they are motivated to pursue objectives. There is no need for the system that involves rewards and punishments. People are prepared to take responsibility for everything they do. People want to use their creativity and they like to take a creative problem solving approach (Tools Hero, 2019![]() ). Thus, the HOD should be able to identify faculty members who are dislike their work, avoid responsibility and need constant direction, need to be supervised at every step, have no incentive to work or ambition, and therefore need to enticed by rewards to achieve goals (Mind Tools, 2019
). Thus, the HOD should be able to identify faculty members who are dislike their work, avoid responsibility and need constant direction, need to be supervised at every step, have no incentive to work or ambition, and therefore need to enticed by rewards to achieve goals (Mind Tools, 2019![]() ). Subsequently, the HOD also should be able to identify faculty member who are happy to work on their own initiative, self-motivated to complete their tasks, enjoy taking ownership of their works, seek and accept responsibility, and need little direction (Mind Tools, 2019
). Subsequently, the HOD also should be able to identify faculty member who are happy to work on their own initiative, self-motivated to complete their tasks, enjoy taking ownership of their works, seek and accept responsibility, and need little direction (Mind Tools, 2019![]() ).
).
In the perspective of management by objective (MBO), the new HOD needs to aggressively embark on placing the strategic implementation among faculty members on their number of publications from 2019 to 2021. Moreover, the school has faculty members in various ranks, namely professors, associate professors, and senior lecturers. Thus, by employing the MBO, the school can dictate the number of publications per faculty members in ensuring the school's KPI is to be achieved. Therefore, if the professors are required to produce at least 4 publications, associate professors with minimum 3 publications, and senior lecturers with minimum 2 publications; then by the end of 2019 the school could obtain a total of 204 publications in meeting the school’s KPI. The HOD needs to make a clear statement to faculty members that they must work and be industrious in achieving their personal and the school’s KPI. Moreover, the faculty members end of the year achievement will be reflected in their annual performance report (Laporan Penilaian Prestasi; LPP).
5. CONCLUSION
The new HOD needs to evaluate the leadership styles in manning the school toward achieving the KPI. The leadership styles of transactional and transformational can be employed based on the needs. The transactional leadership is defined as the leader "promotes compliance with existing organizational goals and performance expectations through supervision and the use of rewards and punishments. Transactional leaders are task-oriented and outcome-oriented. Especially effective under strict time and resource constraints and in highly-specified projects, this approach adheres to the status quo and employs a form of management that pays close attention to how employees perform their tasks” (Boundless Management, 2019![]() ).
).
On the other hand, transformation leadership is defined as the leader "focuses on increasing employee motivation and engagement and attempts to link employees’ sense of self with organizational values. This leadership style emphasizes leading by example, so followers can identify with the leader’s vision and values. A transformational approach focuses on individual strengths and weaknesses of employees and on enhancing their capabilities and their commitment to organizational goals, often by seeking their buy-in for decisions” (Boundless Management, 2019![]() ). Thus, the leader needs to be able to embark on both leadership styles in getting the faculty members working individually and in the team toward achieving the school's KPI objective.
). Thus, the leader needs to be able to embark on both leadership styles in getting the faculty members working individually and in the team toward achieving the school's KPI objective.
| Funding: The authors would like to thank you for the Universiti Sains Malaysia on the financial support and research grant for the publication of this article. Research Grant: 1001/PJJAUH/8016077. |
| Competing Interests: The authors declare that they have no competing interests. |
| Contributors/Acknowledgement: Both authors contributed equally to the conception and design of the study. |
REFERENCES
Asaari, M.H.A.H., 2017. Organizational analysis: Case of a leading distance education provider in Malaysia. The International Journal Of Business & Management, 5(5): 133-143.
Boundless Management, 2019. Available from https://courses.lumenlearning.com/boundless-management/chapter/types-of-leaders/ [Accessed 24 December 2018].
Business Dictionary, 2018. Available from http://www.businessdictionary.com/definition/portfolio-analysis.html [Accessed 4 January 2019].
Chen, J., 2018. Product portfolio. Available from https://www.investopedia.com/terms/p/product-portfolio.asp [Accessed 24 December 2018].
Claessens, M., 2015. Portfolio analysis: Designing the business portfolio – Boston Matrix. Available from https://marketing-insider.eu/portfolio-analysis-boston-matrix/. [Accessed 4 January 2019].
Markowitz, H.M., 1959. Portfolio selection: Efficient diversification of investments. NY: John Wiley & Sons, Inc.
Mind Tools, 2019. Available from https://www.mindtools.com/pages/article/newLDR_74.htm [Accessed 4 January 2019].
Tools Hero, 2019. Available from https://www.toolshero.com/leadership/mcgregor-theory/ [Accessed 4 January 2019].
Universiti Sains Malaysia, 2016. Available from https://www.kpims.usm.my/v2/?p=what-is-myra [Accessed 24 December 2018].
Appendix A
BCG Status of Faculty Members (2010-2018)
No |
ID |
2010 |
2011 |
2012 |
2013 |
2014 |
2015 |
2016 |
2017 |
2018 |
P |
NP |
BCG Status |
1 |
BIO1 |
2 |
0 |
5 |
4 |
2 |
2 |
2 |
1 |
0 |
7 |
2 |
Cash cow |
2 |
BIO2 |
1 |
0 |
2 |
0 |
1 |
0 |
2 |
1 |
2 |
6 |
3 |
Cash cow |
3 |
BIO3* |
0 |
0 |
0 |
0 |
0 |
0 |
1 |
0 |
0 |
1 |
0 |
Question mark |
4 |
BIO4 |
0 |
0 |
0 |
1 |
0 |
0 |
1 |
1 |
1 |
4 |
5 |
Star |
5 |
BIO5 |
12 |
16 |
20 |
22 |
11 |
9 |
17 |
6 |
12 |
9 |
0 |
Cash cow |
6 |
BIO6 |
2 |
3 |
1 |
4 |
6 |
2 |
4 |
4 |
1 |
9 |
0 |
Cash cow |
7 |
BIO7 |
0 |
0 |
0 |
0 |
0 |
0 |
0 |
0 |
0 |
0 |
9 |
Dog |
8 |
BIO8 |
9 |
13 |
8 |
9 |
4 |
2 |
1 |
3 |
1 |
9 |
0 |
Cash cow |
9 |
CHE1* |
0 |
0 |
0 |
0 |
0 |
0 |
0 |
0 |
0 |
0 |
0 |
Question mark |
10 |
CHE2* |
0 |
0 |
0 |
0 |
0 |
0 |
0 |
0 |
0 |
0 |
0 |
Question mark |
11 |
CHE3 |
2 |
2 |
1 |
1 |
0 |
0 |
3 |
3 |
1 |
7 |
2 |
Cash cow |
12 |
CHE4 |
0 |
1 |
0 |
1 |
2 |
1 |
0 |
0 |
0 |
4 |
5 |
Star |
13 |
CHE5 |
23 |
21 |
6 |
2 |
5 |
1 |
2 |
2 |
2 |
9 |
0 |
Cash cow |
14 |
CHE6 |
0 |
1 |
0 |
0 |
0 |
0 |
0 |
0 |
0 |
1 |
8 |
Dog |
15 |
CHE7 |
0 |
0 |
0 |
0 |
0 |
0 |
0 |
0 |
0 |
0 |
9 |
Dog |
16 |
CHE8 |
0 |
0 |
0 |
0 |
0 |
0 |
0 |
0 |
0 |
0 |
9 |
Dog |
17 |
PHY1 |
11 |
14 |
8 |
7 |
5 |
4 |
3 |
2 |
1 |
9 |
0 |
Cash cow |
18 |
PHY2 |
0 |
0 |
2 |
1 |
3 |
5 |
4 |
3 |
5 |
7 |
2 |
Cash cow |
19 |
PHY3* |
0 |
0 |
0 |
0 |
0 |
0 |
0 |
1 |
1 |
2 |
0 |
Star |
20 |
PHY4 |
6 |
7 |
8 |
5 |
1 |
2 |
3 |
1 |
0 |
8 |
1 |
Cash cow |
21 |
PHY5 |
4 |
12 |
7 |
8 |
6 |
9 |
6 |
9 |
1 |
9 |
0 |
Cash cow |
22 |
PHY6 |
0 |
0 |
0 |
0 |
0 |
0 |
0 |
0 |
0 |
0 |
9 |
Dog |
23 |
PHY7 |
7 |
1 |
3 |
4 |
1 |
1 |
1 |
2 |
0 |
8 |
1 |
Cash cow |
24 |
MAT1* |
0 |
0 |
0 |
0 |
0 |
0 |
2 |
5 |
6 |
3 |
0 |
Star |
25 |
MAT2* |
0 |
0 |
0 |
0 |
0 |
0 |
5 |
9 |
6 |
3 |
0 |
Star |
26 |
MAT3* |
0 |
0 |
0 |
0 |
0 |
0 |
0 |
2 |
1 |
2 |
0 |
Star |
27 |
MAT4* |
6 |
11 |
9 |
14 |
5 |
6 |
3 |
0 |
0 |
7 |
2 |
Cash cow |
28 |
MAT5 |
2 |
3 |
2 |
4 |
3 |
1 |
1 |
1 |
2 |
9 |
0 |
Cash cow |
29 |
MAT6 |
0 |
0 |
9 |
7 |
6 |
5 |
2 |
5 |
2 |
7 |
2 |
Cash cow |
30 |
ANS1* |
0 |
0 |
0 |
0 |
0 |
0 |
0 |
0 |
0 |
0 |
0 |
Question mark |
31 |
ANS2* |
0 |
0 |
0 |
0 |
0 |
0 |
0 |
0 |
0 |
0 |
0 |
Question mark |
32 |
ANS3* |
0 |
0 |
0 |
0 |
0 |
0 |
0 |
1 |
2 |
2 |
0 |
Star |
33 |
ANS4* |
0 |
0 |
0 |
0 |
0 |
2 |
1 |
0 |
0 |
2 |
0 |
Star |
34 |
ANS5 |
9 |
14 |
19 |
3 |
7 |
3 |
1 |
12 |
6 |
9 |
0 |
Cash cow |
35 |
ANS6 |
0 |
1 |
0 |
0 |
0 |
0 |
0 |
0 |
0 |
1 |
8 |
Dog |
36 |
ANS7 |
1 |
1 |
0 |
0 |
3 |
2 |
0 |
1 |
0 |
5 |
4 |
Star |
37 |
ANS8 |
0 |
1 |
1 |
1 |
1 |
3 |
0 |
0 |
0 |
5 |
4 |
Star-Dog |
38 |
POS1 |
2 |
1 |
1 |
0 |
0 |
0 |
0 |
0 |
0 |
3 |
6 |
Star-Dog |
39 |
POS2 |
0 |
0 |
0 |
0 |
0 |
0 |
0 |
0 |
0 |
0 |
9 |
Dog |
40 |
POS3* |
0 |
0 |
0 |
0 |
0 |
0 |
0 |
2 |
0 |
1 |
0 |
Star |
41 |
POS4 |
2 |
5 |
4 |
0 |
0 |
0 |
1 |
1 |
1 |
6 |
3 |
Cash cow |
42 |
POS5 |
6 |
2 |
6 |
13 |
10 |
7 |
5 |
6 |
4 |
9 |
0 |
Cash cow |
43 |
POS6 |
2 |
0 |
4 |
5 |
1 |
4 |
1 |
6 |
0 |
7 |
2 |
Cash cow |
44 |
POS7 |
0 |
1 |
2 |
2 |
3 |
1 |
1 |
1 |
3 |
8 |
1 |
Cash cow |
45 |
ECO1 |
0 |
0 |
3 |
3 |
1 |
4 |
3 |
5 |
0 |
6 |
3 |
Cash cow |
46 |
ECO2 |
0 |
0 |
2 |
1 |
1 |
7 |
2 |
4 |
0 |
6 |
3 |
Cash cow |
47 |
ECO3 |
1 |
2 |
1 |
2 |
0 |
0 |
0 |
0 |
0 |
5 |
4 |
Cash cow-Dog |
48 |
ECO4* |
0 |
0 |
0 |
0 |
2 |
1 |
2 |
4 |
0 |
4 |
0 |
Star |
49 |
ECO5 |
1 |
2 |
0 |
0 |
0 |
2 |
0 |
0 |
0 |
3 |
6 |
Question mark-Dog |
50 |
ECO6 |
0 |
0 |
0 |
0 |
0 |
0 |
0 |
0 |
0 |
0 |
9 |
Dog |
51 |
ECO7 |
0 |
4 |
2 |
3 |
4 |
4 |
3 |
4 |
1 |
8 |
1 |
Cash cow |
52 |
HIS1* |
0 |
0 |
0 |
0 |
0 |
0 |
1 |
0 |
0 |
1 |
0 |
Star |
53 |
HIS2 |
0 |
2 |
2 |
1 |
1 |
0 |
0 |
0 |
0 |
4 |
5 |
Cash cow-Dog |
54 |
HIS3 |
1 |
1 |
3 |
3 |
4 |
2 |
3 |
3 |
0 |
8 |
1 |
Cash cow |
55 |
HIS4 |
0 |
0 |
1 |
2 |
4 |
8 |
7 |
7 |
1 |
7 |
2 |
Cash cow |
56 |
HIS5 |
4 |
4 |
9 |
1 |
1 |
2 |
0 |
0 |
0 |
6 |
3 |
Cash cow |
57 |
HIS6* |
0 |
0 |
0 |
0 |
0 |
0 |
1 |
5 |
0 |
2 |
0 |
Star |
58 |
HIS7 |
0 |
1 |
1 |
0 |
0 |
1 |
1 |
0 |
0 |
4 |
5 |
Star |
59 |
GEO1 |
5 |
1 |
0 |
0 |
2 |
1 |
3 |
4 |
1 |
7 |
2 |
Cash cow |
60 |
GEO2* |
0 |
0 |
0 |
0 |
0 |
0 |
2 |
0 |
0 |
1 |
0 |
Star |
61 |
GEO3 |
6 |
26 |
18 |
6 |
11 |
12 |
13 |
9 |
0 |
8 |
1 |
Cash cow |
62 |
GEO4 |
3 |
1 |
4 |
7 |
6 |
7 |
1 |
3 |
2 |
9 |
0 |
Cash cow |
63 |
GEO5 |
1 |
2 |
2 |
1 |
0 |
0 |
0 |
5 |
0 |
5 |
4 |
Cash cow-Dog |
64 |
GEO6 |
4 |
4 |
2 |
3 |
0 |
2 |
1 |
4 |
1 |
9 |
0 |
Cash cow |
65 |
LIT1 |
0 |
0 |
0 |
0 |
0 |
0 |
0 |
0 |
0 |
0 |
9 |
Dog |
66 |
LIT2 |
1 |
1 |
2 |
0 |
3 |
1 |
0 |
0 |
0 |
5 |
4 |
Cash cow-Dog |
67 |
LIT3* |
0 |
0 |
0 |
0 |
0 |
0 |
0 |
0 |
3 |
1 |
0 |
Star |
68 |
MAN1 |
0 |
0 |
0 |
0 |
0 |
0 |
0 |
0 |
0 |
0 |
9 |
Dog |
69 |
MAN2 |
0 |
0 |
1 |
3 |
2 |
0 |
1 |
1 |
1 |
6 |
3 |
Cash cow |
70 |
MAN3 |
2 |
2 |
0 |
1 |
0 |
0 |
1 |
0 |
0 |
4 |
5 |
Star |
71 |
MAN4 |
4 |
10 |
7 |
5 |
8 |
5 |
6 |
10 |
2 |
9 |
0 |
Cash cow |
72 |
MAN5 |
0 |
0 |
3 |
6 |
3 |
3 |
6 |
4 |
4 |
7 |
2 |
Cash cow |
73 |
MAN6 |
0 |
4 |
2 |
1 |
5 |
3 |
5 |
4 |
4 |
8 |
1 |
Cash cow |
74 |
MAN7* |
0 |
0 |
0 |
0 |
0 |
0 |
1 |
2 |
0 |
2 |
0 |
Star |
75 |
MAN8 |
1 |
2 |
5 |
6 |
4 |
6 |
2 |
3 |
0 |
8 |
1 |
Cash cow |
76 |
MAN9 |
0 |
1 |
2 |
0 |
1 |
3 |
0 |
0 |
0 |
4 |
5 |
Star |
77 |
MAN10 |
0 |
0 |
1 |
3 |
1 |
2 |
3 |
5 |
1 |
7 |
2 |
Cash cow |
78 |
MAN11 |
0 |
0 |
0 |
2 |
0 |
0 |
1 |
5 |
1 |
4 |
5 |
Star |
79 |
MAN12* |
0 |
0 |
0 |
0 |
0 |
0 |
1 |
0 |
1 |
2 |
0 |
Star |
80 |
MAN13 |
1 |
2 |
1 |
0 |
0 |
1 |
0 |
0 |
1 |
5 |
4 |
Cash cow |
81 |
MAN14 |
13 |
3 |
8 |
3 |
0 |
0 |
0 |
0 |
0 |
5 |
4 |
Cash cow-Dog |
82 |
MAN15 |
4 |
1 |
3 |
2 |
3 |
4 |
5 |
0 |
1 |
8 |
1 |
Cash cow |
83 |
UNS1* |
0 |
0 |
0 |
0 |
0 |
0 |
2 |
0 |
0 |
1 |
0 |
Star |
84 |
UNS2 |
4 |
3 |
2 |
4 |
0 |
0 |
3 |
3 |
0 |
6 |
3 |
Cash cow-Star |
85 |
UNS3 |
6 |
3 |
1 |
1 |
2 |
1 |
4 |
1 |
1 |
9 |
0 |
Cash cow |
86 |
UNS4 |
0 |
0 |
0 |
0 |
0 |
0 |
0 |
1 |
0 |
1 |
8 |
Question mark-Dog |
Note: *=Employed 2014-2018; P=Publishing; NP=Not Publishing
BIO=Biology; CHE=Chemistry; PHY=Physics; MAT=Mathematics
ANS=Anthropology-Sociology; POS=Political Sciences; ECO=Economic
HIS=History; GEO=Geography; LIT=Literature
MAN=Management; UNS=University Subject
Views and opinions expressed in this article are the views and opinions of the author(s), International Journal of Asian Social Science shall not be responsible or answerable for any loss, damage or liability etc. caused in relation to/arising out of the use of the content. |