


DO CEO INCENTIVES MEDIATE THE RELATIONSHIP BETWEEN POLITICAL INFLUENCES AND FINANCIAL REPORTING QUALITY?

1,2,3Taylors University, Malaysia
ABSTRACT
The purpose of this study is to examine whether CEO incentives mediate the relationship between political influences and financial reporting quality. This study particularly examines whether CEO incentives are the underlying mechanism through which politically influenced firms affect the incentives of those executives involved in preparing financial statements. In this study, politically influenced firms are identified as those in which politicians or their close relatives, and former or current civil/military bureaucrats are present on the board or in senior management. A sample of non-financial firms listed on the Pakistan Stock Exchange between 2009 and 2015 was taken. The results, which were tested for robustness, revealed that CEO incentives and political influences have a moderating effect on financial reporting quality. This study contributes to the field of corporate governance, integrating the agency and political economy theories, and provides policymakers insight into improving corporate governance in transitional economies. Further, this study contributes to the existing literature by including a new type of political connection, through civil/military bureaucrats.
Keywords:Political influences, CEO incentives, Financial reporting quality, Real earnings management, Pakistan
ARTICLE HISTORY: Received:21 November 2018 Revised:24 December 2018 Accepted:31 January 2019Published:14 March 2019 .
Contribution/ Originality:This study makes two contributions to the existing literature. First, it examines the mediating effect of CEO incentives on the relationship between political influences and financial reporting quality in Pakistan. Second, it introduces a new type of political connection, that of civil/military bureaucrats.
1. INTRODUCTION
Financial reporting quality needs further scrutiny, as suggested by the recent corporate accounting scandals at Barclays, Tesco, Rolls Royce, and Toshiba. Most of these accounting scandals occurred because the firms were manipulating earnings and reporting poor-quality financial information. Some empirical studies provide evidence that the quality of financial reporting worsens when CEOs receive more incentives (Baker et al., 2003![]() ; Meek et al., 2007
; Meek et al., 2007![]() ). CEO incentives play an important role in the financial reporting quality of organizations—borne out by the recent corporate accounting scandal at Barclays Bank—because they depend on high organizational performance, leading to a tendency toward opportunistic earnings manipulation to produce better results.
). CEO incentives play an important role in the financial reporting quality of organizations—borne out by the recent corporate accounting scandal at Barclays Bank—because they depend on high organizational performance, leading to a tendency toward opportunistic earnings manipulation to produce better results.
In recent years, CEO incentives have been linked to some of the biggest corporate accounting scams, because CEOs encourage management to take actions that boost share price, benefiting shareholders. As witnessed recently at Barclays Bank, the CEO manipulated earnings to gain more incentives, and thereby reported poor-quality financial information. Previous studies confirmed that the extent of earnings manipulation is positively related to CEO incentives (e.g.,Cheng and Warfield, 2005![]() ; Goldman and Slezak, 2006
; Goldman and Slezak, 2006![]() ; Crocker and Slemrod, 2007
; Crocker and Slemrod, 2007![]() ; Benmelech et al., 2010
; Benmelech et al., 2010![]() ).
).
In addition to CEO incentives, political influences are also known to affect financial reporting quality, as revealed by the empirical evidence in a number of recent studies (Braam et al., 2015![]() ; Liu et al., 2016
; Liu et al., 2016![]() ; Sadiq and Othman, 2017
; Sadiq and Othman, 2017![]() ); politically influenced firms manipulate the reported earnings to conceal those gains they derive from dubious legal activities (Chaney et al., 2011
); politically influenced firms manipulate the reported earnings to conceal those gains they derive from dubious legal activities (Chaney et al., 2011![]() ). Some authors have observed that political influences are a global phenomenon with complex economic consequences (e.g.,Sadiq and Othman, 2017
). Some authors have observed that political influences are a global phenomenon with complex economic consequences (e.g.,Sadiq and Othman, 2017![]() ) others have linked political influences to a lack of corporate transparency (e.g.,Chen et al. 2010
) others have linked political influences to a lack of corporate transparency (e.g.,Chen et al. 2010![]() ) considerable earnings management (Braam et al., 2015
) considerable earnings management (Braam et al., 2015![]() ; Chi et al., 2016
; Chi et al., 2016![]() ) and poor corporate governance (Guedhami et al., 2014
) and poor corporate governance (Guedhami et al., 2014![]() ) and still others found evidence that politically influenced firms manipulate financial information (Chi et al., 2016
) and still others found evidence that politically influenced firms manipulate financial information (Chi et al., 2016![]() ) and thus report poor quality financial information.
) and thus report poor quality financial information.
Although there is ample literature available on the link between CEO incentives and financial reporting quality, this study extends the debate by considering whether CEO incentives mediate the relationship between political influences and financial reporting quality. It is argued that politically influenced firms provide more incentives to CEOs to direct their authority and manipulation of financial information. This occurs because these firms aim to conceal those gains they derive as a result of their political connections and dubious legal activities. Consequently, CEOs tend to protect the interests of politically connected individuals, which affect corporate well-being and leads to poor-quality financial reporting.
Based on agency theory, this study argues that political influences affect financial reporting quality by providing more incentives to CEOs, which in turn influence corporate governance. We incorporate the features of agency theory in a model, with which we then predict that politically influenced firms will provide incentives to CEOs to direct their authority, as well as the conditions under which politically influenced firms will report poor-quality financial information. This study shows that these predictions explain some important findings—adding to the existing literature on financial reporting quality—that politically influenced firms provide more incentives to CEOs to guide their decisions. Moreover, this study provides the evidence that CEO incentives mediate the relationship between political influences and financial reporting quality.
This study offers several contributions to the growing literature on CEO incentives, political influences, and financial reporting quality. First, it tests the mediating effects of CEO incentives on political influences and financial reporting quality. Second, it introduces the additional aspect of political influences through civil/military bureaucrats, due to periods when dictators and bureaucrats exercised direct rule in Pakistan leading to bureaucrats becoming as influential as politicians.
This paper is arranged as follows: first, the hypothesis development; second, the methodology and results including robustness testing and finally the summary and conclusions.
2. HYPOTHESIS DEVELOPMENT
Previous studies have identified many reasons why executives become involved in earnings manipulation, and thus poor-quality financial reporting. Jensen and Murphy (1990![]() ) explained that CEO incentives create value, enjoying an appreciation in share value for every dollar increase in shareholders’ wealth; thus, CEO incentives are proportionally related to shareholders’ wealth.
) explained that CEO incentives create value, enjoying an appreciation in share value for every dollar increase in shareholders’ wealth; thus, CEO incentives are proportionally related to shareholders’ wealth.
Some researchers have argued that CEO incentives are often linked to target earnings; therefore, reporting negative earnings is avoided (Jiang et al., 2010![]() ). This opportunistic behavior by executives encourages their involvement in income-increasing earnings manipulation. Such activities also enable executives to participate in bonus schemes, and prepare their accruals strategy accordingly (Healy, 1985
). This opportunistic behavior by executives encourages their involvement in income-increasing earnings manipulation. Such activities also enable executives to participate in bonus schemes, and prepare their accruals strategy accordingly (Healy, 1985![]() ). Consequently, executives employ accrual-based earnings management to achieve their personal objectives at the cost of shareholders’ wealth.
). Consequently, executives employ accrual-based earnings management to achieve their personal objectives at the cost of shareholders’ wealth.
Managers often manipulate earnings when the benefits outweigh the costs (Zang, 2011![]() ) which implies that they assess the consequences of earnings manipulation according to current or future bonuses, especially in light of previous studies revealing CEO incentives were related to income-increasing accrual-based earnings management.
) which implies that they assess the consequences of earnings manipulation according to current or future bonuses, especially in light of previous studies revealing CEO incentives were related to income-increasing accrual-based earnings management.
In addition to CEO incentives, some researchers (Chi et al., 2016![]() ) suggested that firms with politically connected CEOs engage in a higher level of real earnings management (REM) and lower level of accrual-based earnings management. In similar studies, other researchers argued that firms with stronger political connections report poor-quality financial information and manipulate accounting records (Liu et al., 2016
) suggested that firms with politically connected CEOs engage in a higher level of real earnings management (REM) and lower level of accrual-based earnings management. In similar studies, other researchers argued that firms with stronger political connections report poor-quality financial information and manipulate accounting records (Liu et al., 2016![]() ) intending to conceal their political gains acquired through dubious legal activities (Sadiq and Othman, 2017
) intending to conceal their political gains acquired through dubious legal activities (Sadiq and Othman, 2017![]() ).
).
Furthermore, Liu et al. (2014![]() ) claimed that firms with significant government shareholdings create incentives for self-serving purposes, recognize losses less frequently, and tend to be more involved in earnings smoothing, ensuring earnings achieve their targets and reporting less value-relevant earnings. Al-Dhamari and Ismail (2015
) claimed that firms with significant government shareholdings create incentives for self-serving purposes, recognize losses less frequently, and tend to be more involved in earnings smoothing, ensuring earnings achieve their targets and reporting less value-relevant earnings. Al-Dhamari and Ismail (2015![]() ) also argued that politically connected firms report poor-quality financial information due to their involvement in accrual-based earnings management.
) also argued that politically connected firms report poor-quality financial information due to their involvement in accrual-based earnings management.
As previous studies have revealed how politically influenced firms acquire political gains through their connections, which managers are encouraged to conceal through poor-quality financial reporting (Chaney et al., 2011![]() ) enough evidence exists to prove the negative relationship between political influences and financial reporting quality (Liu et al., 2014
) enough evidence exists to prove the negative relationship between political influences and financial reporting quality (Liu et al., 2014![]() ; Braam et al., 2015
; Braam et al., 2015![]() ; Chi et al., 2016
; Chi et al., 2016![]() ; Sadiq and Othman, 2017
; Sadiq and Othman, 2017![]() ). The arguments in these studies are based on the basic premise that political influences create incentives that affect the behavior of executives and the financial reporting quality for which they are responsible.
). The arguments in these studies are based on the basic premise that political influences create incentives that affect the behavior of executives and the financial reporting quality for which they are responsible.
H: CEO incentives mediate the relationship between political influences and financial reporting quality.
3. METHODOLOGY
3.1. Data Collection and Sampling
This study uses balanced panel data gathered manually between 2009 and 2015, omitting from the sample those firms for whom data was unavailable. After applying data restrictions to approximately 380 non-financial firms listed on the Pakistan Stock Exchange (PSE), the final sample comprises a panel of 290 firms, of which 116 were politically influenced. The firm-level financial information was acquired from the State Bank of Pakistan, which provides financial information of approximately 600 listed firms.
Table-1. Definitions of Variables.
Variable |
Definition | Measurement |
REM |
REM model | A comprehensive metric of REM, measured as the sum of overproduction and reducing discretionary expenditures multiplied by negative one (Braam et al., 2015 |
PI |
Presence of politician(s) or close relative(s) of politician(s); current/former civil/military bureaucrat(s) on the board of directors or in senior management | A dummy variable that takes the value of 1 if a firm is politically influenced and 0 otherwise. Of 290 firms, there are about 116 politically influenced (PI) firms. |
CEOINC |
CEO Incentives | A log of CEO incentives, calculated as the sum of the CEO’s annual bonus and their stock options’ value. |
BIG4 |
Big Four auditors | BIG4 is a dummy variable for audit quality that takes the value of 1 if a firm is audited by the Big Four auditors and 0 otherwise. |
ROA |
Return on assets | The percentage of net profits divided by total assets. |
SIZE |
Size | The natural log of a firm’s total assets. |
BSIZE |
Board Size | The total number of board members in a firm. |
BIND |
Board Independence | The percentage of independent board members divided by total number of board members. |
INDUSTRY |
Industry dummies | Firms belonging to the Textile, Manufacturing (excluding textile), Pharmaceutical and Chemicals, Sugar, Fuel and Energy, Services, and Cement sectors. |
3.2. Instrumentation and Measurement
A multiple regression analysis was employed to test the hypothesis. Although this study investigates the relationship between political influences and REM, in line with previous studies (Braam et al., 2015![]() ; Chi et al., 2016
; Chi et al., 2016![]() ) it contributes further by including CEO incentives as a mediating variable during the testing. All variables are defined in Table 1.
) it contributes further by including CEO incentives as a mediating variable during the testing. All variables are defined in Table 1.
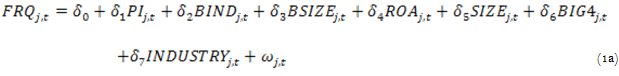
In Equation 1a, FRQ is the explained (dependent) variable of financial reporting quality and PI the explanatory (independent) variable of political influences. To test whether politically, in comparison with non-politically, influenced firms are involved in poor-quality financial reporting, this study adopts the REM model of Roychowdhury (2006![]() ) as a measure of financial reporting quality. We regressed political influences on REM, which found a positive relationship between the two variables; thus, politically influenced firms are more involved in REM and poor financial reporting quality.
) as a measure of financial reporting quality. We regressed political influences on REM, which found a positive relationship between the two variables; thus, politically influenced firms are more involved in REM and poor financial reporting quality.
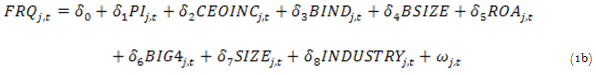
Equation 1b retains all the same variables as 1a but incorporates CEO incentives (CEOINC) as an independent variable to examine their mediating effect on the relationship between political influences and financial reporting quality. The mediating effect of CEO incentives is determined by comparing the changes in the coefficients of the political influences variable (i.e., by comparing Equation (1a) with (1b)). Robustness is checked through the moderating effect of political influences and CEO incentives (i.e., PI*CEOINC) on financial reporting quality.
3.3. Measurement of Financial Reporting Quality
As this study uses REM (REM) as a measure of financial reporting quality, two proxies of REM—reducing discretionary expenditures (DISX) and overproduction to reduce costs of goods sold (PROD)—are adopted to measure REM. Similar to previous studies (Braam et al., 2015![]() ) the sum of the residuals from DISX and PROD capture the aggregate effects of the REM proxies. The two proxies are now explained.
) the sum of the residuals from DISX and PROD capture the aggregate effects of the REM proxies. The two proxies are now explained.
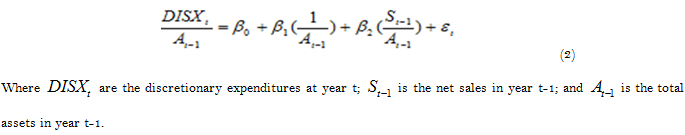
Abnormal level of discretionary expenditures (DISX) occurs when executives manipulate earnings through such discretionary expenditures as administrative and general expenditures: reported income can be overstated by postponing research and development expenditures.
Roychowdhury (2006![]() ) measured REM through discretionary expenses using Equation 2:
) measured REM through discretionary expenses using Equation 2:
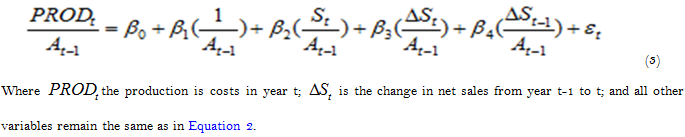
Abnormal level of production costs (PROD) occurs when executives reduce costs of goods sold (COGS) through overproduction: reported earnings can be increased because fixed overhead costs will be spread across a larger number of products (Roychowdhury, 2006![]() ). Roychowdhury (2006
). Roychowdhury (2006![]() ) estimated the normal level of production costs using Equation 3:
) estimated the normal level of production costs using Equation 3:
3.4. Measurement of Political Influences
This study measures political influences (PI) as a dummy variable, which is equal to 1 if the firm is politically influenced and 0 otherwise. This study adopts two main types of political influences: first, either one or more of the senior management or a majority shareholder are former or current civil/military bureaucrat(s) (Cheema et al., 2016![]() ; Sadiq and Othman, 2017
; Sadiq and Othman, 2017![]() ) second, either one or more of the top management (i.e., a director, the CEO, chair/president, vice chair/vice president) or a majority shareholder are members of the provincial assembly or parliament, or a close relative of a politician (Sadiq and Othman, 2017
) second, either one or more of the top management (i.e., a director, the CEO, chair/president, vice chair/vice president) or a majority shareholder are members of the provincial assembly or parliament, or a close relative of a politician (Sadiq and Othman, 2017![]() ). These political connections were introduced as specific to the Pakistani context, due to the direct rule of bureaucrats and military dictators (Cheema et al., 2016
). These political connections were introduced as specific to the Pakistani context, due to the direct rule of bureaucrats and military dictators (Cheema et al., 2016![]() ; Sadiq and Othman, 2017
; Sadiq and Othman, 2017![]() ).
).
3.5. Measurement of CEO Incentives
Following Jensen and Murphy (1990![]() ) and Fahlenbrach and Stulz (2011
) and Fahlenbrach and Stulz (2011![]() ) CEO incentives were measured by calculating the sum of their annual bonus and long-term income according to their estimated number of share options.
) CEO incentives were measured by calculating the sum of their annual bonus and long-term income according to their estimated number of share options.
3.6. Measurement of Control Variables
Following Al-Dhamari and Ismail (2015![]() ) and Sadiq and Othman (2017
) and Sadiq and Othman (2017![]() ) this study includes such control variables as board independence (BIND), board size (BSIZE), firm size (SIZE), return on assets (ROA), and audit quality (BIG4). While BSIZE represents the total number of board members, BIND represents the percentage that are independent, which is expected to be positively related to financial reporting quality and negatively to REM. BIG4 is represented by an indicator variable taking the value of 1 if a firm is audited by one of the Big Four auditing firms; where this is the case, BIG4 is expected to be positively related to REM because manipulation through REM is not under the jurisdiction of auditors. SIZE is represented by the natural logarithm of total assets, which is expected to be positively related to REM because only large firms have the capacity to overproduce goods and the majority of the politically influenced firms tend to be larger. ROA represents the percentage of net profits divided by total assets, which is expected to be positively related to REM because firms employ REM strategies that increase earnings.
) this study includes such control variables as board independence (BIND), board size (BSIZE), firm size (SIZE), return on assets (ROA), and audit quality (BIG4). While BSIZE represents the total number of board members, BIND represents the percentage that are independent, which is expected to be positively related to financial reporting quality and negatively to REM. BIG4 is represented by an indicator variable taking the value of 1 if a firm is audited by one of the Big Four auditing firms; where this is the case, BIG4 is expected to be positively related to REM because manipulation through REM is not under the jurisdiction of auditors. SIZE is represented by the natural logarithm of total assets, which is expected to be positively related to REM because only large firms have the capacity to overproduce goods and the majority of the politically influenced firms tend to be larger. ROA represents the percentage of net profits divided by total assets, which is expected to be positively related to REM because firms employ REM strategies that increase earnings.
4. RESULTS
Table 2 shows the minimum, maximum, and means values for all the dependent and independent variables used in the regression analysis. The descriptive statistics reveal no concern over outliers because the data indicates no deviation from normality. The mean value of 0.2082 for dependent variable REM is closer to that in Braam et al. (2015![]() ). The data for the independent variables show that of the 290 firms (i.e., 2030 observations): about 40% are politically influenced (PI); and the mean value for CEO incentives (CEOINC), is 3.6344 (0.3010 minimum, 5.2167 maximum). For the control variables, the mean values for BIND, BSIZE, ROA, SIZE, and BIG4 are 1.30, 8.20, 8.83, 6.87, and 0.40, respectively.
). The data for the independent variables show that of the 290 firms (i.e., 2030 observations): about 40% are politically influenced (PI); and the mean value for CEO incentives (CEOINC), is 3.6344 (0.3010 minimum, 5.2167 maximum). For the control variables, the mean values for BIND, BSIZE, ROA, SIZE, and BIG4 are 1.30, 8.20, 8.83, 6.87, and 0.40, respectively.
Table-2. Summary Statistics of the Variables used in Analysis.
Variables |
Observations |
Mean |
Min |
Max |
REM |
2030 |
0.2082 |
-2.8863 |
2.4283 |
PI |
2030 |
0.4 |
0 |
1 |
CEOINC |
2030 |
3.6344 |
0.301 |
5.3168 |
BSIZE |
2030 |
8.2 |
6 |
16 |
BIND |
2030 |
1.3 |
1 |
7 |
ROA |
2030 |
8.83 |
-53.28 |
59.72 |
SIZE |
2030 |
6.8671 |
5.2584 |
8.617 |
BIG4 |
2030 |
0.3982 |
0 |
1 |
Note: REM represents the residuals of REM activities, which is measured as the sum of overproduction and reducing discretionary expenditures multiplied by negative one; PI represents the aggregate measure of politically influenced firms, coded 1 if a firm is politically influenced in any aforementioned way, and 0 otherwise; CEOINC represents the log of CEO incentives, calculated by adding their annual bonus and value of their share options; BSIZE represents the number of board members in a firm; BIND represents the ratio of independent board members to the total number; ROA is the percentage of net profits/loss divided by total assets; SIZE is equal to the natural log of a firm’s total assets; BIG4 represents the firm’s audit quality, coded 1 if a firm is audited by the Big Four auditors and 0 otherwise.
Correlation analysis Table 3 confirms that BIND is negatively and significantly correlated with REM (coefficient: 0.166), implying that the more independent board members in a firm, the less involved it is in REM and the better its financial reporting quality. BSIZE and SIZE are positively, but not significantly, correlated with REM (coefficients: 0.080 and 0.071, respectively), the former suggesting that the total number of board members has no significant impact on REM. ROA is positively and significantly correlated with REM (coefficient: 0.239), indicating that firms reporting high operating profits are more involved in REM. BIG4 is also positively and significantly correlated with REM (coefficient: 0.162), implying that firms audited by the Big Four auditors are more involved in REM because it is not under the direct jurisdiction of auditors.
Table-3. Pearson Correlations of the Mediation Effect of CEO Incentives between Political Influences and REM.
REM |
PI |
CEOINC |
BIND |
BSIZE |
ROA |
SIZE |
BIG4 |
|
REM |
1 |
|||||||
PI |
0.180* |
1 |
||||||
CEOINC |
0.016 |
0.190* |
1 |
|||||
BIND |
-0.166* |
0.006 |
-0.221* |
1 |
||||
BSIZE |
0.08 |
0.024 |
0.305* |
0.320* |
1 |
|||
ROA |
0.239* |
-0.154* |
0.084 |
0.111** |
0.062 |
1 |
||
SIZE |
0.071 |
0.155* |
0.386* |
0.321* |
0.323* |
0.126* |
1 |
|
BIG4 |
0.162* |
-0.099** |
0.456* |
0.222* |
0.152* |
0.421 |
0.432 |
1 |
Note: REM represents the residuals of REM activities, which is measured as the sum of overproduction and reducing discretionary expenditures multiplied by negative one; PI represents the aggregate measure of politically influenced firms, coded 1 if a firm is politically influenced in any aforementioned way, and 0 otherwise; CEOINC represents the log of CEO incentives, calculated by adding their annual bonus and value of their share options; BIND represents the ratio of independent board members to the total number; BSIZE represents the number of board members in a firm; ROA is the percentage of net profits/loss divided by total assets; SIZE is equal to the log of total assets of the firm; BIG4 represents the firm’s audit quality, coded 1 if a firm is audited by the Big Four auditors and 0 otherwise.
4.1. Linear Regression Results
In Table 4, the Model 1 results show a significant, positive relationship between political influences (PI) and REM (coefficient: 0.1864; z = 3.43), implying that financial reporting quality is lower and involvement in REM higher among politically influenced firms. In Model 2, the results support our hypothesis that CEO incentives mediate the relationship between political influences and REM, and thus financial reporting quality: Table 4 shows the coefficient of political influences (PI) (0.2375; z = 4.42) is increased when CEO incentives (CEOINC) is included. These findings suggest that politically influenced firms grant more incentives to CEOs, encouraging them to become involved in REM. This is consistent with previous studies (Braam et al., 2015![]() ; Chi et al., 2016
; Chi et al., 2016![]() ) that argue politically connected firms are involved in earnings management to achieve short-term target earnings. Congruent with earlier studies, and based on a basic premise, this study argues that financial reporting quality is ultimately shaped by political factors, which influence the incentives granted to those executives who prepare financial reports and can manipulate earnings. Congruent with Saleh and Ahmed (2005
) that argue politically connected firms are involved in earnings management to achieve short-term target earnings. Congruent with earlier studies, and based on a basic premise, this study argues that financial reporting quality is ultimately shaped by political factors, which influence the incentives granted to those executives who prepare financial reports and can manipulate earnings. Congruent with Saleh and Ahmed (2005![]() ) BIND is negatively and significantly correlated with REM, suggesting that firms with more independent directors are less involved in REM. ROA is positively and significantly correlated with REM, indicating that a REM strategy is adopted to increase reported earnings. BIG4 is also positively and significantly correlated with REM, implying that the Big Four audit firms have failed to curtail REM, due to it not being under their direct jurisdiction. Consequently, those firms audited by the Big Four become more involved in REM. SIZE are positively and significantly correlated with REM too, suggesting that large firms are more involved in REM.
) BIND is negatively and significantly correlated with REM, suggesting that firms with more independent directors are less involved in REM. ROA is positively and significantly correlated with REM, indicating that a REM strategy is adopted to increase reported earnings. BIG4 is also positively and significantly correlated with REM, implying that the Big Four audit firms have failed to curtail REM, due to it not being under their direct jurisdiction. Consequently, those firms audited by the Big Four become more involved in REM. SIZE are positively and significantly correlated with REM too, suggesting that large firms are more involved in REM.
Table-4. Linear Regression Results of the Mediation Effect of CEO Incentives between Political Influences and REM.
Model 1 |
Model 2 |
|||||
REM |
Coefficient |
z |
P>z |
Coefficient |
z |
P>z |
PI |
0.1864 |
3.43 |
0.001 |
0.2375 |
4.42 |
0 |
CEOINC |
0.0391 |
2.17 |
0.03 |
|||
BIND |
-0.4797 |
-2.64 |
0.008 |
-0.4881 |
-2.79 |
0.005 |
BSIZE |
0.0259 |
2.8 |
0.005 |
0.0297 |
3.19 |
0.001 |
SIZE |
0.0455 |
2.61 |
0.009 |
0.0426 |
2.65 |
0.008 |
ROA |
0.0069 |
4.94 |
0 |
0.0075 |
4.86 |
0 |
BIG4 |
0.1795 |
3.54 |
0 |
0.192 |
3.98 |
0 |
Industry Effect |
Yes |
Yes |
||||
R-squared |
0.3221 |
0.3614 |
||||
Observations |
2030 |
2030 |
Note: REM represents the residuals of REM activities, which is measured as the sum overproduction and reducing discretionary expenditures multiplied by negative one; PI represents the aggregate measure of politically influenced firms, coded 1 if a firm is politically influenced in any aforementioned way, and 0 otherwise; CEOINC represents the log of CEO incentives, calculated by adding their annual bonus and value of their share options; BIND represents the ratio of independent board members to the total number; BSIZE represents the number of board members in a firm; ROA is the percentage of net profits/loss divided by total assets; SIZE is equal to the natural log of a firm’s total assets; BIG4 represents the firm’s audit quality, coded 1 if a firm is audited by the Big Four auditors and 0 otherwise.
4.2. Robustness
The results reported in Table 4, show that CEO incentives mediate the relationship between political influences and REM. With these results, it would be interesting to see whether CEO incentives moderate the effect of political influences on REM. In order to see the moderating effect of CEO incentives, interaction terms were introduced (i.e., PI*CEOINC). The results are reported in Table 5. The results reported in Table 5 show that CEO incentives mediate the relationship between political influences and REM. PI*CEOINC correlation is positive and significant (0.0418; z = 3.37), which is consistent with the findings from the main results. A comparison of the results suggests that the significance level of all the other variables in the moderating regression remain largely similar.
Table-5. Linear Regression Results for the Relationships between the Interaction Effects of Political Influences and CEO Incentives on REM.
REM |
|||
Coefficient |
z |
P>z |
|
PI |
0.1598 |
2.65 |
0.008 |
CEOINC |
0.0302 |
1.96 |
0.05 |
PI*CEOINC |
0.0418 |
3.37 |
0.001 |
BIND |
-0.4825 |
-2.69 |
0.006 |
BSIZE |
0.0288 |
3.1 |
0.002 |
SIZE |
0.0414 |
2.67 |
0.007 |
ROA |
0.0087 |
4.7 |
0 |
BIG4 |
0.1827 |
3.65 |
0 |
Industry Effect |
Yes |
||
R-squared |
0.3486 |
||
Observations |
2030 |
Note: REM represents the residuals of REM activities, which is measured as the sum of overproduction and reducing discretionary expenditures multiplied by negative one; PI represents the aggregate measure of politically influenced firms, coded 1 if a firm is politically influenced in any aforementioned way, and 0 otherwise; CEOINC represents the log of CEO incentives, calculated by adding their annual bonus and the value of their share options; PI*CEOINC represents the interaction effects of political influences and CEO incentives; BIND represents the ratio of independent board members to the total number; BSIZE represents number of board members in a firm; ROA is the percentage of net profits/loss divided by total assets; SIZE is equal to the natural log of a firm’s total assets; BIG4 represents the firm’s audit quality, coded 1 if a firm is audited by the Big Four auditors and 0 otherwise.
5. SUMMARY AND CONCLUSION
This study provides evidence that CEO incentives mediate the relationship between political influences and REM. The results were tested for and proved to have robustness, and revealed that the moderating effects of CEO incentives and political influences are positively correlated with REM. Therefore; it is believed that CEO incentives are the underlying mechanism through which politically influenced firms become more involved in REM. This is the contribution of this study to the existing literature, which has only tested the direct relationship between political influences and REM, failing to identify the role played by CEO incentives in financial reporting quality. However, this finding is consistent with the arguments of Braam et al. (2015![]() ) and Chi et al. (2016
) and Chi et al. (2016![]() ) that politically influenced firms are more involved in REM because it is detected less by regulators and authorities.
) that politically influenced firms are more involved in REM because it is detected less by regulators and authorities.
The sample of 290 firms listed on the Pakistan Stock Exchange included 116 politically influenced firms, for which two types of political influences were identified: the presence of politicians or their close relatives, and of bureaucrats in a firm. Further, financial reporting quality was estimated using the REM model of Roychowdhury (2006![]() ) and CEO incentives using the CEO annual bonus. This study is the first to examine how CEO incentives mediate the relationship between political influences and financial reporting quality. Thus, it contributes to the field of corporate governance and earnings management, integrating the agency and political economy theories, and adding to the ongoing debate about the role of political influences in emerging markets. Moreover, it demonstrates the underlying mechanism (i.e., CEO incentives) through which politically influenced firms manipulate earnings through REM. As such, this study can offer policymakers and regulators insights into improving corporate governance practices in transitional economies such as Pakistan, where politics and business is closely entwined. This study further contributes to the existing literature on agency and political economy theories by using two types, and thus broadening the measurement parameters, of political influences. The empirical findings that suggest the presence of politically connected people on the board or in senior management can create agency costs, which may lead to lower-quality financial reporting, are of great importance. To reduce these costs, stronger regulatory bodies and enlightened shareholders are therefore necessary. The findings of this study enable shareholders to evaluate the negative effects of politically connected people on overall financial reporting quality, which will help them protect their interests and put pressure on the directors to report non-manipulated earnings. Furthermore, stakeholders can use the findings to identify those factors to be considered when evaluating a firm’s financial reporting quality. In summary, the results of this study suggest that political influences can contribute to the creation of agency problems, reducing overall financial reporting quality.
) and CEO incentives using the CEO annual bonus. This study is the first to examine how CEO incentives mediate the relationship between political influences and financial reporting quality. Thus, it contributes to the field of corporate governance and earnings management, integrating the agency and political economy theories, and adding to the ongoing debate about the role of political influences in emerging markets. Moreover, it demonstrates the underlying mechanism (i.e., CEO incentives) through which politically influenced firms manipulate earnings through REM. As such, this study can offer policymakers and regulators insights into improving corporate governance practices in transitional economies such as Pakistan, where politics and business is closely entwined. This study further contributes to the existing literature on agency and political economy theories by using two types, and thus broadening the measurement parameters, of political influences. The empirical findings that suggest the presence of politically connected people on the board or in senior management can create agency costs, which may lead to lower-quality financial reporting, are of great importance. To reduce these costs, stronger regulatory bodies and enlightened shareholders are therefore necessary. The findings of this study enable shareholders to evaluate the negative effects of politically connected people on overall financial reporting quality, which will help them protect their interests and put pressure on the directors to report non-manipulated earnings. Furthermore, stakeholders can use the findings to identify those factors to be considered when evaluating a firm’s financial reporting quality. In summary, the results of this study suggest that political influences can contribute to the creation of agency problems, reducing overall financial reporting quality.
| Funding: This study received no specific financial support. |
| Competing Interests: The authors declare that they have no competing interests. |
| Contributors/Acknowledgement: All authors contributed equally to the conception and design of the study. |
REFERENCES
Al-Dhamari, R. and K.K.N.I. Ismail, 2015. Cash holdings, political connections, and earnings quality: Some evidence from Malaysia. International Journal of Managerial Finance, 11(2): 215-231.Available at: https://doi.org/10.1108/ijmf-02-2014-0016.
Baker, T., D. Collins and A. Reitenga, 2003. Stock option compensation and earnings management incentives. Journal of Accounting, Auditing & Finance, 18(4): 557-582.Available at: https://doi.org/10.1177/0148558x0301800409.
Benmelech, E., E. Kandel and P. Veronesi, 2010. Stock-based compensation and CEO (dis) incentives. The Quarterly Journal of Economics, 125(4): 1769-1820.Available at: https://doi.org/10.1162/qjec.2010.125.4.1769.
Braam, G., M. Nandy, U. Weitzel and S. Lodh, 2015. Accrual-based and REM and political connections. The International Journal of Accounting, 50(2): 111-141.Available at: https://doi.org/10.1016/j.intacc.2013.10.009.
Chaney, P.K., M. Faccio and D. Parsley, 2011. The quality of accounting information in politically connected firms. Journal of Accounting and Economics, 51(1-2): 58-76.Available at: https://doi.org/10.1016/j.jacceco.2010.07.003.
Cheema, M.U., R. Munir and S. Su, 2016. Political connections and organisational performance: Evidence from Pakistan. International Journal of Accounting & Information Management, 24(4): 321-338.Available at: https://doi.org/10.1108/ijaim-05-2016-0053.
Chen, C.J., Y. Ding and C.F. Kim, 2010. High-level politically connected firms, corruption, and analyst forecast accuracy around the world. Journal of International Business Studies, 41(9): 1505-1524.Available at: https://doi.org/10.1057/jibs.2010.27.
Cheng, Q. and T.D. Warfield, 2005. Equity incentives and earnings management. The Accounting Review, 80(2): 441-476.Available at: https://doi.org/10.2308/accr.2005.80.2.441.
Chi, J., J. Liao and X. Chen, 2016. Politically connected CEOs and earnings management: Evidence from China. Journal of the Asia Pacific Economy, 21(3): 397-417.Available at: https://doi.org/10.1080/13547860.2016.1176644.
Crocker, K.J. and J. Slemrod, 2007. The economics of earnings manipulation and managerial compensation. The RAND Journal of Economics, 38(3): 698-713.Available at: https://doi.org/10.1111/j.0741-6261.2007.00107.x.
Fahlenbrach, R. and R.M. Stulz, 2011. Bank CEO incentives and the credit crisis. Journal of Financial Economics, 99(1): 11-26.Available at: https://doi.org/10.1016/j.jfineco.2010.08.010.
Goldman, E. and S.L. Slezak, 2006. An equilibrium model of incentive contracts in the presence of information manipulation. Journal of Financial Economics, 80(3): 603-626.Available at: https://doi.org/10.1016/j.jfineco.2005.05.007.
Guedhami, O., J.A. Pittman and W. Saffar, 2014. Auditor choice in politically connected firms. Journal of Accounting Research, 52(1): 107-162.Available at: https://doi.org/10.1111/1475-679x.12032.
Healy, P.M., 1985. The effect of bonus schemes on accounting decisions. Journal of Accounting and Economics, 7(1-3): 85-107.Available at: https://doi.org/10.1016/0165-4101(85)90030-8.
Jensen, M.C. and K.J. Murphy, 1990. Performance pay and top-management incentives. Journal of Political Economy, 98(2): 225-264.Available at: https://doi.org/10.1086/261677.
Jiang, J.X., K.R. Petroni and I.Y. Wang, 2010. CFOs and CEOs: Who have the most influence on earnings management? Journal of Financial Economics, 96(3): 513-526.Available at: https://doi.org/10.1016/j.jfineco.2010.02.007.
Liu, X., R. Saidi and M. Bazaz, 2014. Institutional incentives and earnings quality: The influence of government ownership in China. Journal of Contemporary Accounting & Economics, 10(3): 248-261.Available at: https://doi.org/10.1016/j.jcae.2014.10.003.
Liu, Y., Z. Wei and F. Xie, 2016. CFO gender and earnings management: Evidence from China. Review of Quantitative Finance and Accounting, 46(4): 881-905.Available at: https://doi.org/10.1007/s11156-014-0490-0.
Meek, G.K., R.P. Rao and C.J. Skousen, 2007. Evidence on factors affecting the relationship between CEO stock option compensation and earnings management. Review of Accounting and Finance, 6(3): 304-323.Available at: https://doi.org/10.1108/14757700710778036.
Roychowdhury, S., 2006. Earnings management through real activities manipulation. Journal of Accounting and Economics, 42(3): 335-370.Available at: https://doi.org/10.1016/j.jacceco.2006.01.002.
Sadiq, M. and Z. Othman, 2017. Earnings manipulations in politically influenced firms. Corporate Ownership & Control, 15(1): 65-71.Available at: https://doi.org/10.22495/cocv15i1art6.
Saleh, N.M. and K. Ahmed, 2005. Earnings management of distressed firms during debt renegotiation. Accounting and Business Research, 35(1): 69-86.Available at: https://doi.org/10.1080/00014788.2005.9729663.
Zang, A.Y., 2011. Evidence on the trade-off between real activities manipulation and accrual-based earnings management. The Accounting Review, 87(2): 675-703.Available at: https://doi.org/10.2308/accr-10196.
Views and opinions expressed in this article are the views and opinions of the author(s), International Journal of Asian Social Science shall not be responsible or answerable for any loss, damage or liability etc. caused in relation to/arising out of the use of the content. |