


IMPACT OF IMPORT AND EXPORT ON GDP OF EGYPT: APPLICATION OF ARDL MODEL

1,2,3Faculty of Economics and Management, Universiti Kebangsaan Malaysia, 43600 UKM Bangi, Malaysia
ABSTRACT
This paper examines the applications of Autoregressive Distributed Lag (ARDL) model in the analysis of Egypt’s import and export data concerning the consequential impacts on the country’s Gross Domestic Product (GDP) between 1980 to 2010 years. Given that exports and imports significantly impact the economic status of Egypt through the balance of payment, it is therefore vital for policymakers to adequately comprehend and understand the factors affecting the revenue of the country’s economy. The study provides a wide range of elasticity estimates made from the data collected in the field. Moreover, this paper seeks to examine the current estimated import and export demand function for Egypt by employing the ARDL approach using the Eviews program. The results from ARDL approach analysis agrees with the hypothesis that Egypt has a long run relationship with export, import demand, economic growth prices of exports and imports, and volatility of an actual effective exchange rate in the market. Therefore, the imports and exports in Egypt are affected by the country’s GDP. Hence it is growth driven.
Keywords:Gross domestic product, Autoregressive distributed lag model, Regression test, Egypt.
ARTICLE HISTORY: Received:17 August 2018 Revised:21 September 2018 Accepted:24 October 2018 Published:28 November 2018
Contribution/ Originality:This study provides more insights into the applications of (ARDL) model in the analysis of Egypt’s import and export data. It is hoped that this article will help researchers to make informed decisions regarding the current estimated import and export demand function for Egypt by employing the ARDL approach.
1. INTRODUCTION
Econometric analysis of exports and imports has recently become an area of much focus of most empirical and theoretical research in economics. Even though several types of statistical techniques and methodologies are typically used in analyzing economic data, ARDL stands out to be the appropriate method for analyzing data on country’s trade and economic analysis. For that reason, the ARDL model is commonly used for regression analysis. However, a more comprehensive an elongated approach and tools can be utilized depending on variability’s exhibited by variables used in the analysis or the specific trade activities captured in the data. The ARDL model is a model typically used for regression analysis and is focused mainly on analysis testing probability aspects (Alkhuzaim, 2004![]() ). The ARDL model utilizes the concept of a singly reduced equation and a more detailed and comprehensive outcome than any other traditional integration methods. Besides, operations done using ARDL are more efficient and convenient for both the analyst and the reader of the results and analysis. The ARDL model depicts reliable results that are effective for establishing both short- and long-term data relationships especially between investments and valued growth prospects. The ARDL approach used in this study does not account for the variables existing before the testing phase. However, the approach indicates that the test for any fixed relationship between variables in the various levels can be applied without taking into consideration its ability to underlie regression values which are purely I (0) and I (1) respectively or both: this feature of ARDL unjustified the standard of cointegration technique and unit root tests. Other than this, there are aspects of the ARDL approach that makes it possible to find different and similar logs from a variety of variables in the set data. This makes the ARDL an appropriate method to use in analyzing information on imports, exports, and GDP of Egypt. Over a decade ago, Egypt suffered from a massive balance deficit due to the unprecedented growth of imports contrary to the modestly growing exports, as the imports had been rising much faster than the exports. Statistics show that Egypt recorded a negative balance payment in the most recent years associated with more import of chemicals and minerals products which account for 25 percent of the imports, livestock, and foodstuffs comprising 24 percent of the imports, machinery and electrical equipment, textiles, base metals among other imports. The increase in domestic demand is attributed. Merza (2007
). The ARDL model utilizes the concept of a singly reduced equation and a more detailed and comprehensive outcome than any other traditional integration methods. Besides, operations done using ARDL are more efficient and convenient for both the analyst and the reader of the results and analysis. The ARDL model depicts reliable results that are effective for establishing both short- and long-term data relationships especially between investments and valued growth prospects. The ARDL approach used in this study does not account for the variables existing before the testing phase. However, the approach indicates that the test for any fixed relationship between variables in the various levels can be applied without taking into consideration its ability to underlie regression values which are purely I (0) and I (1) respectively or both: this feature of ARDL unjustified the standard of cointegration technique and unit root tests. Other than this, there are aspects of the ARDL approach that makes it possible to find different and similar logs from a variety of variables in the set data. This makes the ARDL an appropriate method to use in analyzing information on imports, exports, and GDP of Egypt. Over a decade ago, Egypt suffered from a massive balance deficit due to the unprecedented growth of imports contrary to the modestly growing exports, as the imports had been rising much faster than the exports. Statistics show that Egypt recorded a negative balance payment in the most recent years associated with more import of chemicals and minerals products which account for 25 percent of the imports, livestock, and foodstuffs comprising 24 percent of the imports, machinery and electrical equipment, textiles, base metals among other imports. The increase in domestic demand is attributed. Merza (2007![]() ) notes that the long-term economic growth in Egypt fundamentally hinges on imports of Capital goods especially production machinery used in the textile industry and wood for furniture making. However, the effectiveness of Egypt’s international trade policy majorly relies on price elasticity’s and the magnitude of income for the exports and imports as well as the volatility of the market exchange rate. Linear and non-linear ARDL model is the most appropriate methodology to be used in the analysis of such data. The ARDL approach analysis and estimates are held on the grounds of an assumption that the annual GDP of Egypt is the dependent variable. The primary focus of the ARDL model in this research paper is to test the results based on the accumulated information generated from the data collected from the imports and exports of Egypt. This paper attempts to assess the export and import function of Egypt and the correlation of the impacts on the economic GDP by establishing a clear relationship between variables. Because the paper assesses the aggregate data concerning the exports and imports in Egypt, it is crucial to establish a time frame for the research. Additionally, the paper aims to come up with a linear and non-presentation of export and import data which can be presented graphical according to the ARDL results.
) notes that the long-term economic growth in Egypt fundamentally hinges on imports of Capital goods especially production machinery used in the textile industry and wood for furniture making. However, the effectiveness of Egypt’s international trade policy majorly relies on price elasticity’s and the magnitude of income for the exports and imports as well as the volatility of the market exchange rate. Linear and non-linear ARDL model is the most appropriate methodology to be used in the analysis of such data. The ARDL approach analysis and estimates are held on the grounds of an assumption that the annual GDP of Egypt is the dependent variable. The primary focus of the ARDL model in this research paper is to test the results based on the accumulated information generated from the data collected from the imports and exports of Egypt. This paper attempts to assess the export and import function of Egypt and the correlation of the impacts on the economic GDP by establishing a clear relationship between variables. Because the paper assesses the aggregate data concerning the exports and imports in Egypt, it is crucial to establish a time frame for the research. Additionally, the paper aims to come up with a linear and non-presentation of export and import data which can be presented graphical according to the ARDL results.
1.1. Objectives
The objectives of ARDL in this study are classified as primary and secondary. The primary objectives associated with this model refer to all information derived from the regression, test analysis, and probability analysis of imports, exports, and GDP information of Egypt. On the other hand, the secondary objectives entail all the relevant in information available relating to Egypt’s economy.
1.1.1. Primary Objective
Apply econometric techniques for assessing relationship and analysis of information on imports, exports, and GDP of Egypt. Use of the ARDL model is to estimate and analyze the data collected on imports, exports and GDP of Egypt.
1.1.2. Secondary Objectives
To analyze the economic status of Egypt in relation to data collected on imports, exports, and GDP since the year 1980 to 2010.
2. LITERATURE REVIEW
The ARDL approach was majorly popularized by Pesaran between 1997 and 2001 due to its numerous advantages (Pesaran, 1997![]() ) The primary advantage of ARDL model is the fact that it can be applied irrespective of (0) or I (1) variables (Oskooee and Oyolola, 2007
) The primary advantage of ARDL model is the fact that it can be applied irrespective of (0) or I (1) variables (Oskooee and Oyolola, 2007![]() ) The second advantage of this model is that it can take a wide range of numbers of lags that are captured in the data generating process especially in a more general-to-specific approach of ARDL modeling framework (McCann et al., 2010
) The second advantage of this model is that it can take a wide range of numbers of lags that are captured in the data generating process especially in a more general-to-specific approach of ARDL modeling framework (McCann et al., 2010![]() ). On top of that, the Dynamic Error Correction Model (ECM) can be generated from the ARDL by applying a simple linear transformation. Furthermore, economists have commonly recommended the use of ADRL because the model minimizes mistakes and random errors that may be experienced due to non-stationary series data.
). On top of that, the Dynamic Error Correction Model (ECM) can be generated from the ARDL by applying a simple linear transformation. Furthermore, economists have commonly recommended the use of ADRL because the model minimizes mistakes and random errors that may be experienced due to non-stationary series data.
The simple model used to illustrate the ARDL modeling approach is as follows:
yt =α+βxt +δz t + et
where yt, xt, and zt represent the different time series; et is the stochastic vector expressed in terms of; a and b which are the parameters.
In the context of data on exports and imports in relation to GDP of Egypt; the substantial level of functional and practical implications of the data is established from the analysis and assessment of the data. The ARDL model is constructed and determines whether data has the characteristic; J-curve phenomenon. According to Dunning and Lundan (2008![]() ) the balance of trade is a typical characteristic of globalized economies and is considered as a most significant economic indicator. The countries that have a rapidly growing GDP are the successful economies and are usually characterized by more exports than imports. Aharoni (2015
) the balance of trade is a typical characteristic of globalized economies and is considered as a most significant economic indicator. The countries that have a rapidly growing GDP are the successful economies and are usually characterized by more exports than imports. Aharoni (2015![]() ) argues that the effects volatility of the exchange rate subtends to impact on foreign investments in the country. The higher the volatility of exchange rate in the country, the more the averse on traders and foreign trade due to fearing the cost of risk. The exchange rate is always agreed on when the trade contract is signed; however, the payment is not made. Instead, it is made upon the delivery of goods. Changes in exchange rates of a country make it difficult to predict the cost hence causing uncertainty and decline benefits from foreign trade. Aliprantis et al. (2007
) argues that the effects volatility of the exchange rate subtends to impact on foreign investments in the country. The higher the volatility of exchange rate in the country, the more the averse on traders and foreign trade due to fearing the cost of risk. The exchange rate is always agreed on when the trade contract is signed; however, the payment is not made. Instead, it is made upon the delivery of goods. Changes in exchange rates of a country make it difficult to predict the cost hence causing uncertainty and decline benefits from foreign trade. Aliprantis et al. (2007![]() ) point out that the disputes views among trade on undiversified exchange risk decline the benefits from foreign trade. Gali and Monacelli (2005
) point out that the disputes views among trade on undiversified exchange risk decline the benefits from foreign trade. Gali and Monacelli (2005![]() ) also contend that impact of volatility exchange rate in the economy depend on the economic wave prevailing in the market and can pose positive or negative implications on the trade volumes. From the empirical investigation of the J-curve hypothesis of Egypt’s exports and imports, data suggests that it has no J-curve. The most likely reason for the non-existence of J-curve is attributed to the nature of exports made by Egypt. The country exports more unfinished products as compared to finished products. This translates low-income return earned from the exports as well as low revenue to Egypt’s economy. Therefore, to correct the current state of balance of payments in the country, Egypt should resolve to export finished products rather than the unfinished products. Over the years, the country has been an exporter of unfinished products. In fact, there is no justified reason for the export of unfinished goods from the country instead there would be greater benefits if the country could consider producing and manufacturing most of the exports. So, to correct the trade balance of Egypt, devaluation has not been proved a suitable tool to tackle adverse aspects. Egypt needs specialization in producing the finished type of exportable products to earn more from exports. However, drawbacks have been experienced in previous studies. This is due to the use of standard ordinary least squares and partial adjustment approaches in regression analysis in determining the import and export impacts on Egypt’s GDP. The models are typically characterized by estimates and assumptions made on data collected pertaining to the area of study. Ideally, the methods assume the existence of an underlying equilibrium between the volumes of exports and imports and the variable on the models. Consequently, the end results have illustrated large deviations in Egypt. Besides, the ECM is unreliable since it only accommodates small sample sizes. Therefore, ARDL is the most appropriate model to be used in the study correlation of imports and exports in Egypt.
) also contend that impact of volatility exchange rate in the economy depend on the economic wave prevailing in the market and can pose positive or negative implications on the trade volumes. From the empirical investigation of the J-curve hypothesis of Egypt’s exports and imports, data suggests that it has no J-curve. The most likely reason for the non-existence of J-curve is attributed to the nature of exports made by Egypt. The country exports more unfinished products as compared to finished products. This translates low-income return earned from the exports as well as low revenue to Egypt’s economy. Therefore, to correct the current state of balance of payments in the country, Egypt should resolve to export finished products rather than the unfinished products. Over the years, the country has been an exporter of unfinished products. In fact, there is no justified reason for the export of unfinished goods from the country instead there would be greater benefits if the country could consider producing and manufacturing most of the exports. So, to correct the trade balance of Egypt, devaluation has not been proved a suitable tool to tackle adverse aspects. Egypt needs specialization in producing the finished type of exportable products to earn more from exports. However, drawbacks have been experienced in previous studies. This is due to the use of standard ordinary least squares and partial adjustment approaches in regression analysis in determining the import and export impacts on Egypt’s GDP. The models are typically characterized by estimates and assumptions made on data collected pertaining to the area of study. Ideally, the methods assume the existence of an underlying equilibrium between the volumes of exports and imports and the variable on the models. Consequently, the end results have illustrated large deviations in Egypt. Besides, the ECM is unreliable since it only accommodates small sample sizes. Therefore, ARDL is the most appropriate model to be used in the study correlation of imports and exports in Egypt.
3. METHODOLOGY
This study is based on the variables of the GDP, import and export of Egypt. In this research study, the main focus is to examine the impact of import and export on GDP of Egypt. To examine the impact, it is necessary to follow the right direction that can be showcased in this chapter. The equation that is derived to analyze the impact is as follows:
(Y = α + β1+ β2 + e)
According to above equation, the variables of our research can be determined as: Y= GDP, β1= Imports, β2= Exports, α = All others factors remain constant and e= chances of error. In this research study, the key emphasizes is on the quantitative research technique to develop the research in an effective manner. The secondary data is collected to analyze the impact of the export and import on the GDP by using the quantitative technique. In this research, the secondary data is adapted to analyze the impact of import and export on the GDP of Egypt. The secondary data obtained from the authentic source is more feasible to develop our research in an effective manner. In this research, the data is collected from the World Bank. The sample size is based on the 30 years data of import, export and GDP of Egypt. The data is gleaned from the period 1980-2010 of Egypt’s import, export and GDP. The utilized sample size is appropriate and reasonable to run the test and prove the desired equation of research aim. Data analysis is the significant approach to analyze the data and consider the outcome according to the desired objective. The comparison takes place to analyze that what actually the theoretical review has showcased and what actual result has shaped. The data can be analyzed through multiple tests. These tests are based on the quantitative approach that includes regression, ARDL, LM-test and stability analysis.
3.1. Data Collection Process
The data can be collected in the form of primary and secondary. The primary data can be collected with the help of survey questionnaire and interview questions from the respondents .The secondary data can be collected from the authentic sources such as World Bank. The use of the published article is also the part of secondary data collection method. The secondary also helps to support the aim and objective included in the literature review. In this research, the secondary data is obtained to analyze the impact of import and export on the GDP of Egypt. The secondary data obtained from the authentic source is more feasible to develop our research effectively.
3.1.1. Sample Size
To analyze the impact of import and export on the GDP, it is important to select an appropriate sample from the valid and authentic sources. An optimum sample size helps the researcher to analyze the data without containing errors and the outcome can be achieved will be more authentic and significant. The selection of sample size is based on the aim of the research. In this research, the data is collected from the World Bank. The sample size is based on the 30 years’ data of the import, export and GDP of Egypt. The data is obtained from period 1980-2010 of Egypt’s import, export and GDP. The utilized sample size is appropriate and reasonable to run the test and prove the desired equation of research aim.
3.2. Data Analysis Method
Data analysis is the significant approach to analyse the data and consider the outcome according to the desired objective. The comparison takes place to analyse that what actually the theoretical review has showcased and what actual result has shaped. The data can be analysed through multiple tests using Eviews program. These tests are based on the quantitative approach that includes regression, ARDL, LM-test, and stability analysis.
3.2.1. Regression
A regression test is used to analyze the impact of the independent variable on a dependent variable with the influence of constant. Regression test helps the researcher to debug and detects undesirable causes occurs in the data. It helps the analyst to interpret the equation according to the desired outcome achieved from the test. It is usually based on OLS (Least Square Method). In this research, the regression test based on the OLS is used to find the relationship between the import and the export on the GDP.
3.2.2. ARDL Test
The unit test determines the validity of data. The ARDL test evaluates the co-integration of data based on the approach of Lag. In this test, the lag needs to be changed to find the right value of the prob. and f-statistics. In this research, the ARDL test is used to identify the co-integration between the GDP, the export and the import.
3.2.3. Lagrange Multiplier Test (Lm-Test)
LM-test is used to analyze the correlation between the variable. The most effective test for LM-test is the Breusch-Godfrey LM test for serial correlation.” It is necessary that there must be the least correlation between the variable. This correlation is beneficial to run the regression test to analyze the impact of the import and export on the GDP.
3.2.4. Stability Analysis
Stability analysis determines the stability of the data specifically for time-series and panel data. The stability analysis is used to provide the evidence about the variation of the data occur in specific time. The variation can be determined through the CUSUM and CUSUM square graph. These two graphs help in determining the variation of the data at the specified point.
4. TESTING, ANALYSIS, AND INTERPRETATIONS
4.1. ARDL Test
ARDL stands for (Autoregressive – distributed lag) models of this type have in use for decades. In time-series analysis, the ARDL test helps in analyzing results in the spurious integration between dependent and independent variables. It usually required three tests to select best of them. An appropriate estimation technique should be used to estimate the econometric models. The ARDL test is usually based on the lag model which can provide a very valuable data for testing for the presence of long-run relationships between the variable in time-series data.
4.1.1. Interpretation of ARDL Results at Lag 6
In this section, ARDL (Autoregressive Distributed Lag) model was developed for the GDP, export and import in which data is analyzed at lag 6. The data used is for Egypt on the GDP, export and import from 1980-2010. In the above result, the prob. values of all variables are greater than 0.05 and the value of their coefficient can be determined as follows:
GDP = -41.481 + -0.199 (Import) + -1.622 (Export) + e
The above equation shows that import and export has a negative impact on the GDP of Egypt. The result of Adj. R² indicates that the model is capturing 67% variation and its Prob. value shows that the effect of independent variables is insignificant.
4.1.2. Interpretation of ARDL Results at Lag 4
In this section, ARDL (Autoregressive Distributed Lag) model was developed for the GDP, export and import in which data is analyzed at lag 4. In the above result, the prob. values of all the variable are greater than 0.05 and the value of their coefficient can be determined as follows:
GDP = 10.468 + -0.137 (Import) + 0.065 (Export) + e
The above equation shows that import has a negative impact and export has a positive impact on the GDP of Egypt. The result of Adj. R² indicates that the model is capturing 32% variation and its Prob. value shows that the effect of independent variables is insignificant.
4.1.3. Interpretation of ARDL Results at Lag 2
In this section, the prob. values of all the variable are greater than 0.05 and the value of their coefficient can be determined as follows:
GDP = 5.407 + 0.107 (Import) + 0.133 (Export) + e
The above equation shows that import and export has a positive impact on the GDP of Egypt. The result of Adj. R² indicates that the model is capturing 25% variation and its Prob. value shows that the effect of independent variables is insignificant.
From the estimates of the 3 models, the model with lag 2 was selected as the best model based on Schwarz Criterion (SIC) and Akaike Info Criterion (AIC) criterion as illustrated in Table 1.Table-1. Results of AIC and SIC
Model |
AIC |
SIC |
Lag 6 |
-2.16 |
-3.24 |
Lag 4 |
-3.95 |
-4.73 |
Lag 2 |
-4.06 |
-4.93 |
Source: Eviews Program.
Three models with lag 2, lag 4 and lag 6 were estimated for GDP, IMPORT and EXPORT using ARDL. The best model was selected based on Schwarz Criterion (SIC) and Akaike Info Criterion (AIC). After checking the three models, lag 2 had the lowest value of AIC = -4.06 and SIC = -4.93 which implies that the model with lag 2 was the best model.
4.2. Series Correlation Test
To identify the correlation between the variables of the import, export and GDP, the LM-test considered as most appropriate and effective test. The values achieved from the LM test determine that all the variables are insignificant. The significance value is greater than 0.05 therefore, the null hypothesis is accepted and H1 is rejected. If the significance value of the variable is less than or equal to 0.05 then it can say that there is a correlation between the variable. The result of F-statistic p-value is 0.67 which is larger than p<0.05 that shows the acceptance of the null hypothesis. Therefore, it is concluded that the residuals are serially uncorrelated. Hence, the ARDL model has no serial correlation.
4.3. Stability Analysis
The stability analysis is used to find the stability and instability of the variables in a model. The most appropriate to evaluate stability is the CUSUM test. The stability test is based on two major graphs. 1st one is CUSUM and another one CUSUM Square. The point where the stability is disturbed will be shown in the graph below.
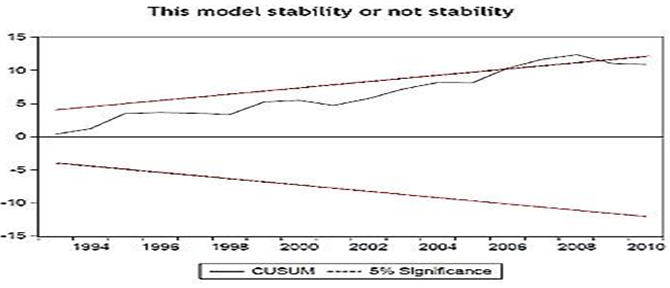
Figure- 1. CUSUM Model for Stability Analysis
Source: Eviews Program Analysis.
The above graph is based on the data from the year 1980 to 2006 which shows that the data from the year 2006 to 2008 getting disturbed and unstable. However, the history indicates that there is a drastic change in the economy in the year 2006-2008. There is a significant impact of import and export on GDP in the span of (2006-2008).
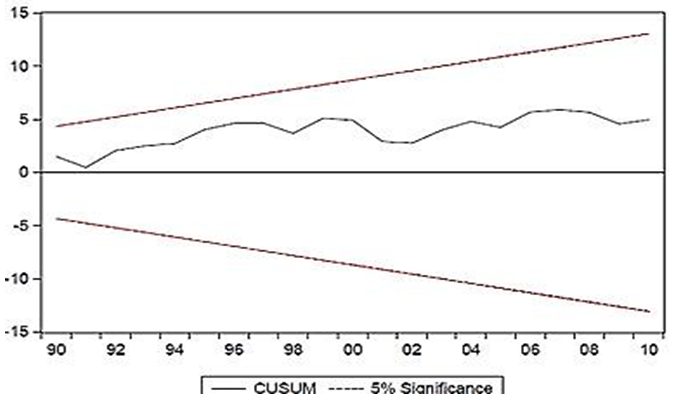
Figure-2. CUSUM Model Lag 1 Deleted
Source: Eviews Program Analysis.
After the disturbance of the data in the 1st graph of CUSUM, the value of instability is selected that is from the year 2006-2008 and lag (1) has removed from the model. The result shows in the above graph that indicated the stability of the model. It is clearly shown that none of the lines is crossing the critical value.
4.4. Wald Test Diagnostics
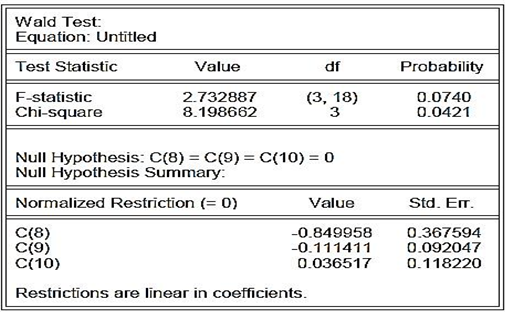
Figure-3. Wald Test Diagnosis
Source: Eviews Program Analysis
The result of the Wald Test shows that the F-statistic F (3, 18) = 2.73, since F-stat’s p-value=0.074 which is greater than 0.05, then we cannot reject the null hypothesis. Therefore, C (8) = C (9) = C (10) = 0 indicating that all three variables not move together in the long run. This implies that the null hypothesis of C (8) =C (9) = C (10) = 0 is retained.
4.5. Regression-Based on OLS Method
Regression is used to find out the relationship and impact between the variables. It is essentially used to determine the significance of the variable and examine the impact of the independent variable on the dependent variable.
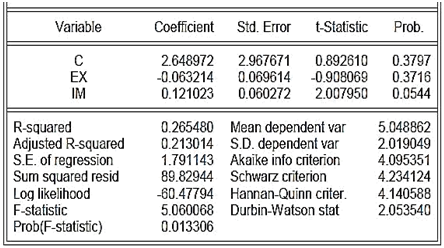
Figure-4. OLS Estimate of Import and Export Variables
Source: Eviews Program Analysis
4.5.1. Interpretation of Ordinary Least Squares (OLS)
In the above, the values show that there is no significance between the variable because all the prob. value is greater than 0.05. However, the value of the import is just near to significance value but not exactly the same. The equation which is derived from the objective is as follows:
GDP = α + β1 (Import) + β2 (Export) + e
From the above result of the OLS test, the equation can be transformed as follows:
GDP = 2.648 + 0.121 (Import) + -0.063 (Export) + e
According to above equation, it can be determined that due to a decrease in export by 0.0063, the variation will be seen in GDP. On the other hand the increase in the import by 1 unit, the GDP will increase by 0.121 units. However, this change is in the minor that can impact to the GDP of Egypt. Furthermore, the result of the OLS estimation shows that the export and import are jointly predicted GDP, R2 = 0.2655 which implies that both the import and the export accounted for 26.6%% variance in the prediction of the GDP. Hence, the result also shows that relatively Import significantly predicted GDP (β = 0.121; p<0.05) while the export did not significantly predict the GDP.
4.6. First Difference Model
In this first difference model, the data is re-tested by changing the values after adjustment of the import, export and GDP. Another variable is added with a name of Resid 01 to examine the impact of the desired equation. Similarly, all the previous tests will be retested by using this approach.
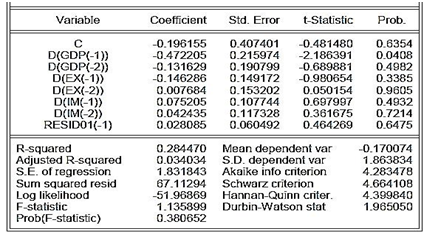
Figure-5. First Difference Model
Source: Eviews Program Analysis
4.6.1. Interpretation of First Difference Model
The outcome shows that the speed of adjustment variable resid01 in the First difference model between the GDP and the short run variables is the positively impacted coefficient of 0.028085 which implies that about 2.81% of the additional variable value influence in the disequilibrium that is corrected for within one period.
5. CONCLUSION AND RECOMMENDATION
The research is based on the investigation about the impact of import and export on GDP in Egypt. The objective of the research is divided into primary and secondary research objectives. The primary objective is to examine the relation of the import, export and GDP of Egypt. The secondary objective is to analyze the economic status of Egypt. The literature is based on the economic condition of Egypt from the year 1980 to 2010 year. The past studies have significantly showcased the impact of export on GDP. Similarly, some of the researchers are based on the impact of export on GDP. It has been noticed that most of the countries are growing their economies by an enhancement in the export activities and reduce the imports. Due to increase in the export, the GDP also increased because export has a direct relationship with GDP. However, the import has an indirect relationship with GDP according to the past studies. The analysis is based on the ARDL model to test the relationship of import and export on GDP. The further test is based on LM-test, OLS method, Stability analysis and Wald test. It is recommended to the responsible of Egypt economy that due to some modification in the activities of import and export, the GDP of Egypt can be improved significantly. With the support of achieved results, it is determined that by modification in the activities of export and import, the desired value can be achieved that is predicted (Bas and Strauss-Kahn, 2014![]() ). After analyzing the numbers of import and export, it is recommended that Egypt needs to focus on the export activities rather than import. They need to emphasize on increasing the export that can improve the GDP and also the economy in a better way. The developed countries such as the China, United States, and Japan etc. are likely to export goods more than imports. However, some developing and non-developed countries face some challenges in maintaining their economy in an appropriate manner. Certain deviation has been seen in their economies. The fluctuation can be improved and sustain by enhancing the export and reducing the import activities within the country. Similarly, this is also recommended to Egypt that they need to improve their export activities and reduce the imports as much as they can in order to improve their economy and GDP (Allegret et al., 2014
). After analyzing the numbers of import and export, it is recommended that Egypt needs to focus on the export activities rather than import. They need to emphasize on increasing the export that can improve the GDP and also the economy in a better way. The developed countries such as the China, United States, and Japan etc. are likely to export goods more than imports. However, some developing and non-developed countries face some challenges in maintaining their economy in an appropriate manner. Certain deviation has been seen in their economies. The fluctuation can be improved and sustain by enhancing the export and reducing the import activities within the country. Similarly, this is also recommended to Egypt that they need to improve their export activities and reduce the imports as much as they can in order to improve their economy and GDP (Allegret et al., 2014![]() ). The significance of the variables can be improvised by adding the important factor such as environmental and economic to enhance the GDP of a country. Therefore, these factors need to be considered by Egypt to improve their economy and GDP as well.
). The significance of the variables can be improvised by adding the important factor such as environmental and economic to enhance the GDP of a country. Therefore, these factors need to be considered by Egypt to improve their economy and GDP as well.
| Funding: This study received no specific financial support. |
| Competing Interests: The authors declare that they have no competing interests. |
| Contributors/Acknowledgement: All authors contributed equally to the conception and design of the study. |
REFERENCES
Aharoni, Y., 2015. The foreign investment decision process. International business strategy. London: Routledge.
Aliprantis, C.D., W.A. Barnett, B. Cornet and S. Durlauf, 2007. Special issue editors' introduction: The interface between econometrics and economic theory. Journal of Econometrics, 136(2): 325-329. Available at: https://doi.org/10.1016/j.jeconom.2005.11.011.
Alkhuzaim, W., 2004. Export-led growth hypothesis: Causality analysis for oil-based gulf cooperation council countries (Bahrain, Kuwait, Oman, Saudi Arabia, United Arab Emirates). USA: Page. pp: 3011-3011.
Allegret, J.-P., C. Couharde, D. Coulibaly and V. Mignon, 2014. Current accounts and oil price fluctuations in oil-exporting countries: The role of financial development. Journal of International Money and Finance, 47: 185-201. Available at: https://doi.org/10.1016/j.jimonfin.2014.06.002.
Bas, M. and V. Strauss-Kahn, 2014. Does importing more inputs raise exports? Firm-level evidence from France. Review of World Economics, 150(2): 241-275. Available at: https://doi.org/10.1007/s10290-013-0175-0.
Dunning, J.H. and S.M. Lundan, 2008. Multinational enterprises and the global economy. United Kingdom: Edward Elgar Publishing. pp: 295- 318.
Gali, J. and T. Monacelli, 2005. Monetary policy and exchange rate volatility in a small open economy. The Review of Economic Studies, 72(3): 707-734. Available at: https://doi.org/10.1111/j.1467-937x.2005.00349.x.
McCann, C.M., M. Baylis and D.J. Williams, 2010. The development of linear regression models using environmental variables to explain the spatial distribution of Fasciola hepatica infection in dairy herds in England and Wales. International Journal for Parasitology, 40(9): 1021-1028. Available at: https://doi.org/10.1016/j.ijpara.2010.02.009.
Merza, E., 2007. Oil exports, non-oil exports and economic growth: Time series analysis for Kuwait (1970–2004) (Doctoral Dissertation, Kansas State University).
Oskooee, B.-M. and M. Oyolola, 2007. Export growth and output growth: An application of bounds testing approach. Journal of Economics and Finance, 31(1): 1-11.
Pesaran, M.H., 1997. The role of economic theory in modelling the long run. The Economic Journal, 107(440): 178-191. Available at: https://doi.org/10.1111/1468-0297.00151.
Views and opinions expressed in this article are the views and opinions of the author(s), International Journal of Asian Social Science shall not be responsible or answerable for any loss, damage or liability etc. caused in relation to/arising out of the use of the content. |