


HOW SUSTAINABLE IS THE FOREIGN DIRECT INVESTMENT? IN THE CASE OF MALAYSIA

1,2,3,4School of Management, Faculty of Economics & Management, Universiti Kebangsaan Malaysia, Malaysia
ABSTRACT
Foreign Direct Investment (FDI) is one of the economic indicators of a country. Having a sustainable FDI would lead to a sustainable economy. In order to sustain the FDI, its determinants and how the changes in those determinants affect the FDI must be analyzed carefully. Once the impact of the determinants is known, then the next steps of making decisions or policies related to sustainable FDI, could easily and effectively be done. Different from previous studies, this paper examines to what extent the inflows of FDI would be related and affected by the environment, social and governance (ESG) factors, the vital sources for sustainable investment. The environment, social and governance factors include natural environment, natural resources, human capital, population, infrastructure, trade openness, and corruption. Those annual time series data were analyzed by using the ordinary least square regression and Granger causality analyses. The findings show that majority of the changes in those determinants have significant relationship with the FDI inflows. Many of the determinants are positively related to the FDI except for trade openness which is having negative relationship with FDI. However, changes in natural resources and infrastructure have no significant relation with the inflows of FDI. The result suggests that an emerging country like Malaysia, must continue enhancing those social, environmental and governance factors in the country to encourage the incoming of sustainable FDI, thus to develop sustainable economy.
Keywords:Foreign direct investment Environment Social Governance Determinants Sustainability Malaysia.
ARTICLE HISTORY: Received:17 July 2018 Revised:23 August 2018 Accepted:27 September 2018 Published:2 November 2018.
Contribution/ Originality:This study is one of very few studies which have investigated the impact and relationship of all the three sustainable development factors (ESG) in determining the inflows of the FDI to the country. Previous literature generally focus on the relationship between macroeconomic variables and FDI.
1. INTRODUCTION
Foreign Direct Investment (FDI) in developing economies has been phenomenal and has contributed to the overall economic growth of a country. According to the World Investment Report (UNCTAD, 2017 ![]() ) developing economies continue to attract half of global FDI inflows in the year of 2016, despite a fall in inflows. Global external financial flows to developing economies were estimated at $1.4 trillion in 2016, down from more than $2 trillion in 2010. FDI remains the largest, and one of the least volatile, of all external financial flows to developing countries. However, these flows sit well below the level of annual investment required to achieve the Sustainable Development Goals (SDGs) by 2030. A fall in inflows to developing economies was partly offset by modest growth in developed countries and a significant increase in transition economies.
) developing economies continue to attract half of global FDI inflows in the year of 2016, despite a fall in inflows. Global external financial flows to developing economies were estimated at $1.4 trillion in 2016, down from more than $2 trillion in 2010. FDI remains the largest, and one of the least volatile, of all external financial flows to developing countries. However, these flows sit well below the level of annual investment required to achieve the Sustainable Development Goals (SDGs) by 2030. A fall in inflows to developing economies was partly offset by modest growth in developed countries and a significant increase in transition economies.
As the international consumption and production have been shifted to emerging economies, many Multinational Companies (MNCs) are increasingly investing in both efficiency-seeking and market-seeking projects in these emerging countries. There are various empirical studies showing positive relationship between FDI and economic growth and FDI is a key component of the world’s growth engine. Hence many countries try to create favorable conditions to attract more FDI inflow into their economies (Jadhav, 2012 ![]() ).
).
Malaysia has been one of the most successful Southeast Asian countries in attracting FDI. Many policy instruments have been set up by Malaysian government to maintain the competitiveness of the FDI determinants. After being an independent state, Malaysia has taken advantage of both tangible assets like natural resources, abundant labor and intangible assets as well as macroeconomic stability, to bring in FDI. Based on Malaysia Investment Performance Reports 2017 (MIDA, 2018 ![]() ) Malaysia was the 23rd most competitive nation, 13th most inclusive development among developing economies, 24th for ease of doing business and 3rd strength of investor protection. Malaysia's FDI registered a growth equal to 4.03 % of the country's Nominal GDP in March 2018, compared with a growth equal to 3.47 % in the previous quarter.
) Malaysia was the 23rd most competitive nation, 13th most inclusive development among developing economies, 24th for ease of doing business and 3rd strength of investor protection. Malaysia's FDI registered a growth equal to 4.03 % of the country's Nominal GDP in March 2018, compared with a growth equal to 3.47 % in the previous quarter.
Foreign direct investment plays an important role in Malaysian economy for its ability to speed up the economic growth of this country. Since the whole world, especially the developed countries, is now focusing on Sustainable Development Goals, it is important to examine to what extent the sustainability factors or determinants would relate to or affect the inflows of FDI. If the sustainability factors have significant relations and impact on the FDI inflows, this would indicate the sustainability level of the FDI inflows itself, which would be one of the source of economic sustainability. It is also important to examine to what extent the inflows of FDI could influence the sustainability factors in a country. If there are such impact, thus, it is important to trace the type and nature of the incoming FDIs, to ensure of their contributions to the sustainability of the country’s economy.
Therefore, in this paper, we are to analyze the impact or relationship of environment, social and governance (ESG) factors on FDI inflows. Those environmental factors include natural environment and natural resources. Social factors include human capital, population, and infrastructure. Governance is represented by the corruption index and trade openness. Stock market and macroeconomics fundamentals are treated as controlled variables. This paper also examines the impact of FDI on those ESG factors.
The contribution of this paper is in exploring the impact and relationship of all the three sustainable development factors (ESG) in determining the inflows of the FDI to the country and the impact of the FDI inflows on the sustainability factors. Previous literature generally focused on the impact of macroeconomic variables on FDI and the impact of FDI on economic growth. Some of the studies are just focusing on the relationship between one or two of the sustainability factors and FDI, not as a whole elements of ESG. The findings of this paper would be able to provide recommendations and advice to the Malaysian and other emerging countries’ authorities on which ESG factors should be focused and developed further in order to attract more of sustainable FDI.
2. LITERATURE REVIEW
Foreign Direct Investment (FDI)
Most of the previous studies have been emphasizing on the determinants affecting the performance of the FDI. Study done by Mugableh (2015 ![]() ) has identified that the determinants of FDI are from macroeconomics factors. Those are money supply, consumer price index, exchange rates, gross domestic product, and trade. Adhikary (2017
) has identified that the determinants of FDI are from macroeconomics factors. Those are money supply, consumer price index, exchange rates, gross domestic product, and trade. Adhikary (2017 ![]() ) and Jadhav (2012
) and Jadhav (2012 ![]() ) also find that macroeconomic fundamentals, such as exchange rates and inflation, do affect the FDI. Other than macroeconomic fundamentals, Adhikary (2017
) also find that macroeconomic fundamentals, such as exchange rates and inflation, do affect the FDI. Other than macroeconomic fundamentals, Adhikary (2017 ![]() ) adds in market size, market potential, financial stability, financial deepening, domestic investment, stock turnover, infrastructure, and human capital, as determinants of FDI. In addition, Asiedu (2006
) adds in market size, market potential, financial stability, financial deepening, domestic investment, stock turnover, infrastructure, and human capital, as determinants of FDI. In addition, Asiedu (2006 ![]() ) and Jadhav (2012
) and Jadhav (2012 ![]() ) indicate that other than economics, institutional and political factors significantly attract FDI. On the other hand, Suleiman et al. (2015
) indicate that other than economics, institutional and political factors significantly attract FDI. On the other hand, Suleiman et al. (2015 ![]() ) show the positive impact of FDI on economic growth.
) show the positive impact of FDI on economic growth.
There are few studies looking for the relationships between few of the social, environment or governance factors on FDI but have not been looking at those as a whole under the perspective of sustainable FDI. This paper contributes in exploring the impact and relationship of all the three sustainable development factors (ESG) in determining the inflows of the FDI to the country and the impact of the FDI inflows on the sustainability factors.
FDI and Determinants
Prior studies (World Bank, 1993 ![]() ; Al-Sadig, 2009
; Al-Sadig, 2009 ![]() ; Ramasamy and Yeung, 2010
; Ramasamy and Yeung, 2010 ![]() ; Kahouli and Maktouf, 2015
; Kahouli and Maktouf, 2015 ![]() ; Shivee, 2015
; Shivee, 2015 ![]() ) as cited in Adhikary (2017
) as cited in Adhikary (2017 ![]() ) show that human capital or educated labor force is the general factor that attracts FDI in all South Asian economies. Meanwhile, Akin and Vlad (2011
) show that human capital or educated labor force is the general factor that attracts FDI in all South Asian economies. Meanwhile, Akin and Vlad (2011 ![]() ) state that secondary and tertiary education in current years and in the long-run have a positive and significant impact on FDI. The positive relationship between education and FDI is stronger in the case of middle-income countries and weaker for high-income and low-income countries as Zhang-Markusen theory is predicted (Akin and Vlad, 2011
) state that secondary and tertiary education in current years and in the long-run have a positive and significant impact on FDI. The positive relationship between education and FDI is stronger in the case of middle-income countries and weaker for high-income and low-income countries as Zhang-Markusen theory is predicted (Akin and Vlad, 2011 ![]() ).
).
Fereidouni Gholipour (2013 ![]() ) finds that FDI in Real Estate and FDI in other sectors do not necessarily contribute to CO2 emissions in emerging economies. Pao and Tsai (2011
) finds that FDI in Real Estate and FDI in other sectors do not necessarily contribute to CO2 emissions in emerging economies. Pao and Tsai (2011 ![]() ) state that there is strong bidirectional causality between emissions and FDI. Study done by Behera and Dash (2017
) state that there is strong bidirectional causality between emissions and FDI. Study done by Behera and Dash (2017 ![]() ) indicate that FDI significantly affects CO2 emission in the South and Southeast Asian (SSEA) region. Lau et al. (2014
) indicate that FDI significantly affects CO2 emission in the South and Southeast Asian (SSEA) region. Lau et al. (2014 ![]() ) say that FDI leads to higher industrial pollution and environmental degradation.
) say that FDI leads to higher industrial pollution and environmental degradation.
Unver and Koyuncu (2016 ![]() ) state that population growth is an important determinant of FDI inflows. The study of Alsan et al. (2004
) state that population growth is an important determinant of FDI inflows. The study of Alsan et al. (2004 ![]() ) show that total population has a positive and significant effect on FDI. FDI is not attracted to small market size and small income countries. Those countries should focus on investment framework and improvement of their institutions (Asiedu, 2006
) show that total population has a positive and significant effect on FDI. FDI is not attracted to small market size and small income countries. Those countries should focus on investment framework and improvement of their institutions (Asiedu, 2006 ![]() ).
).
Numbers of studies (Asiedu and Lien, 2011 ![]() ; Bokpin et al., 2015
; Bokpin et al., 2015 ![]() ; Suleiman et al., 2015
; Suleiman et al., 2015 ![]() ) conclude that natural resources significantly contribute to the relationship with FDI. Meanwhile, Hayat (2014
) conclude that natural resources significantly contribute to the relationship with FDI. Meanwhile, Hayat (2014 ![]() ) claims that there is a negative effect of natural resources on economic growth when a mean level of FDI inflow takes place. Natural resources of poor countries are not able to attract the FDI, thus, suggested to focus on investment framework and improvement of their institutions (Asiedu, 2006
) claims that there is a negative effect of natural resources on economic growth when a mean level of FDI inflow takes place. Natural resources of poor countries are not able to attract the FDI, thus, suggested to focus on investment framework and improvement of their institutions (Asiedu, 2006 ![]() ).
).
A study by Ahmad et al. (2015 ![]() ) reveals that besides GDP and exchange rate, infrastructure, especially in terms of telecommunication, also has positive impact on FDI in Malaysia. The findings suggest that the reduction of business cost through improvement of infrastructure helped to increase competitiveness in attracting FDI. Unver and Koyuncu (2016
) reveals that besides GDP and exchange rate, infrastructure, especially in terms of telecommunication, also has positive impact on FDI in Malaysia. The findings suggest that the reduction of business cost through improvement of infrastructure helped to increase competitiveness in attracting FDI. Unver and Koyuncu (2016 ![]() ) and Shivee (2015
) and Shivee (2015 ![]() ) also explain that countries with higher and quality infrastructure level will experience higher level of FDI. In terms of the impact of FDI on technology transfer, Potterie and Lichtenberg (2001
) also explain that countries with higher and quality infrastructure level will experience higher level of FDI. In terms of the impact of FDI on technology transfer, Potterie and Lichtenberg (2001 ![]() ) claim that the transfer only benefits the strong but not the non or weak technological local firms. Thus, there is lack of positive spillover from the FDI inflows into the country.
) claim that the transfer only benefits the strong but not the non or weak technological local firms. Thus, there is lack of positive spillover from the FDI inflows into the country.
Most of the literature (Asiedu, 2002 ![]() ; Ismail and Yussof, 2003
; Ismail and Yussof, 2003 ![]() ; Shivee, 2015
; Shivee, 2015 ![]() ; Xaypanya et al., 2015
; Xaypanya et al., 2015 ![]() ) demonstrate that trade openness plays an important role in attracting FDI. The greater the openness of a country in trading, the easier the trading transactions take place internationally, thus encouraging foreign MNCs to invest directly into the country. According to Kinuthia and Murshed (2015
) demonstrate that trade openness plays an important role in attracting FDI. The greater the openness of a country in trading, the easier the trading transactions take place internationally, thus encouraging foreign MNCs to invest directly into the country. According to Kinuthia and Murshed (2015 ![]() ) limited levels of trade, together with bad infrastructure and weak governance would lead to a weak economy and thus would unable to attract FDI. In terms of corruption, Asiedu (2006
) limited levels of trade, together with bad infrastructure and weak governance would lead to a weak economy and thus would unable to attract FDI. In terms of corruption, Asiedu (2006 ![]() ) proves that less corruption as well as efficient legal system would lead to greater inflows of FDI.
) proves that less corruption as well as efficient legal system would lead to greater inflows of FDI.
3. METHODOLOGY
This study uses annual time series data from 1994 to 2013, twenty years data and all variables are converted into natural log form. Data are collected from Data Bank on the official website of The World Bank Group and Department of Statistics Malaysia. We are not able to analyze the most recent data due to the unavailability of the 2014 onwards data for some of the variables. The data used in this study are as in Table 1. Data before 1994 on corruption index and trade openness are also not available.
Table-1. Descriptions of Variables and the Expected Results
Variables |
Abbreviation |
Detailed |
Expected Results (Relation with FDI) |
Foreign Direct Investment |
FDI |
Inflows of FDI, net inflows (BoP, current US$) (Dependent variable) |
|
Education (S) |
TE |
Gross enrolment ratio of tertiary education (% gross) |
+ |
Natural Environment (E) |
CO2 |
Carbon dioxide emission (metric tons per capita) |
+ |
Population (S) |
POP |
Total population |
+ |
Natural Resources (E) |
NR |
Total natural resources rents (% of GDP) |
- |
Infrastructure (E) |
INFR |
Investment in transport with private participation (current US$) |
+ |
Corruption Index (G) |
CI |
Corruption index that rank from a scale of 0 (high corruption) to 100 (no corruption) |
+ |
Trade Openness (G) |
TRADE |
Trade Openness as % of GDP |
+ |
Gross Domestic Product |
GDP |
GDP (Current, Local currency) |
+ |
Interest Rates |
IR |
Interbank offer rate |
- |
Exchange Rates |
ER |
MYR/US$ |
+ |
Consumer Price Index |
CPI |
CPI (base 2010) |
- |
Stock Market Index |
SMI |
FBMKLCI Index |
+ |
Source: Department of Statistics, Malaysia
The original data are analyzed by using time series graph, descriptive statistics, coefficient correlation, Granger causality, and ordinary least square regression. Long-run Johansen co-integration and vector auto-regression analyses could not be analyzed due to limited amount of data available. After checking for unit root using the Augmented Dickey-Fuller Test Statistic, the stationary data is used in analyzing the Ordinary Least Square Regression Model. Thus, the regression models analyze the relationships between the FDI and the changes in the determinants.
There are three applied Regression Models: (1) the determinants as independent variables without controlled macroeconomic variables, (2) only macroeconomic variables as independent variables, and (3) the determinants and controlled macroeconomic as independent variables. These are to specifically analyze the impact of the determinants with and without the macroeconomic variables.
FDI = C + β1TE + β2dCO2 + β3dPOP + β4dNR + β5dINFR + β6dCI + β7dTRADE + β8dSMI (1)
FDI = C + β9dGDP + β10dIR + β11dER + β12dCPI (2)
FDI = C + β1TE + β2dCO2 + β3dPOP + β4dNR + β5dINFR + β6dCI + β7dTRADE + β8dSMI + β9dGDP + β10dIR + β11dER + β12dCPI (3)
4. RESULTS AND DISCUSSION
Time Series Graphs, Descriptive Statistics and Correlation
FDI itself, generally shows the increasing trend throughout the 20 years periods. There was a sharp drop during U.S. subprime mortgage crisis in 2009, which shows the influence of the crisis on FDI as compared to the other four variables. It went to as low as US$115million and climbed back to the maximum amount of US$15,100 million in 2011. Indeed, the drop of the FDI during the Asian Financial Crisis in 1997-98, was not as bad as 2009 crisis. The US subprime mortgage crisis affected not only the U.S. but also the whole world.
In terms of correlations between two variables, majority of the determinants are significantly correlated with FDI except for natural resources and interest rates. Table 2 portrays high positive correlations of 0.50 to 0.73, in which the highest coefficients belonged to stock market and followed by, GDP, CO2, CPI, population, infrastructure and higher education (human capital). The greater the numbers of those determinants, the higher the amount of FDI. GDP and FDI are positively correlated but the impact of the 2009 crisis did not give severe impact to GDP as much as to FDI. An increase in CO2 could also led to higher FDI, in which without strict rules and regulation on environmental protection would affect our sustainability. This finding is similar to those found by Lau et al. (2014 ![]() ) as well as Pao and Tsai (2011
) as well as Pao and Tsai (2011 ![]() ) which indicate that there is a positive relationship between CO2 emission and FDI. Generally, greater population, better infrastructure and higher human capital are the other factors that related to an increase in FDI inflows. It is expected that FDI would be coming to the country when the inflation rate is lower. The results however portrays the same movements between the inflation and the FDI.
) which indicate that there is a positive relationship between CO2 emission and FDI. Generally, greater population, better infrastructure and higher human capital are the other factors that related to an increase in FDI inflows. It is expected that FDI would be coming to the country when the inflation rate is lower. The results however portrays the same movements between the inflation and the FDI.
On the other hand, trade openness, corruption and exchange rates are negatively correlated with FDI at the coefficients of -0.63, -0.42 and -0.41, respectively. The results indicate that the trade openness implemented in a country does not encourage investors to come and invest more in that country. The policy may just encourage international trading of export and import but not the inflows of FDI to the country. In terms of the governance, the results show that the greater the corruption of the country, the more FDI gets into the country.
Any increase or decrease of the costs of natural resources and interest rates would not significantly relate to the FDI. The correlation test results contradict to the believe that the lower the cost of the natural resources and the lower the interest rates for the firms requested for development loan, the higher the amount of FDI inflows.
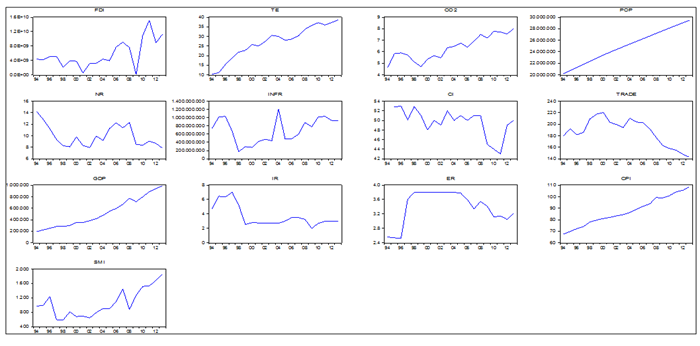
Figure-1. Time Series Graphs of FDI and the Determinants, 1994 – 2013
Note: FDI = Foreign Direct Investment; TE = Education; CO2 = Natural Environment; POP = Population; NR = Natural Resources; INFR = Infrastructure; CI = Corruption Index; TRADE = Trade Openness; GDP = Gross Domestic Product; ER = Exchange Rates MYR/US$; CPI = Consumer Price Index, SMI = Stock Market Index
Table-2. Correlation Coefficient of FDI and the Determinants, 1994 – 2013
FDI |
Prob |
FDI |
Prob |
||||
TE |
** |
0.5 |
0.03 |
TRADE |
*** |
-0.63 |
0 |
CO2 |
*** |
0.69 |
0 |
GDP |
*** |
0.72 |
0 |
POP |
*** |
0.62 |
0.01 |
IR |
-0.08 |
0.76 |
|
NR |
0.06 |
0.8 |
ER |
* |
-0.41 |
0.08 |
|
INFR |
** |
0.51 |
0.03 |
CPI |
*** |
0.65 |
0 |
CI |
* |
-0.42 |
0.07 |
SMI |
*** |
0.73 |
0 |
Pairwise Granger Causality Tests
Pairwise Granger Causality analysis proves further the relationship between the two variables in terms of cause-effect relationship. The results shown in Table 3 prove that natural environment (CO2), corruption, and trade openness, other than stock market index and some macroeconomic variables (GDP, CPI and ER), are not only significantly correlated to FDI but also become the significant sustainable determinants that could affect the inflows of the FDI. Population, human capital and infrastructure are significantly correlated to FDI but are not the determinants that could affect the FDI. Consistent with the earlier results, both natural resources and interest rates are not the determinants that could affect the FDI.
The natural environment (CO2) is the cause of FDI but FDI does not Granger Cause CO2. This result indicates that a country with no strict regulations on environmental protection would be able to attract more foreigners to invest directly into the country. This positive correlation is based on the positive correlation shown in Table 2. This result is consistent with the findings of Fereidouni Gholipour (2013 ![]() ) but contradict the findings of Lau et al. (2014
) but contradict the findings of Lau et al. (2014 ![]() ), Behera and Dash (2017
), Behera and Dash (2017 ![]() ). Stock market, corruption and trade openness are also the significant determinants of FDI. FDI inflows, however, is not the determinant of stock market, corruption and trade openness. The greater the performance of the stock market could generate higher inflows of the FDI into the country. The government policy on corruption and the openness of the country on trade would also affect the inflows of FDI.
). Stock market, corruption and trade openness are also the significant determinants of FDI. FDI inflows, however, is not the determinant of stock market, corruption and trade openness. The greater the performance of the stock market could generate higher inflows of the FDI into the country. The government policy on corruption and the openness of the country on trade would also affect the inflows of FDI.
For macroeconomic impact, the results show that productivity (GDP), inflation (CPI) and exchange rates (ER) are the significant determinants of FDI. Only interest rates (IR) show insignificant impact on FDI. Unlike CPI and ER, GDP is also found to be significantly affected by the FDI. In other words, due to better economic growth or GDP, more investors would be coming to Malaysia with their FDI. In addition, an increase in FDI inflows could also generate greater productivity (GDP) of a country. This is supported by Kinuthia and Murshed (2015 ![]() ) who claimed that FDI is dependent on economic growth, and economic growth is dependent on FDI. The FDI would only be attracted to the economy that is growing. Having economic growth would boost the infrastructure, trade level and better governance, thus attract FDI. The FDI in turn, will act as a catalysator in boosting the economic growth. Johnson (2006
) who claimed that FDI is dependent on economic growth, and economic growth is dependent on FDI. The FDI would only be attracted to the economy that is growing. Having economic growth would boost the infrastructure, trade level and better governance, thus attract FDI. The FDI in turn, will act as a catalysator in boosting the economic growth. Johnson (2006 ![]() ) adds that FDI has an effect on host country economic growth. He claims that the inflows of physical capital from outside and technological spillover through FDI, provide the highest impact and strongest potential to enhance economic growth in the home country. In addition, he discovers that FDI inflows enhance economic growth mostly, and usually only, in developing countries like Malaysia, but not in developed countries.
) adds that FDI has an effect on host country economic growth. He claims that the inflows of physical capital from outside and technological spillover through FDI, provide the highest impact and strongest potential to enhance economic growth in the home country. In addition, he discovers that FDI inflows enhance economic growth mostly, and usually only, in developing countries like Malaysia, but not in developed countries.
Table-3. Pairwise Granger Causality Test of FDI and the Determinants, 1994 – 2013
Null Hypothesis: |
F-Stat |
Prob. |
Null Hypothesis: |
F-Stat |
Prob. |
||
TE does not Granger Cause FDI |
1.83 |
0.2 |
* |
TRADE does not Granger Cause FDI |
3.8 |
0.05 |
|
FDI does not Granger Cause TE |
1.56 |
0.25 |
FDI does not Granger Cause TRADE |
1.51 |
0.26 |
||
** |
CO2 does not Granger Cause FDI |
5.01 |
0.02 |
*** |
GDP does not Granger Cause FDI |
10.96 |
0 |
FDI does not Granger Cause CO2 |
0.04 |
0.96 |
* |
FDI does not Granger Cause GDP |
3.71 |
0.05 |
|
POP does not Granger Cause FDI |
2.7 |
0.1 |
IR does not Granger Cause FDI |
0.59 |
0.57 |
||
* |
FDI does not Granger Cause POP |
3.37 |
0.07 |
FDI does not Granger Cause IR |
0.21 |
0.81 |
|
NR does not Granger Cause FDI |
1.02 |
0.39 |
* |
ER does not Granger Cause FDI |
2.91 |
0.09 |
|
FDI does not Granger Cause NR |
1.47 |
0.27 |
FDI does not Granger Cause ER |
0.51 |
0.61 |
||
INFR does not Granger Cause FDI |
1.14 |
0.35 |
** |
CPI does not Granger Cause FDI |
5.35 |
0.02 |
|
FDI does not Granger Cause INFR |
0.4 |
0.68 |
FDI does not Granger Cause CPI |
1.69 |
0.22 |
||
* |
CI does not Granger Cause FDI |
2.82 |
0.09 |
*** |
SMI does not Granger Cause FDI |
15.58 |
0 |
FDI does not Granger Cause CI |
0.13 |
0.88 |
FDI does not Granger Cause SMI |
0.26 |
0.78 |
Source: Department of Statistics, Malaysia
Granger Causality test shows no significant cause-effect relation between FDI and natural resources, FDI and infrastructure, and FDI and human capital. In terms of population, it is expected that the number of population in the country, which could contribute for the availability of labors and number of demands or consumers, could affect the FDI. The result, however, shows the opposite, that the FDI contributes to the population. This result contradicts to the findings of Unver and Koyuncu (2016 ![]() ) and Alsan et al. (2004
) and Alsan et al. (2004 ![]() ). Tertiary education, in other words, human capital, also has no significant effect on FDI which contradicts the findings of Akin and Vlad (2011
). Tertiary education, in other words, human capital, also has no significant effect on FDI which contradicts the findings of Akin and Vlad (2011 ![]() ). The findings on the causal relationship between infrastructure and FDI are inconsistent with the findings of Unver and Koyuncu (2016
). The findings on the causal relationship between infrastructure and FDI are inconsistent with the findings of Unver and Koyuncu (2016 ![]() ) and Ahmad et al. (2015
) and Ahmad et al. (2015 ![]() ). The result shows that countries with higher infrastructure level will not necessarily influence the FDI inflows. Natural resources do not cause FDI and FDI does not cause natural resources too. The two variables have no impact and correlation on each other. Therefore, the increasing or decreasing amount of natural resources rents in Malaysia does not affect the inflows of FDI.
). The result shows that countries with higher infrastructure level will not necessarily influence the FDI inflows. Natural resources do not cause FDI and FDI does not cause natural resources too. The two variables have no impact and correlation on each other. Therefore, the increasing or decreasing amount of natural resources rents in Malaysia does not affect the inflows of FDI.
Ordinary Least Square (OLS) Regression
OLS Regression test was applied to analyze the nature and form of relationship between the eight determinants and FDI. Taking into account the stationarity of all variables, we have come out with the OLS regression equation as equation (1) below. As shown in Table 4, the F-stats result is insignificant which indicates the poor model. In addition, none of the coefficients in the model apart from the intercept is statistically significant. Thus, the model needs to be reformulated.
Instead of analyzing the relationship of the eight determinants and FDI inflows, the macroeconomic variables are to be added as controlled variables. But let analyzed the relationship of those macroeconomic variables first as in equation (2). The F-stats test of equation (2) shows significant result. Thus the model is acceptable. The equation also has good adjusted R-square, an overall goodness of fit. Other than the intercept, the GDP also has significant coefficient. In equation (3), all the eight determinants are analyzed together with the four macroeconomic variables as controlled variables. The three OLS regression equations are as follows:
FDI = C + β1TE + β2dCO2 + β3dPOP + β4dNR + β5dINFR + β6dCI + β7dTRADE + β8dSMI (1)
FDI = C + β9dGDP + β10dIR + β11dER + β12dCPI (2)
FDI = C + β1TE + β2dCO2 + β3dPOP + β4dNR + β5dINFR + β6dCI + β7dTRADE + β8dSMI + β9dGDP +
β10dIR + β11dER + β12dCPI (3)
The equation (3) model is accepted since the F-statistics test is significant at 1%. The regression fit has been dramatically improved, having the adjusted R-square worth of 0.87. Based on the table below, only the changes in infrastructure and natural resources are insignificant. Thus there is no significant relationship between FDI and the two variables. All the other 6 determinants, having macroeconomic variables as controlled variables, are significantly related to the inflows of the FDI.
From six significant variables, four of them: population, human capital, corruption and stock market, are positively related to the FDI. These results are consistent with the previous findings indicating the greater the changes in the number of population and its level of human capital, the more FDI gets into the country. The better the performance of stock market returns would also relate to the sustainability of FDI inflows of a country. In terms of corruption, the changes in the corruption index would attract the FDI inflows more.
The other two significant determinants, carbon dioxide emissions (CO2) and trade openness, have significant negative relationship with FDI at 5% significant level. The results indicate the smaller the changes in CO2 and trade openness, the higher the FDI. The CO2 contributes to the pollution in a country. The greater the CO2 indicates the allowance given by the authority to continue having mega projects in developing the country, in other words, the allowance to pollute. The smaller the changes in the amount of allowed CO2 would encourage more inflows of the FDI. The change in the degree of openness of a country to international trade is proven to negatively affect the FDI inflows.
Table-4. Ordinary Least Square Regression Analysis of FDI and five other variables, 1994 -2013
Variable |
(1) Coefficient |
Prob. |
(2) Coefficient |
Prob. |
(3) Coefficient |
Prob. |
|||
LTE |
-5.13 |
0.21 |
10.28 |
0.01 |
** |
||||
DCI |
5.34 |
0.31 |
6.77 |
0.03 |
** |
||||
DCO2 |
-0.62 |
0.91 |
-9.85 |
0.01 |
** |
||||
DCPI |
20.17 |
0.23 |
36.95 |
0.02 |
** |
||||
DER |
-0.56 |
0.8 |
12.4 |
0.01 |
*** |
||||
DGDP |
10.24 |
0.03 |
** |
22.9 |
0 |
** |
|||
DINFR |
0.58 |
0.33 |
0.36 |
0.25 |
|||||
DIR |
0.67 |
0.51 |
2.69 |
0.03 |
** |
||||
DNR |
2.83 |
0.23 |
-0.56 |
0.69 |
|||||
DPOP |
-465.55 |
0.14 |
639.47 |
0.03 |
** |
||||
DSMI |
-1.38 |
0.2 |
5.46 |
0.01 |
*** |
||||
DTRADE |
9.12 |
0.21 |
-10.34 |
0.05 |
** |
||||
C |
48.67 |
0.023 |
** |
20.77 |
0 |
*** |
-27.75 |
0.09 |
* |
R-squared |
0.57 |
0.58 |
0.96 |
||||||
Adjusted R-squared |
0.19 |
0.45 |
0.87 |
||||||
S.E. of regression |
1.05 |
0.84 |
0.42 |
||||||
Sum squared resid |
9.86 |
9.82 |
0.87 |
||||||
Log likelihood |
-20.12 |
-20.69 |
1.74 |
||||||
F-statistic |
1.51 |
4.74 |
10.67 |
||||||
Prob(F-statistic) |
0.27 |
0.01 |
0.01 |
||||||
Mean dependent var |
22.12 |
22.12 |
22.12 |
||||||
S.D. dependent var |
1.17 |
1.13 |
1.17 |
||||||
Akaike info criterion |
3.24 |
2.7 |
1.25 |
||||||
Schwarz criterion |
3.68 |
2.95 |
1.89 |
||||||
Hannan-Quinn criter. |
3.3 |
2.75 |
1.34 |
||||||
Durbin-Watson stat |
1.34 |
1.08 |
1.78 |
Notes: *, **, *** indicate significance at the 0.1, 0.05 and 0.01 significant levels, respectively.
FDI = C + β1TE + β2dCO2 + β3dPOP + β4dNR + β5dINFR + β6dCI + β7dTRADE + β8dSMI (1)
FDI = C + β9dGDP + β10dIR + β11dER + β12dCPI (2)
FDI = C + β1TE + β2dCO2 + β3dPOP + β4dNR + β5dINFR + β6dCI + β7dTRADE + β8dSMI + β9dGDP + β10dIR + β11dER + β12dCPI (3)
LFDI = Foreign Direct Investment; LTE = Tertiary Education; DCO2 = Change of Natural Environment; DPOP = Change of Population; DNR = Change of Natural Resources; DINFR = Change of Infrastructure; DCI = Change of Corruption Index; DTRADE = Change of Trade Openness; DGDP = Change of Gross Domestic Product; DER = Change of Exchange Rates MYR/US$; DCPI = Change of Consumer Price Index, DSMI = Change of Stock Market Index
Natural resources and infrastructure are the two variables which have no significant relationship with the FDI inflows. These results contradict to the findings of the previous literature. It is expected that the higher the cost of the natural resources, the lower the FDI or the greater the availability of the natural resources, the greater the inflows of FDI. Similar to the concept of natural resources, the better the infrastructure provided in a country, the lower the business cost. Thus, this would attract more FDI (Unver and Koyuncu, 2016 ![]() ). Unfortunately, those two variables are not playing significant roles in attracting the FDI in Malaysia.
). Unfortunately, those two variables are not playing significant roles in attracting the FDI in Malaysia.
All the macroeconomic variables, GDP, CPI, exchange rates and interest rates, are found to have significant positive relationship with the inflows of FDI. These results are consistent with the findings of previous studies which stated GDP or economic growth (Tsai, 1994 ![]() ; Johnson, 2006
; Johnson, 2006 ![]() ; Har, 2008
; Har, 2008 ![]() ; Lean, 2010
; Lean, 2010 ![]() ; Kinuthia and Murshed, 2015
; Kinuthia and Murshed, 2015 ![]() ; Karimi, 2009
; Karimi, 2009 ![]() ) currency exchange rates (Solomon and Ruiz, 2012
) currency exchange rates (Solomon and Ruiz, 2012 ![]() ) have significant and positive relationship with FDI inflows in Malaysia. Solomon and Ruiz (2012
) have significant and positive relationship with FDI inflows in Malaysia. Solomon and Ruiz (2012 ![]() ) prove that the uncertainty of the foreign exchange rate will reduce the foreign direct investment inflows. Inflation, however, is said to have negative relationship with FDI (Asiedu, 2002
) prove that the uncertainty of the foreign exchange rate will reduce the foreign direct investment inflows. Inflation, however, is said to have negative relationship with FDI (Asiedu, 2002 ![]() ; Shivee, 2015
; Shivee, 2015 ![]() ; Xaypanya et al., 2015
; Xaypanya et al., 2015 ![]() ). According to Asiedu (2002
). According to Asiedu (2002 ![]() ) the low inflation rate is a sign of economic stability which will attract foreign direct investment.
) the low inflation rate is a sign of economic stability which will attract foreign direct investment.
5. CONCLUSION
This paper examines the relationship of environment (natural environment, natural resources and infrastructure), social (human capital and population), governance (corruption and trade openness), and FDI in Malaysia, for the period between 1994 and 2013. The findings, as summarized in Table 5, generally, portray that six out of eight determinants are significantly related to FDI.
Natural environment, which is represented by pollution (CO2) plays important role in sustaining the FDI. The negative relationship indicates that lower pollution level would increase the sustainability of the FDI. Thus, to ensure the sustainability of the FDI, pollution issue must be addressed accordingly and green or environmentally relevant FDI must be emphasized. The cost of natural resources and infrastructure are found not related to and affecting FDI. These show that the cost of resources and infrastructure are not influencing the decision to invest in Malaysia but the clean and green environment are the concerns of foreign investors. Thus, to look for the environmentally relevant FDI inflows is crucial for the long-term growth of a country. The authorities, however, still need to be aware of the depletion of natural resources. Infrastructure may no longer be a major determinant in Malaysia after 1994 which might be due to its achievement in building up most strategic infrastructure facilities.
In terms of social development, human capital is another significant determinant with positive relation to FDI, even though the better qualification is not necessarily the cause of FDI. The increasing number of skilled and better qualified human resources available in the country would relate to the sustainability of the FDI. Thus, emphasizing on the contribution of the coming FDI in terms of skilled and expertise in the country is beneficial. Numbers of population is positively related to FDI but the results prove the significant of FDI itself in determining the population instead of vice-versa. Population is important in determining good number of suppliers and buyers for the economic sustainability.
Corruption and trade openness represent the corporate governance in the country. The results show both are the significant sustainable determinants to look into in order to sustain the FDI. Based on positive correlation, the FDI would be better when the corruption level is lower. Thus, a good governance practice is crucial to enhance the inflows of FDI. Trade openness on the other hand is negatively related to FDI. This indicate that the greater the degree of openness in trade, the lower the level of FDI. It is expected that trade openness would encourage better governance in a country in doing business. However, the result shows the opposite. This might be due to better or greater openness in the less developing countries in the region, such as Vietnam and Cambodia, which might manage to attract more of foreign FDI into their countries than to Malaysia.
Stock market performances are positively related to FDI inflows as well as the cause for the increase or decrease of FDI performance in Malaysia. The two variables, stock market and FDI, are having the strongest relationship as compared to other variables. All the four macroeconomic variables, GDP, CPI, IR and ER, are positively related to FDI. For cause-effect relationships, only interest rate (IR) is not the significant determinant of FDI. GDP acts in two ways. One is when the GDP affects and relates to FDI. Two is when FDI also affects the GDP. They are interrelated to each other.
Thus, Malaysian and other developing countries’ authorities have to pay greater attention on pollution, corruption levels and trade policy in order to sustain their FDIs. The authorities may look at the impact of industrial green development to control and reduce carbon dioxide emissions. We have to ensure that the production activities undertaken in the country to be done ethically and environmental friendly. Corruption should not be tolerable to ensure that everybody is given their rights and opportunities.
Table-5. Summary of the Results
Variables |
Abbrev |
Exp |
Corr |
Causality |
Regression |
Results |
X --> Y |
||||
Y --> X |
|||||
Natural Environment (E) |
CO2 |
+ |
0.69 |
-->** |
**-9.85 |
Natural Resources (E) |
NR |
- |
|||
Education (S) |
TE |
+ |
0.5 |
**10.28 |
|
Infrastructure (E) |
INFR |
+ |
0.51 |
||
Population (S) |
POP |
+ |
0.62 |
<--* |
**639.47 |
Trade Openness (G) |
TRADE |
+ |
-0.63 |
-->* |
**-10.34 |
Corruption Index (G) |
CI |
+ |
-0.42 |
-->* |
**6.77 |
Gross Domestic Product |
GDP |
+ |
0.72 |
-->*** <-- * |
**22.90 |
Interest Rates |
IR |
- |
**2.69 |
||
Exchange Rates |
ER |
+ |
-0.41 |
-->* |
***12.40 |
Consumer Price Index |
CPI |
- |
0.65 |
--> ** |
**36.95 |
Stock Market Index |
SMI |
+ |
0.73 |
‘à*** |
***5.46 |
Source: Department of Statistics, Malaysia
| Funding: This publication and conference are funded by Faculty of Economics and Management, Universiti Kebangsaan Malaysia under FEP Research Initiative Grant (EP-2017-044) and FEP Special Fund/Account (FEP1) respectively. |
| Competing Interests: The authors declare that they have no competing interests. |
| Contributors/Acknowledgement: My grateful appreciation goes to my other International Finance students of Semester 2, Session 2016/2017, for their inputs on this paper. Those students are Siham Arramach, Yew Ling Sin, Muhammed Said Caglar, Wang Zhentao, Yi Hongyu and Yang Yifan. |
REFERENCES
Adhikary, B.K., 2017. Factors influencing foreign direct investment in South Asian economies: A comparative analysis. South Asian Journal of Business Studies, 6(1): 8-37. Available at: https://doi.org/10.1108/sajbs-10-2015-0070.
Ahmad, N.A., N.W. Ismail and N. Nordin, 2015. The impact of infrastructure on foreign direct investment in Malaysia. International Journal of Management Excellence, 5(1): 584-590. Available at: https://doi.org/10.17722/ijme.v5i1.196.
Akin, M.S. and V. Vlad, 2011. The relationship between education and foreign direct investment: Testing the inverse u shape. European Journal of Economic and Political Studies, 4(1): 27-46.
Al-Sadig, A., 2009. The effects of corruption on FDI inflows. Cato Journal, 29(2): 267-294.
Alsan, M., D.E. Bloom and D. Canning, 2004. The effect of population health on foreign direct investment. NBER Working Papers 10596, National Bureau of Economic Research, Inc.
Asiedu, E., 2002. On the determinants of foreign direct investment to developing countries: Is Africa different? World Development, 30(1): 107-119. Available at: https://doi.org/10.1016/s0305-750x(01)00100-0
Asiedu, E., 2006. Foreign direct investment in Africa: The role of natural resources, market size, government policy, institutions and political instability. World Economy, 29(1): 63-77. Available at: https://doi.org/10.1111/j.1467-9701.2006.00758.x.
Asiedu, E. and D. Lien, 2011. Democracy, foreign direct investment and natural resources. Journal of International Economics, 84(1): 99-111.
Behera, S.R. and D.P. Dash, 2017. The effect of urbanization, energy consumption, and foreign direct investment on the carbon dioxide emission in the SSEA (South and Southeast Asian) region. Renewable and Sustainable Energy Reviews, 70: 96-106. Available at: https://doi.org/10.1016/j.rser.2016.11.201.
Bokpin, G.A., L. Mensah and M.E. Asamoah, 2015. Foreign direct investment and natural resources in Africa. Journal of Economic Studies, 42(4): 608-621.
Fereidouni Gholipour, H., 2013. Foreign direct investments in real estate sector and CO2 emission: Evidence from emerging economies. Management of Environmental Quality: An International Journal, 24(4): 463-476. Available at: https://doi.org/10.1108/meq-04-2012-0032.
Har, W.M., 2008. FDI and economic growth relationship: An empirical study on Malaysia. International Business Research, 1(2): 11-18.
Hayat, A., 2014. FDI and economic growth: The role of natural resources. MRPA Paper 57021, University Library of Munich, Germany.
Ismail, R. and I. Yussof, 2003. Labour market competitiveness and foreign direct investment: The case of Malaysia, Thailand and the Philippines. Papers in Regional Science, 82(3): 389-402 (2003). Available at: https://doi.org/10.1007/s10110-003-0170-2.
Jadhav, P., 2012. Determinants of foreign direct investment in BRICS economies: Analysis of economic, institutional and political factor. Procedia-Social and Behavioral Sciences, 37: 5-14. Available at: https://doi.org/10.1016/j.sbspro.2012.03.270.
Johnson, A., 2006. The effects of FDI inflows on host country economic growth. CESIS Working Paper Series, Paper No. 58, Royal Institute of Technology, Sweden.
Kahouli, B. and S. Maktouf, 2015. The determinants of FDI and the impact of the economic crisis on the implementation of RTAs: A static and dynamic gravity model. International Business Review, 24(3): 518-529. Available at: https://doi.org/10.1016/j.ibusrev.2014.10.009.
Karimi, 2009. FDI and economic growth in Malaysia. Asian African Journal of Economics and Econometrics, 9(1): 101-112.
Kinuthia, B.K. and S.M. Murshed, 2015. FDI determinants: Kenya and Malaysia compared. Journal of Policy Modeling, 37(2): 388-400. Available at: https://doi.org/10.1016/j.jpolmod.2015.01.013.
Lau, L.-S., C.-K. Choong and Y.-K. Eng, 2014. Investigation of the environmental Kuznets curve for carbon emissions in Malaysia: Do foreign direct investment and trade matter? Energy Policy, 68: 490-497. Available at: https://doi.org/10.1016/j.enpol.2014.01.002.
Lean, H.H., 2010. Linkages between foreign direct investment, domestic investment and economic growth in Malaysia. Prosiding PERKEM, 2: 48 – 57.
MIDA, 2018. Malaysia Investment Performance Report 2017. Annual Media Conference 2018 by YB Dato’ Seri Mustapa Mohamed, Minister of International Trade & Industry.
Mugableh, M.I., 2015. Time series analysis of inward foreign direct investment function in Malaysia. Procedia-Social and Behavioral Sciences 172: 679-685. Available at: https://doi.org/10.1016/j.sbspro.2015.01.419.
Pao, H.-T. and C.-M. Tsai, 2011. Multivariate Granger causality between CO2 emissions, energy consumption, FDI (foreign direct investment) and GDP (gross domestic product): evidence from a panel of BRIC (Brazil, Russian Federation, India, and China) countries. Energy, 36(1): 685-693. Available at: https://doi.org/10.1016/j.energy.2010.09.041.
Potterie, B.V.P.D.L. and F. Lichtenberg, 2001. Does foreign direct investment transfer technology across borders? Review of Economics and Statistics, 83(3): 490-497. Available at: https://doi.org/10.1162/00346530152480135.
Ramasamy, B. and M. Yeung, 2010. The determinants of foreign direct investment in services. The World Economy, 33(4): 573–596.
Shivee, R.K., 2015. Determinants of services FDI inflows in ASEAN countries. International Journal of Economics and Management, 9(1): 45 – 69.
Solomon, B. and I. Ruiz, 2012. Political risk, macroeconomic uncertainty, and the patterns of foreign direct investment. The International Trade Journal, 26(2): 181-198. Available at: https://doi.org/10.1080/08853908.2012.657592.
Suleiman, N.N., S.R. Kaliappan and N.W. Ismail, 2015. Determinants of foreign direct investment: Empirical evidence from Southern Africa customs union (SACU) countries. International Journal of Economics & Management, 9(1): 1-24.
Tsai, P.-L., 1994. Determinants of foreign direct investment and its impact on economic growth. Journal of Economic Development, 19(1): 137-163.
UNCTAD, 2017. Global investment trends. World Investment Report.
Unver, M. and C. Koyuncu, 2016. The impact of infrastructure on FDI inflows: A panel data analysis. 2nd International Osmaneli Social Sciences Congress, 12-14 October, Bilecik-Turkey.
World Bank, 1993. Global economic prospects. Washington, DC: World Bank.
Xaypanya, P., P. Rangkakulnuwat and S.W. Paweenawat, 2015. The determinants of foreign direct investment in ASEAN: The first differencing panel data analysis. International Journal of Social Economics, 42(3): 239-250. Available at: https://doi.org/10.1108/ijse-10-2013-0238.