


MICROSTRUCTURAL ANALYSIS OF AMORPHOUS AND NANOCRYSTALLINE Fe73.5-xCrxNb3Cu1Si13.5B9 ALLOY BY XRD ANALYSIS

1Department of physics, Govt. Rajendra College, Faridpur, Bangladesh
2,6Department of physics, Khulna University of Engineering & Technology, Khulna-9203, Bangladesh
3(BCSIR), Dhanmondi, Dhaka-1205, Bangladesh
4Department of physics, The University of Asia Pacific, Dhanmondi, Dhaka-1205, Bangladesh
5Materials Science Division, Atomic Energy Center, Dhaka 1000, Bangladesh
ABSTRACT
This thesis is based on the experimental investigation of the effect of grain size of Fe73.5-xCrxNb3Cu1Si13.5B9 [x = 7, 9, 10 & 12.5] alloys in the amorphous and annealed states. The samples are initially prepared in the amorphous state in the form of thin ribbons by rapid quenching technique at wheel speed of 25m/s in an Ar atmosphere. The alloy has been annealed in a controlled way in the temperature range of 450 - 800oC for 30 minutes. Amorphosity of the ribbon and nanocryatalline state was evaluated by XRD. In the optimized annealing condition the grain size has been obtained in the range of 11 - 30 nm. The primary crystallization phase shifts to higher annealed temperature with Cr content implying the enhancement of thermal stability of the amorphous alloys against crystallization due to increasing amount of Cr. The average grain size of the α-Fe (Si) phase, almost same under the identical annealing condition as the higher content Cr is increased. The peak shifts indicate the change of the values of Si-content of nanograins and therefore, the change of the values of lattice parameter of nanograins.
Keywords:X ray diffractomer (XRD) Scherrer’s formula Grain Size Full width at half maximum (FWHM).
ARTICLE HISTORY: Received:8 May 2018 Revised:1 June 2018 Accepted:5 June 2018 Published:7 June 2018.
1. INTRODUCTION
Magnetism is a discipline, which stimulated by both basic and practical motivations for the study of different nanostructures. Those nanostructured materials are distinguished from conventional polycrystalline materials by the size of the crystallites that compose them. Nanomaterials are generally materials that can have one dimension, two dimension or three dimension and can be specified within a size of 100 nanometer (1nm=10-9m). As the size reduces into the nanometer range, the materials exhibit peculiar and interesting physical, chemical, mechanical, magnetic and electrical properties compared to conventional coarse grained counterpart [1![]() ]. This new field based on nanomaterials has been named as nanotechnology and emerged as a new branch of science and technology, which is quite diverse and incorporates fields ranging from microelectronics to molecular biology [2
]. This new field based on nanomaterials has been named as nanotechnology and emerged as a new branch of science and technology, which is quite diverse and incorporates fields ranging from microelectronics to molecular biology [2![]() ]. But with the tremendous advancement of science and technology for the last two decades the idea that we should be able to economically arrange atoms in most of the ways permitted by physical law has grained fairly general acceptance.
]. But with the tremendous advancement of science and technology for the last two decades the idea that we should be able to economically arrange atoms in most of the ways permitted by physical law has grained fairly general acceptance.
In the last few decades many researchers have studied the different properties of nanomaterials [3![]() , 4
, 4![]() ] as well as the properties of partial substitution of many elements such as Mn [5
] as well as the properties of partial substitution of many elements such as Mn [5![]() ] Co [6
] Co [6![]() , 7
, 7![]() ] and Cr [8
] and Cr [8![]() ] substituted ferrites. In this study microstructural analysis of amorphous and nanocrystalline Fe73.5-xCrxNb3Cu1Si13.5B9 alloy has been studied by XRD Analysis.
] substituted ferrites. In this study microstructural analysis of amorphous and nanocrystalline Fe73.5-xCrxNb3Cu1Si13.5B9 alloy has been studied by XRD Analysis.
2. MATERIALS AND METHOD
Melt spinning is a widely used production method for rapidly solidifying materials as well as preparing amorphous metallic ribbon [9, 10![]() ]. In order to prepare amorphous of Fe73.5-xCrxNb3Cu1Si13.5B9 [x = 7, 9, 10 & 12.5] alloys, the melt spinning facilities was used at the Centre for Materials Science, National University of Hanoi, Vietnam.
]. In order to prepare amorphous of Fe73.5-xCrxNb3Cu1Si13.5B9 [x = 7, 9, 10 & 12.5] alloys, the melt spinning facilities was used at the Centre for Materials Science, National University of Hanoi, Vietnam.
The Quartz crucible has in its bottom part, a rectangular nozzle tip of 8 mm length and 0.7 mm width. The position of the nozzle tip can be adjusted with respect to cooper wheel surface, so that the molten alloy was perpendicularly ejected onto the wheel surface from a distance of about 0.3 mm. The small piece of the master alloy samples were inductively remelted inside the quartz tube crucible followed by ejecting the molten metal with over pressure of 250 mbar of 99.9% pure Ar supplied from an external reservoir through a nozzle onto a rotating copper wheel with surface velocity of 30 m/sec. The temperature was monitored by an external pyrometer from the upper surface of the molten alloy through a quartz window.
The metal alloys were ejected at a temperature of about 150 to 250 K above the melting point of the alloy. The resulting ribbon samples had thickness of about 20-25 μm and width ~6 mm. Processing parameters such as the thermal conductivity of the rotating quench wheel, wheel speed, ejection pressure, thermal history of the melt before ejection, distance between nozzle of quartz tube and rotating wheel, as well as processing atmosphere have been influenced on the microstructure and properties of melt-spun ribbons. The lower pressure of 250 mbar as mentioned above stabilizes the turbulence between melt pull and rotating copper wheel enhancing the heat transfer resulting in a more uniform quenching. As a result, a more uniform ribbon microstructure can be obtained at relatively low wheel speed. With increasing wheel speeds for a given ejection rate, the increasing extraction rate results in thinner ribbons.
3. RESULTS AND DISCUSSION
X-ray diffraction (XRD) is generally used for the identification of various phases while the grain size is estimated by high-resolution transmission electron microscope (HRTEM) and / or by X-ray diffraction. XRD has been used to identify crystalline phase in nanocrystalline materials. Nanocrystalline alloys are above crystalline and because of their crystallinity they exhibit Bragg scattering peaks in XRD experiments. However, due to their small size, significant fine particle broadening is observed in the Bragg peaks. For 50nm particles, a broadening of 0.2o at half width the peak is expected which can easily be measured. Using Scherrer’s formula of line broadening, particle size between 5 to 60nm can be measured using XRD.
In the present work, in order to study the crystallization onset temperature, XRD spectra have been recorded for the nominal composition Fe73.5-xCrxNb3Cu1Si13.5B9 [x = 7, 9, 10 & 12.5] annealed at 450o to 800o for 30 minutes. The approximately annealed samples were subjected to XRD by using a MTI Corporation built GSL-1600 x 40 tube furnace to examine the micro structural evaluation as a function of annealing temperature. From the experiment, four samples are annealed at different temperatures for 30 minute and every sample was taken under XRD analysis. From the output of XRD analysis three structural parameters such as calculated:
- Lattice Parameter (ao)
- Grain Size (Dg)
- Silicon Content (Si)
(i) Lattice Parameter Calculation
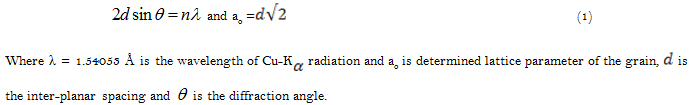
Lattice Parameter of crystalline bcc Fe-Si nanograin was determined at different annealing temperature of the experimental alloys. Structure of the a-Fe(Si) grains depends on the annealing temperature. Normally lattice Parameter of an alloy composition is determined by the Debye-Scherrer method after extrapolation of the diffraction curve for the sample. Generally for an accurate determination of the lattice parameter a number of fundamental peaks are required but in this type of tailored materials upon crystallization only major fundamental peaks (110) is used in calculation of ao. We have, therefore, determined the lattice parameter using only that particular reflection using equation:
(ii) Grain Size Determination
In 1963 Kneller and Luborsky [12![]() ] studied on nanograins. Found that the magnetic properties of isolated grains change drastically as their size is reduced to the nanometer range. When these nanometric grains are consolidated to form a nanostructured material, the magnetic properties are largely determined by the grain size and the exchange interaction between the adjacent grains. Herzer [13
] studied on nanograins. Found that the magnetic properties of isolated grains change drastically as their size is reduced to the nanometer range. When these nanometric grains are consolidated to form a nanostructured material, the magnetic properties are largely determined by the grain size and the exchange interaction between the adjacent grains. Herzer [13![]() ] successfully established the theoretical explanation on the grain size dependence of superior soft magnetic properties based on his Random Anisotropy Model (RAM) after the pioneer experimental invention of FINEMET alloy by Yoshizawa, et al. [13
] successfully established the theoretical explanation on the grain size dependence of superior soft magnetic properties based on his Random Anisotropy Model (RAM) after the pioneer experimental invention of FINEMET alloy by Yoshizawa, et al. [13![]() ]. One member of series FINEMET family is the sample Fe73.5-xCrxNb3Cu1Si13.5B9 [x = 7, 9, 10 & 12.5], which is under the investigation of the present work.
]. One member of series FINEMET family is the sample Fe73.5-xCrxNb3Cu1Si13.5B9 [x = 7, 9, 10 & 12.5], which is under the investigation of the present work.
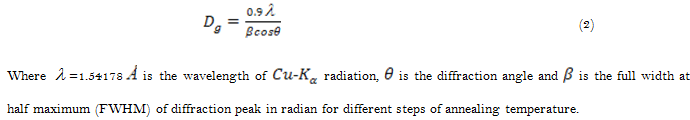
One of the most important aims of this study was to determine crystalline grain size for all the annealing temperatures. Grain size of all annealed samples of the alloy composition was determined using Scherrer method [14![]() ]. Grain size was determined from XRD pattern of (110) reflection for different annealing temperatures at constant annealing time 30 minutes from which grain size was determined using the formula
]. Grain size was determined from XRD pattern of (110) reflection for different annealing temperatures at constant annealing time 30 minutes from which grain size was determined using the formula
(iv) Si Content in Nanograins:
The major elements of the amorphous ribbon were Fe and Si with concentration of 61 to 66.5 at. % Fe and 13.5 at. % Si. Crystalline nanograins were formed on the ribbon in the process of annealing temperature with the alloy composition of Fe-Si. It is therefore important to determine the concentration of Fe, Cr and Si in the nanograin. As lattice parameter of the nanograins have been measured for different heat treatment conditions, it is easy to calculate the Si content in the nanograin from the quantitative relationship between lattice parameter (a) and Si-content (Si at.%) developed by Bozorth [15![]() ]. It is easy to calculate the Si content in the nanograin from the Pearson hand book relationship [16
]. It is easy to calculate the Si content in the nanograin from the Pearson hand book relationship [16![]() ]. From this relationship we have considered a simple equation to calculate Si-content from lattice parameter. This equation is
]. From this relationship we have considered a simple equation to calculate Si-content from lattice parameter. This equation is
b = -467ao + 1342.8 (3)
where b is at. % Si in the nanograins, ao is the lattice parameter of nanograins.
3.1. XRD Analysis of the Nanocrystalline Ribbon with Composition
Fe66.5Cr7Nb3Cu1Si13.5B9
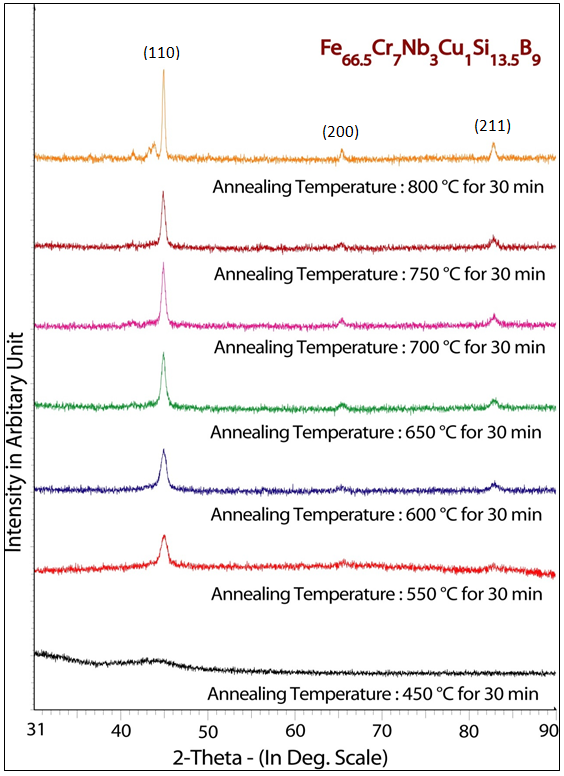
Figure-1. XRD spectra of Fe66.5Cr7Nb3Cu1Si13.5B9 alloys of annealed at different temperatures at constant annealing time 30 min
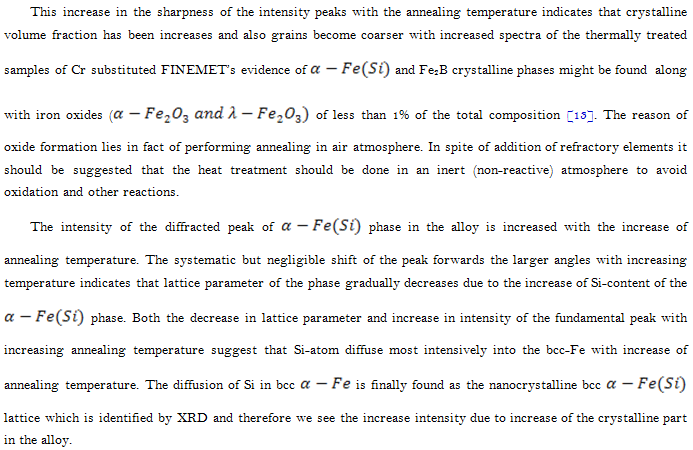
From DTA result it is expected that boride phase would form beyond 580.6oC but the formation of crystalline phase other than Fe(Si) in the XRD pattern has not been detected for Ta up to around 550oC for the sample as expected from the DTA analysis of samples. The XRD patterns illustrated in Fig. 5.14 reveal that the difference in the Bragg’s peak as well as the intensity of the fundamental reflections become gradually stronger as the temperature of the heat treatment increases.
The lattice parameter, the Si-content in bcc nanograins and the grain size of bcc grain can easily be calculated from the fundamental peak of (110) reflection. All the results are shown in Table-1.
Table-1. Experimental XRD data of nanocrystalline Fe66.5Cr7Nb3Cu1Si13.5B9 for different annealing temperature
Annealing Temp. in 0c |
θ (deg.) |
d (Å) |
FWHM (deg.) |
a0 (Å) |
Dg (nm) |
Si (at |
%) |
||||||
450 |
-- |
-- |
-- |
-- |
-- |
-- |
550 |
22.504 |
2.0141 |
0.765 |
2.8484 |
11 |
12.61 |
600 |
22.471 |
2.0169 |
0.66 |
2.8523 |
13 |
10.78 |
650 |
22.469 |
2.0171 |
0.485 |
2.5826 |
18 |
10.64 |
700 |
22.459 |
2.0179 |
0.466 |
2.8538 |
19 |
10.08 |
750 |
22.445 |
2.01 |
0.46 |
2.8555 |
19 |
9.28 |
1 |
||||||
800 |
22.475 |
2.0166 |
0.311 |
2.8518 |
28 |
11.01 |
Source: PHILIPS X’ Pert PRO X-ray diffractometer, Material Science Division, Atomic Energy Center, Dhaka, Bangladesh.
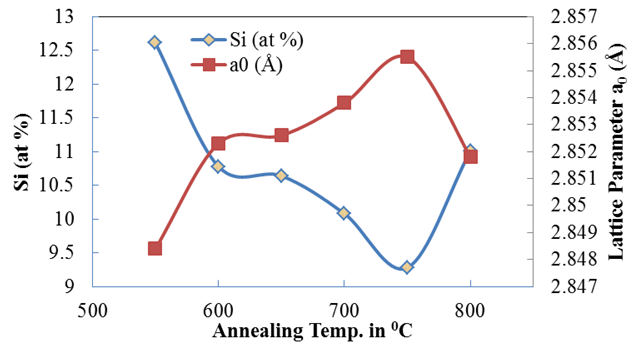
Figure-2. Change of Si (at. %) content and Lattice Parameter with different annealing temperature for the sample with composition Fe66.5Cr7Nb3Cu1Si13.5B9
Source: PHILIPS X’ Pert PRO X-ray diffractometer, Material Science Division, Atomic Energy Center, Dhaka, Bangladesh.
(110) reflections, the value of instrumental broadening was found to be 0.07oC. This value instrumental broadening was obtained FWHM value of each peak. Asymmetrical broadening of the peak due to stacking fault of bcc crystal was corrected negligible in the present case. All determined grain size was values for every step of heat treatment are listed in Table-1. In Figure- 2 it is clear that at low annealing temperature 550oC, the FWHM of the peak is large and with the increases of annealing temperature, the values of FWHM are getting smaller. The peaks are, therefore becoming sharper with the shifting the peak position towards higher ![]() value. The peak shifts indicate the change of the values of Si-content of nanograins and therefore, the change of the values of lattice parameter of nanograins.
value. The peak shifts indicate the change of the values of Si-content of nanograins and therefore, the change of the values of lattice parameter of nanograins.
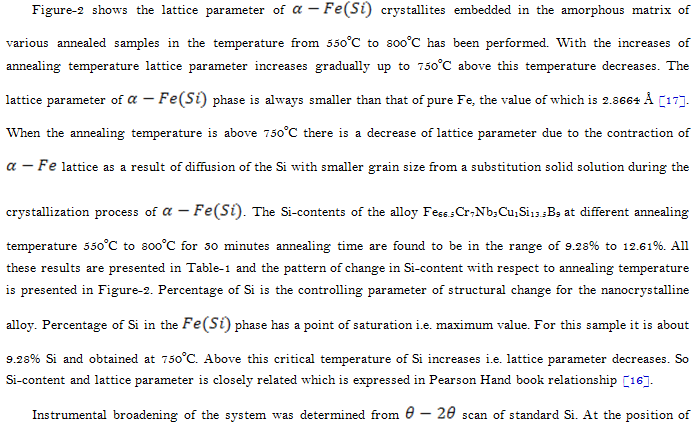
Figure-3. Change of Grain Size with different annealing temperature for the sample with composition Fe66.5Cr7Nb3Cu1Si13.5B9
Source: PHILIPS X’ Pert PRO X-ray diffractometer, Material Science Division, Atomic Energy Center, Dhaka, Bangladesh
Figure-3 and Table-1 that grain size increases with annealing temperature from a value of Dg = 11 nm for Ta = 550oC to Dg = 28 nm for the sampled annealed at Ta = 800oC while Si-content decreases with annealing temperature. The increases of annealing temperature initiates partitioning of Si in the bcc Fe phase and thus grain growth due to formation of nanocrystalline bcc Fe (Si) grains. In the range of annealing temperature 550oC to 750oC, the grain size remains in the range of 11 to 19 nm corresponding to soft magnetic bcc Fe(Si) phases. Above 750oC, grain grow rapidly at attain value of 28 nm at 800oC indicating formation of Fe2B phase. Formation of boride phase is detrimental to soft magnetic properties. Thus fact reveals that heat treatment temperature should be limited with 650oC to 750oC to obtain soft magnetic behavior, which will be clear that constant grain size. The formation of the nanometric microstructure corresponding to the grain growth with increase of annealing temperature is ascribed to combined effects of Cu and Nb and their low solubility in Fe. Cu which is insoluble in ![]() segregates prior to at the very beginning of nanocrystallization forming Cu-rich clusters and the nucleation of Fe(Si) grains is thought to be multiplied by clustering of Cu which stands as the reason for the grain growth at the initial stage of crystallization. It was observed that grain size 11nm for the sample annealed at 550oC for 30 minutes to a limiting value of 13-19 nm between annealing temperature 600oC to 750oC.
segregates prior to at the very beginning of nanocrystallization forming Cu-rich clusters and the nucleation of Fe(Si) grains is thought to be multiplied by clustering of Cu which stands as the reason for the grain growth at the initial stage of crystallization. It was observed that grain size 11nm for the sample annealed at 550oC for 30 minutes to a limiting value of 13-19 nm between annealing temperature 600oC to 750oC.
3.2. XRD Analysis of the Nanocrystalline Ribbon with Composition Fe64.5Cr9Nb3Cu1Si13.5B9
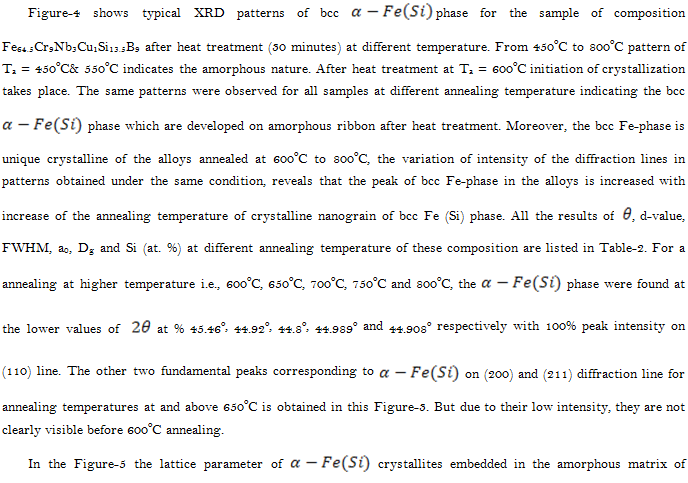
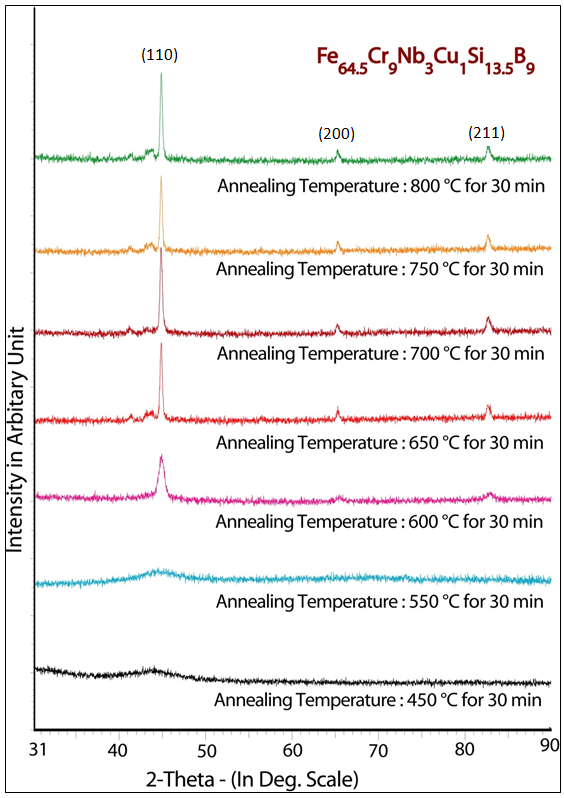
Furure-4. XRD spectra of Fe64.5Cr9Nb3Cu1Si13.5B9 alloys of annealed at different temperature at constant annealing time 30 min
Source: PHILIPS X’ Pert PRO X-ray diffractometer, Material Science Division, Atomic Energy Center, Dhaka, Bangladesh.
Table-2. Experimental XRD data of nanocrystalline Fe64.5Cr9Nb3Cu1Si13.5B9 amorphous ribbon at different annealing temperatures
Annealing Temp. in oC |
θ (deg.) |
d (Å) |
FWHM (deg.) |
ao (Å) |
Dg (nm) |
Si (at %) |
450 |
-- |
-- |
-- |
-- |
-- |
-- |
550 |
-- |
-- |
-- |
-- |
-- |
-- |
600 |
22.473 |
2.0167 |
0.653 |
2.8521 |
13 |
10.87 |
650 |
22.46 |
2.0178 |
0.307 |
2.8 |
28 |
10.17 |
36 |
||||||
700 |
22.44 |
2.0195 |
0.315 |
2.8561 |
27 |
9 |
750 |
22.449 |
2.0188 |
0.288 |
2.855 |
30 |
9.52 |
800 |
22.454 |
2.0183 |
0.287 |
2.8544 |
30 |
9.81 |
Source: PHILIPS X’ Pert PRO X-ray diffractometer, Material Science Division, Atomic Energy Center, Dhaka, Bangladesh.
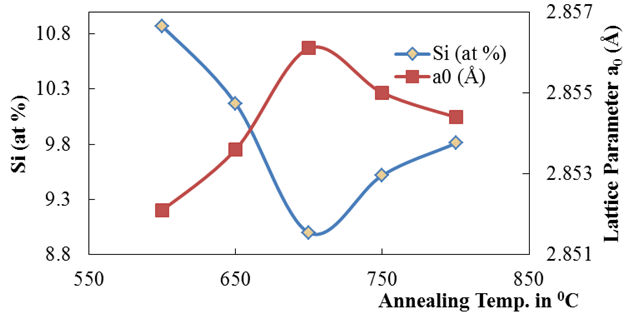
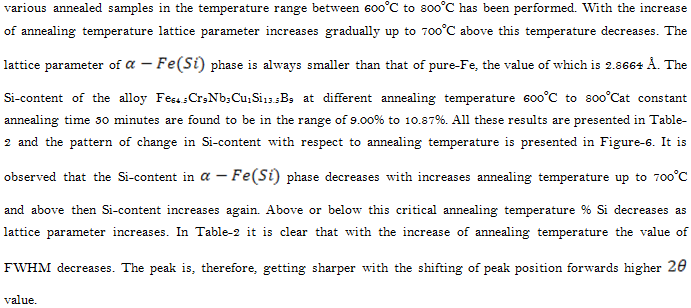
Figure-5. Change of Si (at %) content and Lattice Parameter with different annealing temperature for the sample with composition Fe64.5Cr9Nb3Cu1Si13.5B9
Source: PHILIPS X’ Pert PRO X-ray diffractometer, Material Science Division, Atomic Energy Center, Dhaka, Bangladesh.
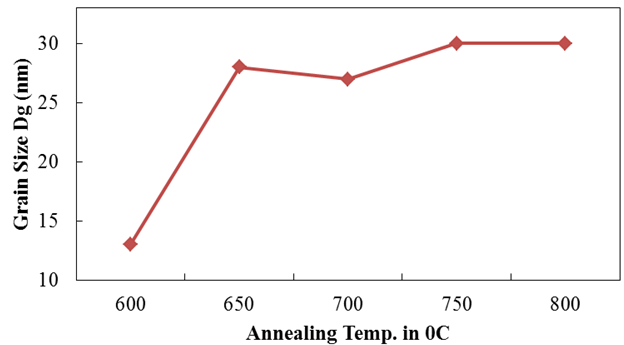
Figure-6. Change of Grain Size with different annealing temperature For the sample with composition Fe64.5Cr9Nb3Cu1Si13.5B9
Source: PHILIPS X’ Pert PRO X-ray diffractometer, Material Science Division, Atomic Energy Center, Dhaka, Bangladesh.
In Figure-6 the mean grain size of the nanograins determined from the X-ray fundamental line (110) using the Scherrers formula are presented. The increasing of annealing temperature initiates partitioning of Si in the bcc Fe phase and thus grain growth due to formation of nanocrystalline bcc Fe(Si) grains. In the range of annealing temperature 600oC to 800oC, the grain size remains in the range 13 to 30 nm. These facts reveal that heat treatment temperature should be limited with 650oC to 800oC to obtained soft magnetic behavior which will be clear that nearly constant grain size.
3.3. XRD Analysis of the Nanocrystalline Ribbon with Composition Fe63.5Cr10Nb3Cu1Si13.5B9
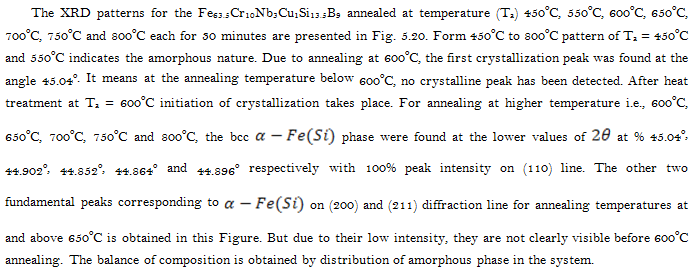
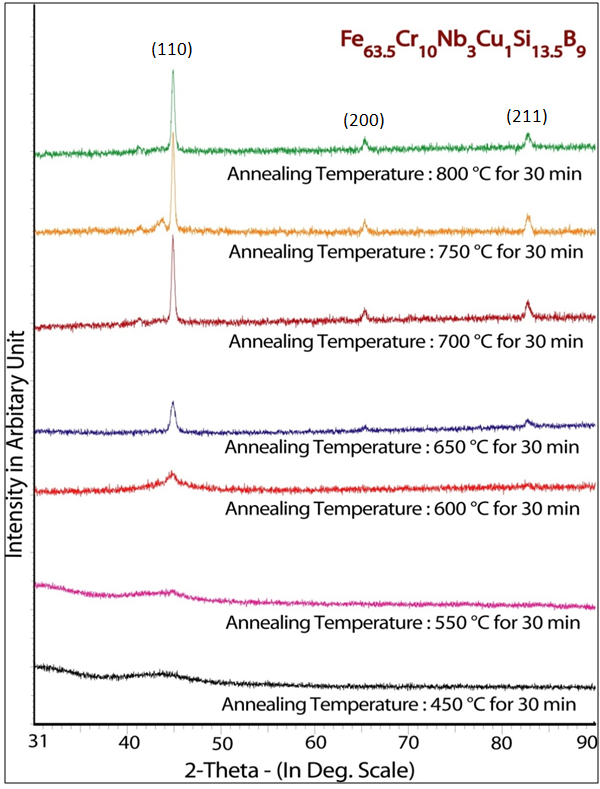
Figure-7. XRD spectra of Fe63.5Cr10Nb3Cu1Si13.5B9 alloys of annealed at different temperatures at constant annealing time 30 min
Source: PHILIPS X’ Pert PRO X-ray diffractometer, Material Science Division, Atomic Energy Center, Dhaka, Bangladesh.
The XRD patterns illustrated in Figure-7 reveals that the difference in the Bragg’s peak as well as the intensity of the fundamental reflections becomes gradually stronger as the temperature of the heat treatment increases. This increase in the sharpness of the intensity peaks with the annealing temperature indicates that crystalline volume fraction has been increased and also grains become coarser with increased crystallinity. The systematic but negligible shift of peak forwards the larger angles with decreasing temperature indicates that lattice parameter of the phase gradually increases due to the decreasing of Si-content of the ![]() phase. The lattice parameter, the Si-contents in bcc nanograins and the grain size of bcc grain can easily be calculated from the fundamental peak of (110) reflection. All the results are shown in Table -3.
phase. The lattice parameter, the Si-contents in bcc nanograins and the grain size of bcc grain can easily be calculated from the fundamental peak of (110) reflection. All the results are shown in Table -3.
Table-3. Experimental XRD data of nanocrystalline Fe63.5Cr10Nb3Cu1Si13.5B9 amorphous ribbon at different annealing temperatures
Annealing Temp. in oC |
θ (deg.) |
d (Å) |
FWHM (deg.) |
a0 (Å) |
Dg (nm) |
Si (at. %) |
450 |
-- |
-- |
-- |
-- |
-- |
-- |
550 |
-- |
-- |
-- |
-- |
-- |
-- |
600 |
22.52 |
2.0127 |
0.737 |
2.8464 |
12 |
13.53 |
650 |
22.451 |
2.0186 |
0.525 |
2.8547 |
16 |
9.66 |
700 |
22.426 |
2.0207 |
0.344 |
2.8578 |
25 |
8.21 |
750 |
22.432 |
2.0202 |
0.34 |
2.857 |
29 |
8.58 |
800 |
22.448 |
2.0189 |
0.332 |
2.8551 |
26 |
9.47 |
Source: PHILIPS X’ Pert PRO X-ray diffractometer, Material Science Division, Atomic Energy Center, Dhaka, Bangladesh.
Figure-8. Change of Si (at. %) content and Lattice Parameter with different annealing temperature for the sample with composition Fe63.5Cr10Nb3Cu1Si13.5B9
Source: PHILIPS X’ Pert PRO X-ray diffractometer, Material Science Division, Atomic Energy Center, Dhaka, Bangladesh.
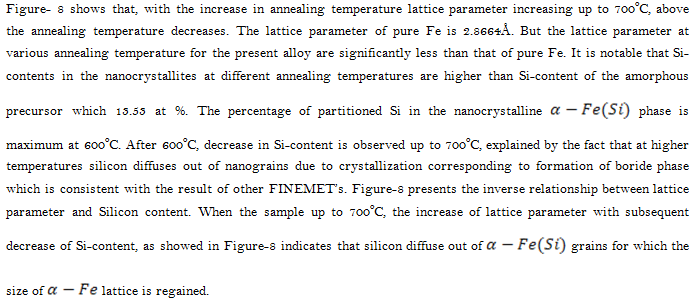
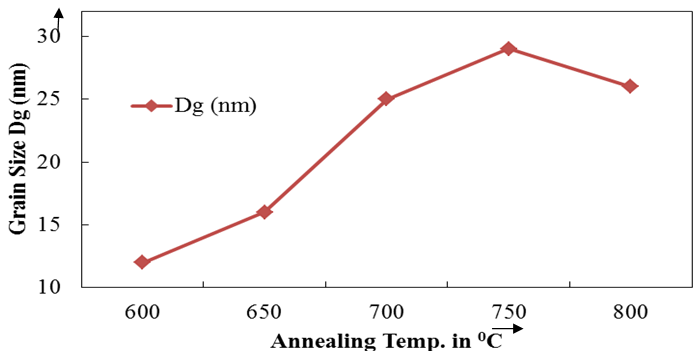
Figure-9. Change of Grain Size with different annealing temperature for the sample with composition Fe63.5Cr10Nb3Cu1Si13.5B9
Source: PHILIPS X’ Pert PRO X-ray diffractometer, Material Science Division, Atomic Energy Center, Dhaka, Bangladesh.
From Figure-9 and Table-3 that grain size decreases with annealing temperature up to 750oC and above this annealed temperature grain size increase. In the range of annealing temperature 600oC to 800oC, the grain size remains in the range of 12 to 29 nm. Grain growth rapidly and attain value of 25 nm at 700oC indicating formation of boride phase. Formation of boride phase is detrimental to soft magnetic properties. These facts reveal that heat treatment temperature should be limited within 600oC to 650oC to obtain optimum soft magnetic behavior, which will be clear that nearly same grain size.
3.4. XRD Analysis of the Nanocrystalline Ribbon with composition Fe61Cr12.5Nb3Cu1Si13.5B9
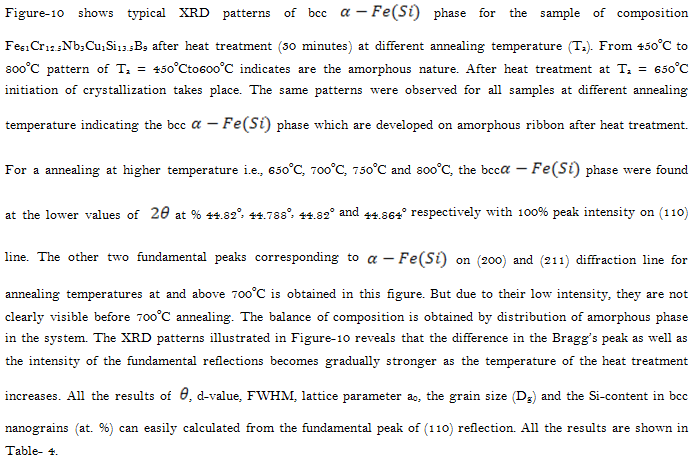
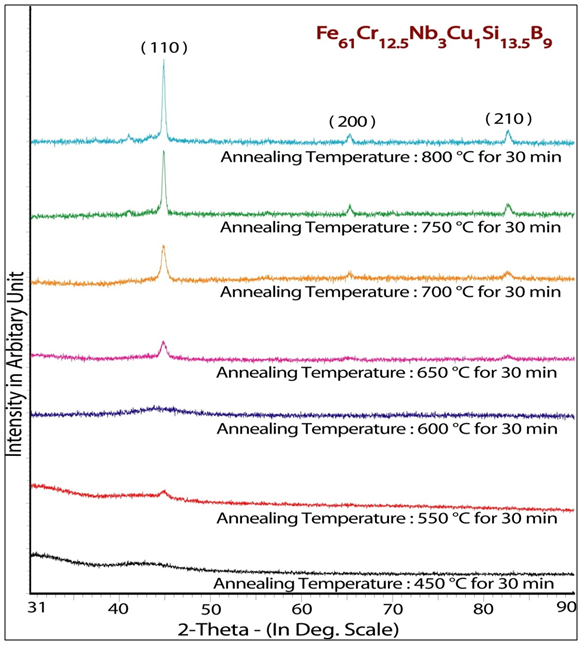
Figure-10. XRD spectra of Fe61Cr12.5Nb3Cu1Si13.5B9 alloys of annealed at different temperature at constant annealing time 30 min
Source: PHILIPS X’ Pert PRO X-ray diffractometer, Material Science Division, Atomic Energy Center, Dhaka, Bangladesh.
Table-4. Experimental XRD data of nanocrystalline Fe61Cr12.5Nb3Cu1Si13.5B9 amorphous ribbon at different annealing temperatures
Annealing Temp. in oC |
θ (deg.) |
d (Å) |
FWHM (deg.) |
a0 (Å) |
Dg (nm) |
Si (at. %) |
550 |
-- |
-- |
-- |
-- |
-- |
-- |
600 |
-- |
-- |
-- |
-- |
-- |
-- |
650 |
22.41 |
2.0201 |
0.556 |
2.8597 |
16 |
7.32 |
700 |
22.394 |
2.0235 |
0.524 |
0.8616 |
16 |
6.43 |
750 |
22.41 |
2.0221 |
0.349 |
2.8597 |
25 |
7.32 |
800 |
22.432 |
2.0202 |
0.296 |
2.857 |
29 |
8.28 |
Source: PHILIPS X’ Pert PRO X-ray diffractometer, Material Science Division, Atomic Energy Center, Dhaka, Bangladesh.
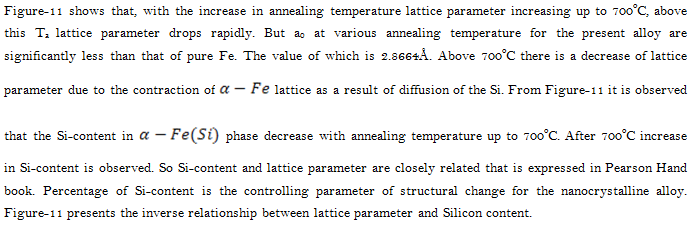
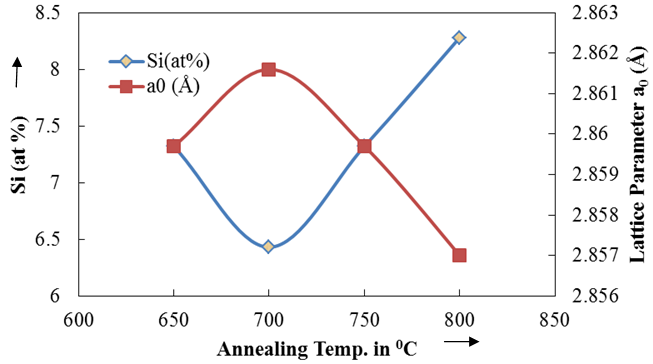
Figure-12. Change of Si (at. %) content and Lattice Parameter with different annealing temperature for the sample with composition Fe61Cr12.5Nb3Cu1Si13.5B9
Source: PHILIPS X’ Pert PRO X-ray diffractometer, Material Science Division, Atomic Energy Center, Dhaka, Bangladesh.
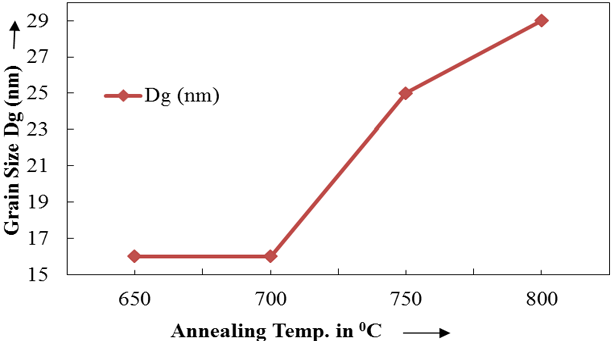
Figuree-13. Change of Grain Size with different annealing temperature for the sample with composition Fe61Cr12.5Nb3Cu1Si13.5B9
Source: PHILIPS X’ Pert PRO X-ray diffractometer, Material Science Division, Atomic Energy Center, Dhaka, Bangladesh.
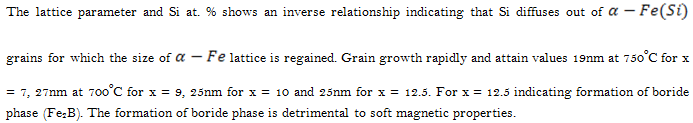
From Figure-13 and Table-4 that grain size (dg) constant up to 700oC and above this annealed temperature grain size increases. In the range of annealing temperature 650oC to 800oC, the grain size remains in the range of 16 to 29 nm. Grain growth rapidly and attain value of 25 nm at 750oC indicating formation of Boride phase. These facts reveal that heat treatment temperature should be limited within 650oC to 700oC to obtain optimum soft magnetic behavior, which will be clear that constant grain size.
4. CONCLUSION
Nanocrystalline amorphous ribbon of FINEMET family with a nominal composition Fe73.5-xCrxNb3Cu1Si13.5B9 [x = 7, 9, 10 & 12.5] has been studied to find out the correlation between microstructural features and magnetic properties dependent on various stages of nanocrystalline during the isothermal annealing around the crystallization temperature of the amorphous stage of the as-cast ribbons has been confirmed by XRD. The evaluation of primary phase on annealed samples has been confirmed as bcc-Fe (Si) and their sizes have been determined from the line broadening of fundamental peaks (110) from XRD pattern as affected by annealing around the crystallization temperature. The temperature corresponding to the onset of crystallization obtained from the XRD pattern is slightly lower than that of DTA data. The reason might be the two different methods of measurements. XRD measurement has been carried out on isothermal annealed samples while that of DTA on an isothermal. The grain size determined for the sample x = 7 from 11 to 28nm for the annealing temperature from 550oC to 800oC, x = 9 from 13 to 30nm for the annealing temperature from 600oC to 800oC, x = 10 from 12 to 29nm for the annealing temperature from 600oC to 800oC and x = 12.5 from 16 to 29nm for the annealing temperature from 650oC to 800oC. The higher Cr-content alloys (x = 12.5) do not show any sign of crystallization in their XRD pattern even at an annealing temperature of 600oC for 30 min. This is quite reasonable since their crystallization onset temperature is 650oC and higher.
| Funding: The author (M. A. Hossain) is thankful to Khulna University of Engineering & Technology (KUET), Khulna, Bangladesh for the financial support. |
| Competing Interests: The authors declare that they have no competing interests. |
| Contributors/Acknowledgement: The authors are also grateful to the Materials Science Division of Atomic Energy Centre, Dhaka (AECD), Bangladesh for allowing their facilities to prepare the samples and to utilize the laboratory facilities for various measurements. Financial support from International Program in Physical Science (IPPS), Uppsala University, Sweden for this work is highly acknowledged. |
REFERENCES
[1] H. Gleiter, "Nanocrystalline materials," Progress in Materials Science, vol. 33, pp. 223-315, 1989.
[2] K. Judit, "Nanostructures studied by atomic force microscopy," Ph.D. Thesis, Uppsala University, Sweden, 2003.
[3] F. Wana, T. Liua, F. Kong, A. Wang, M. Tianc, J. Song, J. Zhang, C. Chang, and X. Wang, "Surface crystallization and magnetic properties of FeCuSiBNbMo melt-spun nanocrystalline alloys," Materials Research Bulletin, vol. 96, p. 275-280, 2017. View at Google Scholar | View at Publisher
[4] V. V. Tkachev, A. K. Tsesarskaya, N. V. Ilin, G. S. Kraynova, A. N. Fedorets, V. S. Plotnikov, and D. A. Polyanski, "The microstructure and magnetic properties of the Fe-Cu-Nb-Si-B finemets with different copper content," in AIP Conference Proceedings 2017, p. 040051.
[5] X. Jia, Y. Li, L. Wu, and Z. Wei, "Structure and soft magnetic properties of Fe-Si-B-P-Cu nanocrystalline alloys with minor Mn addition," AIP Advances, vol. 8, p. 056110, 2018. View at Google Scholar | View at Publisher
[6] O. Ohnuma, D. H. Pins, T. Abe, H. Onodera, K. Hono, and Y. Yoshizawa, "Optimazitation of the microstructure and properties of Co-substituted Fe-Si-B-Nb-Cu nanocrystalline soft magnetic alloys," Journal of Applied Physics, vol. 93, pp. 1986 – 9194, 2003. View at Google Scholar | View at Publisher
[7] A. Fernandez, M. J. Perez, M. Tejedor, and V. Madurga, "Thermo magnetic analysis of amorphous (CoxFe1-x)73.5Nb3 Cu1 Si13.5 B9 metallic glasses," Journal of Magnetism and Magnetic Materials, vol. 221, pp. 338-344, 2000.View at Google Scholar | View at Publisher
[8] V. Franco, C. F. Conde, and A. Conde, "Magnetic properties and crystallization of a Fe63.5 Cr10 Nb3Cu1 Si13.5 B9 alloy," Journal of Magnetism and Magnetic Materials, vol. 203, pp. 60-62, 1999.View at Google Scholar
[9] P. Duwez, "Trans Tech," American Meteorological Society, vol. 60, pp. 844-853, 1967.
[10] P. Duwez, "Structure and properties of glassy metals," Annual Review of Materials Research, vol. 6, pp. 83-117, 1976. View at Google Scholar | View at Publisher
[11] P. Duwez, "Structure and properties of glassy metals," Annual Review of Materials Research, vol. 6, p. 83-117, 1976. View at Google Scholar | View at Publisher
[12] E. F. Kneller and F. E. Luborsky, "Particle size dependence of coercivity and remanence of single-domain particles," Journal of Applied Physics, vol. 34, pp. 656-658, 1963. View at Google Scholar | View at Publisher
[13] Y. Yoshizawa, S. Oguma, and K. Yamachi, "New Fe-based soft magnetic amorphous alloys composed of ultrafine grain structure," Journal of Applied Physics, vol. 64, pp. 6044-6046, 1988. View at Google Scholar | View at Publisher
[14] B. D. Cullity, Elements of X-ray diffraction. London, England: Adison-Wisley Publishing Company Inc, 1959.
[15] Bozorth, Ferromagnetism. Princeton, NJ: D. Van Norstrand Company, Inc, 1964.
[16] W. B. Pearson, A Hand book of Lattice spacing and Structures of metals and alloys. London, UK: Oxford Pergamon, 1958.
[17] M. A. Hakim and H. S. Manjura, "Effect of structural parameters on Soft Magnetic properties of two phase nanocrystalline alloy of Fe73.5Cu1Ta3Si13.5B9," Journal of Magnetism and Magnetic Materials, vol. 284, pp. 395-402, 2004.View at Google Scholar | View at Publisher
Views and opinions expressed in this article are the views and opinions of the author(s), Journal of Asian Scientific Research shall not be responsible or answerable for any loss, damage or liability etc. caused in relation to/arising out of the use of the content. |