


INTERCONNECTEDNESS ANALYSIS OF FOOD AND BEVERAGE INDUSTRY IN EAST JAVA PROVINCE WITH MORAN INDEX

1Faculty Economics and Business Airlangga University, Surabaya, East Java, Indonesia
ABSTRACT
Two important things which is interesting to study about the background of the food and beverage industry in East Java are : (1) the contribution of the food and beverage industry in East Java and (2) East Java Industry in the constellation of national industrial policy. Based on the empirical phenomena as described above, the objectives of this study is identify patterns of interconnectedness on the food and beverage industry in East Java Province. The used analytical tools in this study is Moran Index. The result of Moran's Index analysis with the input of labor force in the food and beverage industry sector in 38 regencies / cities in East Java Province has positive value, indicating that there is inter-regional relation during observation period 2010 (0,256) and 2012 (0,15). Referring to the results of Moran Scatterplot, in 2010 and 2012 it was found that the areas included in Quadrant I - HH (Kediri, Lumajang, Probolinggo, Mojokerto, Lamongan, Bangkalan, Madiun, and Batu) indicate that those area has a high labor force on the food and beverage industry sector.
Keywords:Industry Food Beverages Moran index.
ARTICLE HISTORY: Received:27 September 2017, Revised: 8 November 2017, Accepted:16 November 2017, Published:30 November 2017.
Contribution/ Originality:: This study is one of very few studies which have investigated the magnitude of interconnectedness index between food and beverage industry in each regency / city in East Java Province on labor aspect.
1. PREFACE
The essence of economic development is actually a process in an effort to empower the community and to increase its access to various aspects of development both political, economic, socio-cultural, defense and security. East Java Province is one of the provinces in Indonesia that has an important role in encouraging the acceleration of economic development in Indonesia. East Java Province in 2010-2015, has an average contribution of GRDP to the total national GDP of 14.4%. The number is the second highest contribution after DKI Jakarta Province.
The contribution of East Java Province is inseparable from the various policies and ease of regulations that have been given by the East Java provincial government, whether related to investment activities, infrastructure development, and trade for all business actors in East Java. East Java Province experiencing economic transformation from agricultural sector to industrial sector, so that East Java Province undergo industrialization.
When demand for a product from a particular sector increases, this sector needs to buy more goods from other sectors as input to generate additional output. This purchase will stimulate additional output which in turn will require further purchases from other sectors. Thus, we can trace these direct and indirect effects across all sectors of the economy using output, income, labor multiplier effects. In previous studies space-time models have been employed where spatial effects were captured in a restrictive way by first order autoregressive lags, see Elhorst (2001) and Beck and Gleditsch (2003). In addition, the important things that we have to know about interconnectedness analysis are : SAMs (and extended input-output models) and their connection to input-output data, structural decomposition analysis (SDA), multiplier decompositions, important coefficients, and international input-output models(Miller and Blair, 2009).
The table below shows the contribution of 17 sectors in East Java Province during 2014-2015. During this period the contribution of processing industry was highest compared to other sectors. This condition shows two things: First, it is proof that economic structure of East Java Province has experienced economic transformation into processing industry sector so that Provincial government is expected to give more attention to this sector. Second, the contribution of the high processing industry sector shows that the economical potention of the processing industry in East Java Province is relatively large, resulting a higher level of employment and productivity compared to other economic sectors.
Sectoral Contribution Table of East Java Province In 2014-2015 (in percent)
| Sector | 2014* | 2015** |
| Agriculture, Forestry and Fisheries | 13.61 | 13.75 |
| Mining and Quarrying | 5.17 | 3.79 |
| Processing industry | 28.95 | 29.27 |
| Procurement of Electricity and Gas | 0.36 | 0.34 |
| Water supply, waste management, and recycling | 0.09 | 0.09 |
| Construction | 9.47 | 9.5 |
| Wholesale and retail trade; car and bicycle repair | 17.29 | 17.64 |
| Transportation and Warehousing | 3.25 | 3.36 |
| Provision of Accommodation, food and Drinking | 5.19 | 5.41 |
| Information and Communication | 4.54 | 4.56 |
| Financial Services and Insurance | 2.68 | 2.75 |
| Real Estate | 1.57 | 1.63 |
| Company Services | 0.79 | 0.8 |
| Administration of Government, Defense, and Social Security | 2.32 | 2.31 |
| Educational Services | 2.73 | 2.72 |
| Health Services and Social Activities | 0.63 | 0.63 |
| Other services | 1.38 | 1.43 |
Source: East Java Central Bureau of Statistics*) Temporary Figures **)Very Temporary Figures
The largest contributors to processing industry in East Java are the food and beverage industry sub-sector. The contribution of the food and beverage industry subsector from 2014 to 2015 amounted to 7.91 percent and 8.41 percent. This shows that the food and beverage industry sub sector has a big role to the increasing of processing industry sector of East Java Province. The capabilities shown in the GRDP value in the food and beverage industry sub-sector provide indication that the potential development of the food and beverage industry subsector is very suitable to be done in East Java (Central Bureau of Statistics, 2011). Regarding the enormous contribution of the food and beverage industry to East Java GDP, it is necessary to know and analyze the inter-regional linkages in this sector.
2. LITERATURE REVIEW
According to Kosfeld (2006) the calculation of spatial autocorrelation by Moran Index method can be done in two ways:
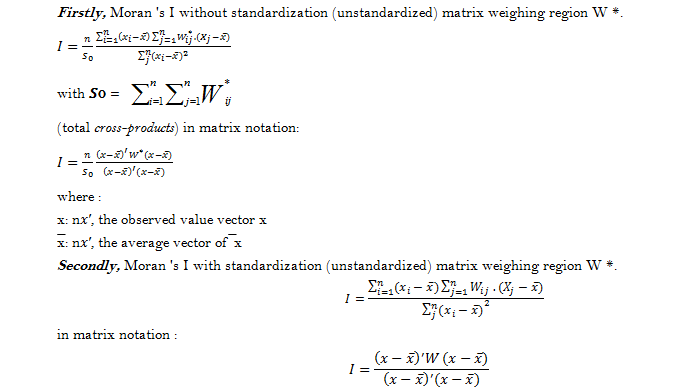
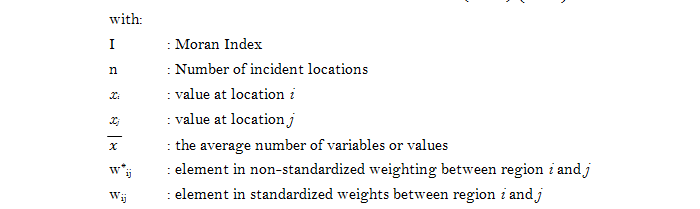
The range of values of the Moran Index in the case of standardized spatial weighted matrix is -1 < I < 1. The value -1 < I <0 indicates the presence of a negative spatial autocorrelation, whereas the value 0 <I < 1 indicates a positive spatial autocorrelation, the value of the Moran Index is zero indicates there is no grouping there. The Moran Index value does not guarantee the accuracy of the measurement if the weighting matrix used is non-standardized weights. To identify the existence of spatial autocorrelation, a Moran Index of significance was tested.
The hypothesis test for Moran Index is as follows:
H0 : There is no spatial autocorrelation
H1 : There is spatial autocorrelation
And the statistic test is :
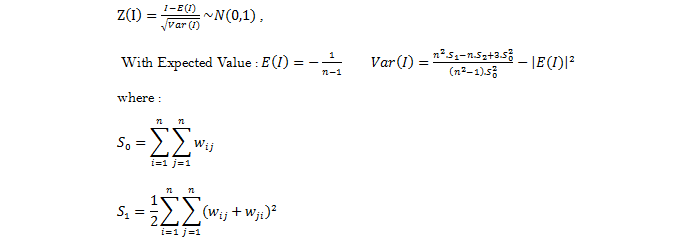

Test criteria :
Reject H0 at the level of significance α if Z(I) > Z1-α with Z1-α is (1-α) a quintile of the standard normal distribution. Next, we will discuss about Moran Scatterplot. Moran Scatterplot is a used tool to see the relationship between standardized observation values and standardized neighboring mean values. When combined with the regression line then this can be used to determine the degree of compatibility and identify the outliers. Moran Scatterplot can be used to identify a spatial balance or influence . The types of spatial relationships can be seen from the following figure:
| Quadrant I or HH (High-High) | Quadrant IV or HL (High-Low) |
| Quadrant II or LH (Low-High) | Quadrant III or LL (Low-Low) |
Moran Scatterplot Figure
Source : Zhukof (2010)According to Zhukof (2010) the quadrants in Moran Scatterplot are as follows:
- In quadrant I, HH (High-High) indicates that areas with high observation values are surrounded by areas with high observation values;
- In Quadrant II, LH (Low-High) indicates that areas with low observation values are surrounded by areas with high observation values;
- In Quadrant III, LL (Low-low) indicates that areas with low observation values are surrounded by areas with low observation values;
- In the IV quadrant, HL (High-Low) indicates that areas with high observation values are surrounded by areas with low observation values.
3. RESULTS ANALYSIS
Auto spatial correlation as an analytical tool is used to see whether or not the similarity of the characteristics of an area with the surrounding area or the estimation of the correlation between observed values related to the spatial location of the same variable. Positive spatial autocorrelation indicates a similarity of values from adjacent sites and tends to group (spatial cluster patterns). Whereas a negative spatial autocorrelation indicates that neighboring sites have no resemblance between an area and the surrounding area. Characteristics of spatial autocorrelation are as follows :
- If there is a systematic pattern on the spatial distribution of the observed variables, then there is spatial autocorrelation.
- If proximity or neighborhood between regions is closer, then there can be positive spatial autocorrelation.
- Negative spatial autocorrelation illustrates an unsystematic neighboring pattern.
- A random pattern of spatial data indicates no spatial autocorrelation.
The Moran Index is one of the spatial analysis techniques that can be used to determine the existence of spatial autocorrelation between observation sites. The calculation of Moran Index with the input of labor data on food and beverage industry in 38 regencies / cities in East Java Province is done with GeoDa software can be seen in Graph below:
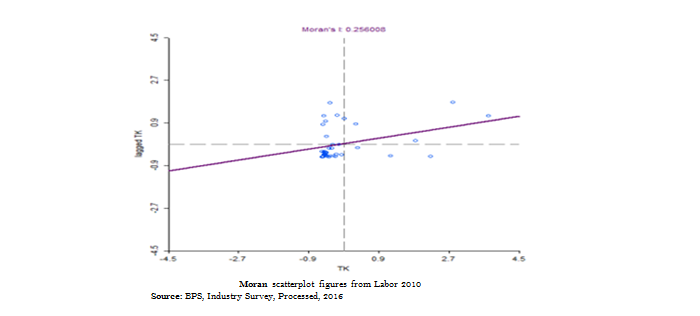
From the analysis of Moran Index done with GeoDa software obtained Moran Index value of 0.256. While Moran scatterplot is also presented in the picture above, the spreading points are :
- Quadrant I, HH (High-High) is Kab. Kediri, Kab. Lumajang, Kab. Bondowoso, Kab. Probolinggo, Kab. Mojokerto, Kab. Lamongan, Kab. Bangkalan, Madiun City and Batu City.
- Quadrant II, LH (Low-High) is Kab. Pacitan, Kab. Ponorogo, Kab. Trenggalek, Kab. Tulungagung, Kab. Blitar, Kab. Situbondo, Kab. Jombang, Kab. Nganjuk, Kab. Madiun, Kab. Magetan, Kab. Ngawi, Kab. Bojonegoro, Kab. Tuban, Kab. Sampang, Kab. Pamekasan, Kab. Sumenep, Kota Kediri, Blitar City, Malang City, Probolinggo City, Pasuruan City and Mojokerto City.
- Quadrant III, LL (Low-Low) is Malang Regency, Gresik Regency, and Surabaya City.
- Quadrant IV, HL (High-Low) is Banyuwangi, Jember, Pasuruan, and Sidoarjo.
As for the calculation of Moran index with input data of labor force in food and beverage sector in 2012, got as follows:
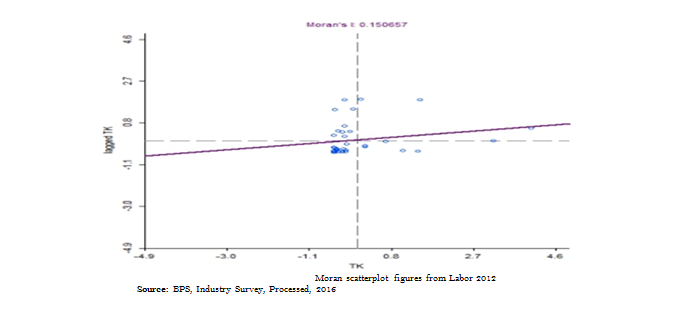
From the analysis of Moran Index done with Geo Da software obtained Moran Index value of 0.151. While Moran scatterplot is also presented in the picture above, the spreading points are:
- Quadrant I, HH (High-High), is Kediri Regency, Lumajang Regency, Situbondo Regency, Probolinggo Regency, Mojokerto Regency, Lamongan Regency, Bangkalan Regency, Madiun City and Batu City.
- Quadrant II, LH (Low-High) is Kabupaten Pacitan, Ponorogo Regency, Trenggalek Regency, Tulungagung Regency, Jombang Regency, Nganjuk Regency, Madiun Regency, Magetan Regency, Ngawi Regency, Bojonegoro Regency, Tuban Regency, Sampang Regency, Pamekasan Regency , Sumenep, Kediri, Blitar, Malang, Probolinggo, Pasuruan and Mojokerto.
- Quadrant III, LL (Low-Low) is Blitar Regency, Malang Regency, Jember Regency, Gresik Regency, and Surabaya City.
- Quadrant IV, HL (High-Low) is Banyuwangi, Bondowoso, Pasuruan, and Sidoarjo.
4. CONCLUSION
From the various analyzes described above, it can be taken some conclusions as follows:
- The result of Moran's Index analysis with the input of labor force in the food and beverage industry sector in 38 regencies / cities in East Java Province has positive value, indicating that there is inter-regional relation during the observation period 2010 (0,256) and 2012 (0,151) indicates a positive spatial autocorrelation, but the correlation is weak in the sense that the food and beverage industry in East Java has similar characteristics in the labor perspective (ethos, work culture and productivity).
- Referring to the results of Moran scatterplot, in 2010 and 2012 the results obtained that the areas included in Quadrant I - HH (Kediri District, Lumajang, Probolinggo, Mojokerto, Lamongan, Bangkalan, Madiun City, Batu City) indicates that the area has the amount of high employment in the food beverage industry sector, the condition is due to surrounded by regional support areas that also have the amount of labor in the food and beverage sector is quite high as well. Therefore the development of food and beverage industry in the area become strategic choice to be developed in the future as the superior product of region which become prime mover of the economy.
| Funding: This study received no specific financial support. |
| Competing Interests: The author declares that there are no conflicts of interests regarding the publication of this paper. |
REFERENCES
Beck, N. and K. Gleditsch, 2003. Space is more than geography. San Diego: Department of Political Science, University of California.
Central Bureau of Statistics, 2011. Berita resmi statistik: PDB dan PDRB. Retrieved from http://www.bps.go.id [Accessed July 12th, 2013].
Elhorst, J.P., 2001. Dynamic models in space and time. Geographical Analysis, 33(2): 119-140.View at Google Scholar | View at Publisher
Kosfeld, R., 2006. Spatial econometric. Retrieved from http://www.scribd.com.
Miller, R.E. and P. Blair, 2009. Input–output analysis. Foundations and extensions. Cambridge: Cambridge University Press.
Zhukof, Y.M., 2010. Spatial autocorrelation. IQQS: Harvard University.