


HOW FINANCIALLY LITERATE IS TODAY’S YOUTH?

1 , 2 Department of Resource Management & Consumer Studies, Faculty of Human Ecology, Universiti Putra Malaysia, UPM Serdang, Selangor, Malaysia
ABSTRACT
The current study investigated the level of financial literacy of youth in Malaysia. Quantitative questionnaires were used to test the financial literacy by examining the financial knowledge, practices and attitudes towards money, money management and entrepreneurship of youth in Malaysia. A sample consisting of 220 secondary school students from five schools in Kuala Lumpur, Malaysia had participated in the study. Cross tabulation was used to understand the background of respondents better which included the gender (male and female) and the ethnic group (Malay, Chinese and Indian) of the youth. The findings indicated that male youths are better-informed on financial management and money matters compared to the females. From the survey, Indians have lower level of financial related knowledge compared to other ethnic groups. In addition, both genders had revealed that they have positive attitudes and good practices money matters. These findings contributed to the development of financial empowerment program of youth in Malaysia. The study provides awareness to the public regarding the importance of financial planning in the present and the future as well.
© 2017 AESS Publications. All Rights Reserved.
Keywords:Financial literacy, Financial attitudes, Financial practices, Youth.
ARTICLE HISTORY: Received: 28 July 2017, Revised: 30 August 2017, Accepted: 12 September 2017, Published: 28 September 2017
1. INTRODUCTION
In recent decades, teenagers and young people has become an important consumer and they are being targeted by retailers and marketers because of its size (the number of teenagers and youths) and its significant purchasing power. They are the most powerful consumer group because they have higher disposable income compared to other generation cohort (Parment, 2013). A few studies had demonstrated a strong association between youth and purchase behavior. In Malaysia, college students spent more than half of their money that they received, either in form of scholarship or educational loan, for shopping. Thus, only 13% of the college students distributed their money for debts repayment. In addition, around 45% of college students’ disposable income was fully spent before the end of the semester (Sabri and MacDonald, 2010).
Youth defined by Malaysians as individuals aged between 15 and 40 year old (Ministry of Human Resource, 2013). As reported by Department of Statistic Malaysia (2014) the total of Malaysia’s population is 30,073,353 million which the age structure from 0-14 years old is 28.8%, 15-24 years old is 16.9% and 25-54 years old is 41.2%. Hence, nearly 50% of consumers in Malaysia are youth. Consequently, youth has emerged as a major group in the micro-economic and macro-economic. Teenagers and young people have serious influence on their parents’ and friends’ financial decision. The findings showed that, Malaysian individuals, especially youth who have higher disposable income, to practice financial acts was a contingency for countries in the event of economic downturns and financial crisis. Furthermore, the study revealed that women are less likely to save money as they are not as well-informed as the men. Instead of saving, Malaysia youth prefer to go to the movie theaters, fast foods outlets and restaurants. They also prefer to spend their money on grooming themselves thus they spend a lot of time at the hair saloon (Nga et al., 2011).
Teenagers and young people are valuable possessions of the nation. Without them there can be no construction and development programs which will cause the country to be disrupted in the future (Kojo, 2010). Unfortunately, Malaysians youth tend to have a high percentage in experiencing financial problems. Male students tend to be overly in debt and have greater expenses than their income compared to female students (Jariah et al., 2004). The other study found, however, that many Malaysian female students’ level of financial literacy remains low even most of them are university graduates and participate actively in the labor market. They were less likely to answer the financial knowledge related statements correctly. Out of 25 mean score, female students averagely scored 12.21 compared to male students at 12.61. Hence, the study revealed that female students have a lower level of financial knowledge than male students (Falahati and Paim, 2011).
Ethnicity differences also constitute to the magnitude of financial problem faced by today’s youth. Chinese students are likely to face heavy indebtedness as they found to be less financially literate than any other of the ethnic groups (Sabri et al., 2010). Similarly, Malaysian Chinese college students had less positive financial practices compared to other groups in the category. The involvement of Malaysian Chinese college students in savings behavior was lower compared to other ethnic group due to low financial literacy (Sabri and MacDonald, 2010). This paper is to examine the financial knowledge, practices and attitudes towards money, money management and entrepreneurship of secondary school students of different genders and ethnicity to develop a financial empowerment program for the youth in Malaysia.
2. LITERATURE REVIEW
2.1. Financial Knowledge
Financial knowledge has drawn attention in the literature of economics for some time now. For instance, the knowledge spillover theory of entrepreneurship by Qian and Acs (2013) has identified new knowledge as a source of entrepreneurial opportunities and recommended that entrepreneurs to play an important role in commercializing new knowledge developed in large incumbent firm. Specifically, financial knowledge is defined as the ability to read, analyze, manage, and communicate the personal financial conditions that affect material well-being. Thus, the term financial knowledge and financial literacy is used interchangeably; however, literacy is the possession of basic knowledge or competence, and through this knowledge to build the capacity of financial stability (Mccormick, 2009). Hence, to put it simply, the financial knowledge is the information regarding money matters and financial literacy is the skills to perform the knowledge into actions.
Nevertheless, the results of various research studies have shown that most of the consumers lack necessary financial knowledge to make important financial decisions for their own best interest. According to Lusardi and Tufano (2015) study, people with low financial literacy are likely to have problems with debt. Thus, financially illiterate person is less likely to accumulate wealth and manage wealth effectively.
Furthermore, studies indicate that there are differences in the level of financial knowledge between genders. Based on Lusardi and Mitchell (2011) study, finds that women in the U.S. are significantly possess lower financial knowledge compared to men. Besides, women also perceive and rate their own level of financial knowledge more conservatively. Thus, self-assessment of financial literacy in the overall population tends to be more inflated.
2.2. Financial Attitudes towards Money
Attitude is an anterior to act (Ajzen, 1991). Besides, it is the first step to initiating an action as an attitude that reflects motivational factors which influence the behavior, which then will affect the effort of the individual’s plans to exert and to put the behavior into practice (Linan and Santos, 2007). Thus, attitude is also the driving force in entrepreneurial behavior. According to relevant studies conducted on entrepreneurial behavior, attitude reflects entrepreneurial behavior better than other sources, such as demographic characteristics or external influences (Wu and Wu, 2008).
Moreover, the results of various research studies have shown that youth’s attitude is correlated with money and money management. Money is used widely as one medium of exchange, thus influences the holistic picture of economic change in country’s currency. The demand of money and the attitude of money has influence on individuals’ perceptions, values, beliefs and behavior towards money. Money signifies power and has the ability to influence individual’s level of well-being and happiness (Furnham and Okamura, 1999). Money has symbolic values that linked to individual’s self-esteem and emotional involvement that influence life style, buying habits and consumption process and other psychological meaning in life. Money is viewed differently by each individual and their attitude towards money is different, whether money is viewed as gifts, collectibles, and heirlooms or as profane commodities (Belk and Wallendorf, 1990).
Financial attitude has drawn attention in the literature of economics for a long time. According to study by Templer and Yamauchi (1982) reported Money Attitude Scale (MAS) that consisted of five factors of money attitude which are power-prestige, retention-time, distrust, quality and anxiety. However, according to Tang (1994) the measure of people’s attitudes towards money, a 12-item Money Ethic Scale (MES), was developed based on a sample of 740 subjects and six major factors which can be categorized into three components: an affective component (Good and Evil), a cognitive component (Achievement, Respect, and Freedom/Power), and a behavioral component (Budget). Thus, the individual attitude toward money differs according to individual economic, psychology, occupational psychology, and individual lifestyle.
In Asia, research revealed that Asian people posses positive attitude towards money management. For instance, research regarding financial literacy was carried out in Singapore by Media Research Consultants Pte Ltd (2005). Financial literacy was measured by using three parameters which are basic money management, financial practices and investment knowledge. The findings showed that, in general, Singaporean have fairly healthy attitudes towards basic money management, financial practices and investment knowledge.
On the other hand, financial attitude and entrepreneurship have drawn attention since the past decades. Studies indicated that financial attitude and entrepreneurship are correlated. A favorable attitude towards entrepreneurship has stronger influence on male academics with entrepreneur’s intention than female academics. In this sense, the previous research suggests that males have greater initiative and optimism, which might contribute to a higher willingness to engage in entrepreneurship at a structural level and that these differences persist in the academic context (Sánchez Cañizares and Fuentes García, 2010).
According to Prince (1989) study, female and male attitude towards money different significantly, at least for young people aged 18-34 years old. Additionally, childhood socialization and upbringing influences their (children and youth) attitude towards money. Females were also found to be less frugal. They are freer to seek present gratification through spending, more interested in bargain-hunting, more security-oriented in money handling, more self-deprecatory with their financial behavior, and more fearful of negotiating a big-ticket purchase.
2.3. Financial Practices
In recent years, understanding financial practices among youth is becoming increasingly important. Acquisition of possessions and experience are the important components of sound financial practices such as credit card and mortgage loan. Nevertheless, many financial practices such as mutual funds and student loans which unfold over time and have long term implications in earning potential, wealth accumulation and upward mobility (Leung, 2011).
Financial practices include the implementation of financial planning that consisted of budgeting and cash flow, credit management, risk management, investment, estate planning, and retirement planning. Money management is a part of financial practices that requires fundamental knowledge, skills and experience related with personal finance in order to make sound financial decisions daily (Kapoor et al., 2004).
Moreover, research has been carried out in several countries shown that financial practices could have important implications for financial behavior. For instance, to carry out quick financial fix such as utilizing payday cash and using multiple credit cards recklessly that may lead individuals into indebtedness (Bernthal et al., 2005). Consequently, young people ability to understand and handle financial decisions had generated a keen interest in financial practices and effectiveness of financial education. The study revealed that respondents who participated in the survey scored significantly higher on financial literacy test taken in comparison to group of students in the same school, regardless of their family background (education and income). Results suggested that young children have better financial practices when they have access to financial education, accompanied by their participation in meaningful financial services (Sherraden et al., 2011).
According to study by Youth Save (2010) from the MasterCard Foundation, found that the intervention programs of promoting savings among children from lower income family had helped to improve the youth development and financial inclusion. Similarly with the study by Shim et al. (2010) it is reported that parents’ influence played a significant in the leading a good financial practice among children. Moreover, the study among 2,098 first-year college students suggested that, in order to help children and youth to achieve financial success, parents, schools and entrepreneurs should form partnerships to educate sound financial practices. Last but not least, based on Kwong et al. (2012) study, gender does affect and play the most important role in perception of financial constraint. Thus, the findings had shown that greater proportion of women are solely constrained by financial barriers compared to their male counterparts and thus are less likely to participate in financial practices for example to start a business. Hence, several strategies with holistic plans are required in enhancing better knowledge, positive money attitude and good money management among children and youths.
3. METHODOLOGY
3.1. Sample
The sample comprised a total of 220 secondary school students from five schools in Greater Klang Valley/ Kuala Lumpur. The selection was done by the school teachers based on the criteria from low to middle income with 112 of them were females and 108 of them were males. They were all Form 4 secondary school students. Data were obtained through a questionnaire. The questionnaire was administered and supervised by a trained enumerator in a classroom setting at the respective schools. Data were analyzed using Statistical Package for Social Sciences (SPSS) to identify the socio economic status, knowledge, attitudes and practices on money, money management and entrepreneurship as well as interest to participate in the youth financial empowerment program.
3.2. Measurement and Instrumentation
3.2.1. Variables
3.2.1.1. Socio-Demographic
The variables consist of socio-demographic background of the respondents such as youth and family financial background, gender and ethnicity. Three youth’ financial background related questions were asked including the amount of savings and number of bank account possessed by each youth. Whereas, two questions related to the youth’s family financial backgrounds were asked including who is the income provider and the father’s monthly income. Three ethnic groups consisted in this research were Malay, Chinese and Indian.
3.2.1.2. Financial Knowledge
The youth’ financial knowledge were measured by testing for correct answer on 15 questions concerning on savings, budget, value of money, inflation, credit cards, insurance property and business with true and false answer choice. The Cronbach’s Alpha reported was 0.92.
3.2.1.3. Financial Attitudes
Seventeenth financial attitudes related statements were asked including attitudes towards money method, business, risk, savings and spending, needs and future planning. Item 1-8 were measured using three point Likert-type questions ranging from 1 (Disagree) to 3 (Agree). The Cronbach’s Alpha reported was 0.87. Item 9-14 was tested using two point Likert-type questions with different answer choice while Item 15-17 was tested using three point Likert-type questions.
3.2.1.4. Financial Practices
Youth’s financial practices were examined using three point Likert-type questions, ranging from 1 (Never) to 3 (Always). Ten financial practices related statements were asked which including money management, financial discussion with family and purchasing. The Cronbach’s Alpha reported was 0.77.
3.3. Data Analysis
All the gathered information had been keyed in to be analyzed by using Statistical Package of the Social Science (SPSS). Descriptive analysis and inferential analysis was applied in order to allow researchers to access the data thoroughly on the respondents’ socio economic status, knowledge, attitudes and practices on money, money management and entrepreneurship as well as their interest in participating in the youth financial empowerment program. Meanwhile, cross-tabulation test was applied to measure the financial knowledge, practices and attitude towards money, money management and entrepreneurship by genders and ethnicity.
4. RESULTS AND DISCUSSIONS
4.1. Respondent and Family Characteristics
A total of 220 respondents participated in this study. More than half (51%) of the respondents were female. Most of the respondents were Malay (42%), followed by Indian (34%) and Chinese (24%). Cross-tabulation analysis was performed in order to further understand the background of respondents who participated in this survey. As presented in Table 1, there are above 75%, for both female and male respondents, owned at least one bank account. Interestingly, a significant association between bank account ownership and ethnicity was found. Specifically, about 88% of Chinese respondents have a bank account, followed by Malay (77.8%) and Indian (67.1%).
Table-1. Respondents’ Background by Gender and Ethnicity
| Variables | Gender | Ethnicity | |||
| Female | Male | Malay | Chinese | Indian | |
| Do you have a bank account? (n=214) | 73.8 | 79.4 | 77.8* | 88.2* | 67.1* |
| How many account(s) do you have? (n=139) | |||||
| 1 | 76.7 | 82.3 | 68.9 | 95.1 | 81.1 |
| 2 | 18.3 | 11.4 | 23.0 | 2.4 | 13.5 |
| 3 | 3.3 | 5.1 | 6.6 | 2.4 | 2.7 |
| 4 | 1.7 | 1.3 | 1.6 | - | 2.7 |
| How much savings do you have? | |||||
| <RM1001 | 26.8* | 40.7* | 29.3 | 47.2* | 29.3* |
| RM1001 – RM5K | 4.5* | 13.0* | 5.4 | 15.1* | 8.0* |
| >RM5K | 68.8* | 46.3* | 65.2 | 37.7* | 62.7* |
| Family income provider (n=217) | |||||
| Father | 82.7 | 78.5 | 82.6 | 78.8 | 79.5 |
| Mother | 13.6 | 15.9 | 13.0 | 17.3 | 15.1 |
| Elder brother/sister | - | 0.9 | 1.1 | - | - |
| Grandparents | 1.8 | 0.9 | 2.2 | 1.9 | - |
| Uncle/aunt | 1.8 | 1.9 | 1.1 | 1.9 | 2.7 |
| Other caretaker | - | 1.9 | - | - | 2.7 |
| Father Monthly income (n=180) | |||||
| <RM1K | 19.1* | 17.6* | 20.0 | 15.9 | 17.9 |
| RM1K – RM2K | 40.4* | 46.2* | 47.5 | 36.4 | 42.9 |
| RM2K – RM3K | 19.1* | 19.8* | 12.5 | 31.8 | 19.6 |
| RM3K – RM4K | 6.7* | 4.4* | 8.8 | - | 5.4 |
| RM4K – RM5K | 11.2* | 1.1* | 7.5 | 2.3 | 7.1 |
| >RM5K | 3.4* | 11.0* | 3.8 | 13.6 | 7.1 |
Note: * Significant at 0.05
Referring to Table 1, results revealed a significant association between the amount of saving with both gender and ethnicity. Female respondents tend to be a better saver compared to male respondents. It can be proved as about 69% of females reported to save more than RM 5,000 compared to only 46.3% of males in the same category.
4.2. Financial Knowledge on Money, Money Management and Entrepreneurship
Majority of the respondents had answered correctly for almost all the items. Table 2 indicates the cross-tabulation results of the items of knowledge scale by gender and ethnicity.
In discussing on gender difference, less than 50% of respondents answered correctly on the items “One can always make easy money in a short period of time when you have your own business.” for both male and female. Whereas, less than 50% of female respondents answered correctly for the item “If you start small business, you can never go bankrupt”. Some significant associations between female and male with certain items were also found in the analysis. More female (89.1%) scored correctly on item “A budget is an estimated spending of income and expenditure over a period of time”. More than 78% of male respondents answered correctly on knowledge related to the stability of the value of money, ATM machine produce money and credit card.
In general, each ethnic group has different knowledge and point of view on certain topics. More Malay respondents have knowledge on budget estimation (91.1%), insurance as protection plan (91.3%), risk of investment (71.4%), type of investment (84.6%) and multiple business strategic (77.2%). More than 86% of Chinese understand about the stability of the value of money, ATM machine produce money and 71.7% of Chinese realize about bankruptcy. Less than 70% of Indian respondents answered correctly on the items that related to the stability of the value of money (54.1%), ATM machine produce money (60.8%), interest charge on late payments for credit card (68.9%), risk of investment (52.7%), type of investment (63.5%), make easy money when you have your own business (43.2%), bankruptcy (54.1%) and multiple business strategic (60.8%).
Table-2. Respondents’ Financial Knowledge by Gender and Ethnicity
| No. | Statement | Gender | Ethnicity | |||
| Female | Male | Malay | Chinese | Indian | ||
| 1. | It is safest to keep your own savings at home. | 87.5 | 85.0 | 89.1 | 79.2 | 87.8 |
| 2. | A budget is an estimate of income and expenditure over a period of time. | 89.1* | 76.4* | 91.1* | 77.4* | 76.7* |
| 3. | The value of money is stable (no rise/ fall) all the time. | 62.5* | 78.5* | 73.9* | 86.8* | 54.1* |
| 4. | Money is made at the ATM machine. | 67.0* | 84.1* | 79.3* | 88.7* | 60.8* |
| 5. | High inflation means that the cost of living is increasing quickly. | 81.9 | 76.7 | 78.8 | 80.0 | 79.5 |
| 6. | The currency used by different countries have the same value | 90.0 | 93.5 | 91.2 | 92.5 | 91.8 |
| 7. | There will be an interest charge on late payments for credit cards. | 80.4 | 74.5 | 81.5 | 82.7 | 68.9 |
| 8. | If one’s credit card is lost, the owner cannot stop other people from using it. | 67.0* | 79.4* | 70.7 | 77.4 | 73.0 |
| 9. | Insurance helps protect you from risk and losses. | 84.8 | 81.3 | 91.3* | 73.6* | 79.7* |
| 10. | Insurance is only for people who are ill/sick. | 80.4 | 78.5 | 82.6 | 81.1 | 74.3 |
| 11. | An investment with a high return is likely to be high risk. | 64.0 | 62.3 | 71.4* | 63.5* | 52.7* |
| 12. | Property is a type of investment. | 72.1 | 79.4 | 84.6* | 77.4* | 63.5* |
| 13. | One can always make easy money in a short period of time when you have your own business. | 36.6 | 47.2 | 36.3 | 49.1 | 43.2 |
| 14. | If you start small business, you can never go bankrupt. | 42.9 | 56.1 | 32.6* | 71.7* | 54.1* |
| 15. | Most often, having a few businesses is better than having a single one. | 67.0 | 62.6 | 77.2* | 49.1* | 60.8* |
Note: * Significant at 0.05
4.3. Respondents’ Level of Financial Knowledge on Money, Money Management and Entrepreneurship
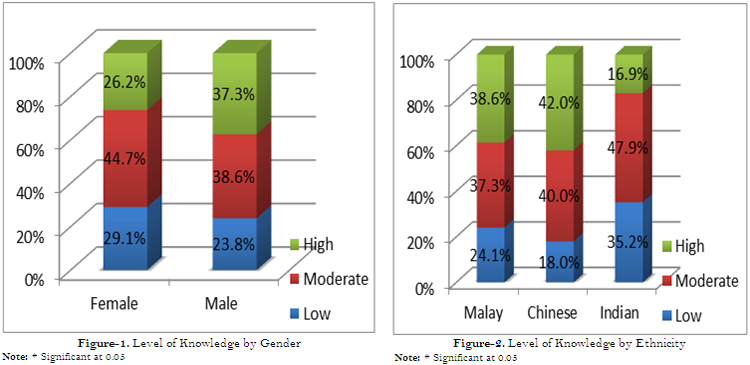
A total of 15 true or false items were given to test respondents’ knowledge on money, money management and entrepreneurship. Scoring cut of points that were less than 10 score categorized as low knowledge group, score between 10 and 12 grouped as moderate knowledge group and score more than 12 as high knowledge group. Cross-tabulation analysis was performed according to respondents’ gender and ethnicity.
In general, Figure 1 indicated that more male respondents (37.6%) tend to have better knowledge on money, money management and entrepreneurship compared to female (26.2%). Majority respondents have moderate level of knowledge for both male (38.6%) and female (44.7%). Figure 2 displayed the result of knowledge by ethnicity. Results showed that 42% of Chinese have good knowledge on money, money management and entrepreneurship followed by Malay (38.6%) and Indian (16.9%). About 84% of Indian scored from moderately to low on money, money management and entrepreneurship Related knowledge.
4.4. Financial Attitude on Money, Money Management and Entrepreneurship
4.4.1. Financial Attitude by Gender
Table 3 showed the result of respondents’ attitude on money, money management and entrepreneurship according to respondents’ gender. About 90% of both male and female respondents had agreed on the statement of “Knowing how to manage money is important to me.” A significant association was found on the item “money is there to be spent”. Majority of respondents scored agree and neutral, but in the score of disagree, more males (22.3%) scored with the disagreement compared to females (14.2%). This showed that female tend to perceive the usage of money is on spending purposes while male tend to disagree with this statement. About 48.2% of males and 54% of females disagree that saving starts once they have a paying job. A total of 63.6% of females tend to earn money by themselves rather than asking their parents for money. However, only 42.6% agreed with this statement. About 95.5% of females and 76.6% of males do not feel comfortable to owe someone money. Besides, both male (63.9%) and female (66%) respondents also agreed on the practice of comparing prices when buying something. About 42% of respondents (both males and females) tend to make risky decision in a matter of savings and investments. In addition, females (79.2%) tend to contribute their profile gain to society while males tend to be more slightly neutral in this phenomenon.
On the other hand, more than 70% of the respondents are confident about their ability to manage their own money (males=72.6%; females=79.3%). Besides, percentage of female (74.8%) is higher compared to male respondents (66.7%) that denoted to have confident to start their own business someday. Respondents also revealed that they are interested to increase their financial knowledge and thought to start their own business. A total of 100% of female and 93.5% of male respondents stressed the importance of saving. About 90% of both male and female respondents denoted the importance to track and check on their spending.
It can be summarized that respondents had acknowledged the importance of saving and controlling their spending. However, less than 6% of respondents (male &female) never worry about not having any money to pay for something that they need. Furthermore, about 70% of respondents responded ‘sometimes’ on the item “If you have an emergency with an unexpected payment needed, would you be able to pay for it without borrowing money?” Respondents also revealed that they usually plan for the future that is less than one year.
Table-3. Respondents’ Financial Attitude by Gender
| No. | Statement | % | ||||||
| Agree | Neutral | Disagree | ||||||
| Female | Male | Female | Male | Female | Male | |||
| 1. | Knowing how to manage money is important to me. | 90.2 | 88.8 | 8.9 | 10.2 | 0.9 | 0.9 | |
| 2. | Money is there to be spent.* | 52.7 | 33.4 | 33.0 | 44.4 | 14.2 | 22.3 | |
| 3. | I should start saving money only when I have a paying job. | 27.0 | 37.7 | 18.9 | 14.2 | 54.0 | 48.2 | |
| 4. | I would rather earn my own money than to ask my parents for money. * | 63.6 | 42.6 | 27.3 | 35.2 | 9.1 | 22.3 | |
| 5. | I am comfortable about owing someone money. * | 1.8 | 11.2 | 2.7 | 12.1 | 95.5 | 76.6 | |
| 6. | I like to compare prices when I buy something. | 66.0 | 63.9 | 24.1 | 28.7 | 9.8 | 7.4 | |
| 7. | I am prepared to take the risks involved when saving or making an investment. * | 42.0 | 40.7 | 44.6 | 46.3 | 13.4 | 13.0 | |
| 8. | If I have my own business, I will use a part of the profits gained to contribute to the society. * | 79.2 | 56.6 | 14.4 | 31.1 | 6.3 | 12.3 | |
| Confident | No Confident | |||||||
| Female | Male | Female | Male | |||||
| 9. | How sure/confident do you feel about your ability to manage your own money? | 79.3 | 72.6 | 20.7 | 27.3 | |||
| 10. | How confident are you about starting your own business someday? * | 74.8 | 66.7 | 25.2 | 33.3 | |||
| Interested | No interested | |||||||
| Female | Male | Female | Male | |||||
| 11. | How interested are you in increasing your financial knowledge? * | 99.2 | 90.6 | 0.9 | 9.4 | |||
| 12. | Would you like to start your own business or have you thought about having your own business? * | 86.4 | 73.2 | 13.5 | 26.8 | |||
| Important | No important | |||||||
| Female | Male | Female | Male | |||||
| 13. | Do you think it is important to save? * | 100 | 93.5 | - | 6.5 | |||
| 14. | How important it is for you to track and check on your spending? | 89.2 | 89.7 | 10.8 | 10.3 | |||
| Always | Sometimes | Never | ||||||
| Female | Male | Female | Male | Female | Male | |||
| 15. | Are you worried about not having enough money to pay for something you need? * | 54.5 | 34.3 | 43.8 | 60.2 | 1.8 | 5.6 | |
| 16. | If you have an emergency with an unexpected payment needed, would you be able to pay for it without borrowing any money? | 5.4 | 7.5 | 71.4 | 70.1 | 23.2 | 22.4 | |
| One year and less | More than one year | No future plan at all | ||||||
| Female | Male | Female | Male | Female | Male | |||
| 17. | Thinking about money, how far ahead do you usually plan for the future? | 63.3 | 64.7 | 33.1 | 29.5 | 3.7 | 5.7 | |
Note: *Significant at 0.05
4.4.2. Financial Attitude by Ethnicity
Table 4 displayed the result of respondents’ attitude on money, money management and entrepreneurship by respondents’ ethnicity. Majority of Malays (92.4%), followed by Indians (92%) and Chinese (80.1%) respondents had agreed about the importance of money management. More than 40% of both Malays and Indians agreed that money is there to be spent while 49.1% of Chinese neutral with this statement. Besides, more than 50% of Malays and Chinese and about 40% of Indians respondents disagreed to start saving money after working. Furthermore, Malays (70.6%) respondents tend to be more concerned about prices and would compare prices before purchasing something, followed by Chinese (66.1%) and Indians (57.4%). About 45% of respondents from all ethnic groups perceived the preparation to take risk when saving or making an investment as neutral. In terms of contribution to society after having their own business, 79.3% of Malays agreed to contribute to society, followed by Indians (67.2%) and Chinese (50%).
Table-4. Respondents’ Financial Attitude by Ethnicity
| No. | Statement | % | |||||||||||||||||
| Agree | Neutral | Disagree | |||||||||||||||||
| M | C | I | M | C | I | M | C | I | |||||||||||
| 1. | Knowing how to manage money is important to me. | 92.4 | 81.1 | 92.0 | 7.6 | 15.1 | 8.0 | - | 3.8 | - | |||||||||
| 2. | Money is there to be spent.* | 47.8 | 26.4 | 49.3 | 44.6 | 49.1 | 24.0 | 7.6 | 24.6 | 26.7 | |||||||||
| 3. | I should start saving money only when I have a paying job. | 23.1 | 34.7 | 41.9 | 23.1 | 5.8 | 16.2 | 53.9 | 59.6 | 41.9 | |||||||||
| 4. | I would rather earn my own money than to ask my parents for money. * | 61.6 | 41.5 | 51.3 | 28.6 | 35.8 | 31.1 | 9.9 | 22.6 | 17.6 | |||||||||
| 5. | I am comfortable about owing someone money. * | 2.2 | 19.3 | 2.8 | 4.3 | 23.1 | - | 93.5 | 57.7 | 97.3 | |||||||||
| 6. | I like to compare prices when I buy something. | 70.6 | 66.1 | 57.4 | 27.2 | 24.5 | 26.7 | 2.2 | 9.4 | 16.0 | |||||||||
| 7. | I am prepared to take the risks involved when saving or making an investment. * | 45.6 | 32.1 | 42.7 | 43.5 | 47.2 | 46.7 | 10.8 | 20.8 | 10.6 | |||||||||
| 8. | If I have my own business, I will use a part of the profits gained to contribute to the society. * | 79.3 | 50.0 | 67.2 | 16.3 | 34.6 | 21.9 | 4.3 | 15.4 | 11.0 | |||||||||
| Confident | No Confident | ||||||||||||||||||
| M | C | I | M | C | I | ||||||||||||||
| 9. | How sure/confident do you feel about your ability to manage your own money? | 73.9 | 66.0 | 86.1 | 26.1 | 34.0 | 13.9 | ||||||||||||
| 10. | How confident are you about starting your own business someday? * | 75.0 | 58.5 | 74.3 | 25.0 | 41.5 | 25.7 | ||||||||||||
| Interested | No interested | ||||||||||||||||||
| M | C | I | M | C | I | ||||||||||||||
| 11. | How interested are you in increasing your financial knowledge? * | 95.6 | 92.4 | 95.9 | 4.3 | 7.6 | 4.1 | ||||||||||||
| 12. | Would you like to start your own business or have you thought about having your own business? * | 85.8 | 69.8 | 79.7 | 14.2 | 30.2 | 20.3 | ||||||||||||
| Important | No important | ||||||||||||||||||
| M | C | I | M | C | I | ||||||||||||||
| 13. | Do you think it is important to save? * | 98.9 | 92.5 | 97.4 | 1.1 | 7.6 | 2.7 | ||||||||||||
| 14. | How important it is for you to track and check on your spending? | 95.7 | 81.1 | 87.8 | 4.4 | 18.9 | 12.2 | ||||||||||||
| Always | Sometimes | Never | |||||||||||||||||
| M | C | I | M | C | I | M | C | I | |||||||||||
| 15. | Are you worried about not having enough money to pay for something you need? * | 56.5 | 43.3 | 30.7 | 39.1 | 52.8 | 66.7 | 4.3 | 3.8 | 2.7 | |||||||||
| 16. | If you have an emergency with an unexpected payment needed, would you be able to pay for it without borrowing any money? | 3.3 | 5.8 | 10.7 | 78.3 | 82.7 | 53.3 | 18.5 | 11.5 | 36.0 | |||||||||
| One year and less | More than one year | No future plan at all | |||||||||||||||||
| M | C | I | M | C | I | M | C | I | |||||||||||
| 17. | Thinking about money, how far ahead do you usually plan for the future? | 67.8 | 70.0 | 64.1 | 27.8 | 22.0 | 4.0 | 4.4 | 8.0 | 2.7 | |||||||||
Note: * Significant at 0.05
** M= Malay C= Chinese I=Indian
Furthermore, Indians (86.1%) tend to feel more confident in managing their own money compared to Malays (73.9%) and Chinese (66%). Both Malays and Indians have about 75% respondents who were confident to start their own business, while about 40% of Chinese respondents were not confident with this challenge. More than 95% of both Malay and Indian respondents were interested to increase their financial knowledge. Additionally, both Malay (85.8%) and Indian (79.7%) respondents planned to start/thought about having their own business. In contrast, a total of 30.2% of Chinese respondents were not interested to start their own business or had ever thought about it, which had accumulated the highest percentage between ethnic groups. More than 80% of respondents from 3 ethnic groups felt the importance to save and keep track on the expenses. Meanwhile, more than 50%of Chinese and Indians were sometimes worried if they had enough money to pay for something they need. A total with more than 50% of respondents from the three ethnic groups sometimes perceived that they were unable to pay for emergencies without having to borrow money. In addition, more than 50% of respondents from the three ethnic groups usually planned their future for one year or less.
4.5. Financial Practices on Money, Money Management and Entrepreneurship
4.5.1. Financial Practices by Gender
Table 5 presented the results of respondents’ practices/behavior on money, money management and entrepreneurship cross-tabulation with gender. More females (61.6%) tend to plan more frequently when they received money compared to males (51.9%). In contrast, more male respondents (91.6%) kept to the financial plan they had and the respondents ranged from always (36.4%) to sometimes (55.1%) compared to females (90.1%). Besides, females (73.2%) reported that sometimes they spend more than they save while 25.2% of male respondents responded never.
Table-5. Respondents’ Financial Practices by Gender
| No. | Statement | % | |||||
| Always | Sometimes | Never | |||||
| Female | Male | Female | Male | Female | Male | ||
| 1. | When you receive money, do you plan how it will be used? | 61.6 | 51.9 | 33.0 | 45.4 | 5.4 | 2.8 |
| 2. | Do you keep and stick to the plan you have? | 36.0 | 36.4 | 54.1 | 55.1 | 9.9 | 8.4 |
| 3. | Do you spend more than you save? * | 7.1 | 6.8 | 73.2 | 57.9 | 19.6 | 25.2 |
| 4. | Do you use your savings to buy something? | 22.3 | 21.5 | 58.9 | 66.4 | 17.9 | 12.1 |
| 5. | Do you keep track of how much you spend? | 34.2 | 24.3 | 53.2 | 58.9 | 12.6 | 16.8 |
| 6. | Do you have money left after you have paid for food and other necessary items at school? | 28.6 | 27.1 | 60.7 | 64.5 | 10.7 | 8.4 |
| 7. | Have you been in any situation whereby you do not have enough money for food or other necessary items? | 14.3 | 15.0 | 65.2 | 72.9 | 20.5 | 12.1 |
| 8. | Do you help any of your family members/relatives in running a business? | 29.5 | 23.6 | 43.8 | 39.6 | 26.8 | 36.8 |
| 9. | Do you discuss money with your parents? | 29.6 | 20.6 | 47.2 | 62.6 | 23.1 | 16.8 |
| 10. | How often do you personally buy things that you know are not necessary even though you know you cannot afford them? | 4.5 | 11.7 | 64.5 | 55.3 | 30.9 | 33.0 |
Note: * Significant at 0.05
Furthermore, males sometimes will use their saving to buy something (66.4%) and keep track of their expenses (58.9%). Females (34.2%) tend to be ahead of males (24.3%) in always keeping track on how much they had spent. More than 60% of both male and female respondents responded ‘sometimes’ to having extra money left after they had paid for food and other necessary items in school compare to not having enough money for food or other necessary items. In comparison, more male respondents reported that they sometime face with these situations compared to female respondents. Results indicated that female (73.3%) respondents helped their family members/relatives in running a business while about 84% of males did so. About 83% of male respondents tend to discuss money matters with their parents compared to only 76.8% of female respondents. About 30% of both male and female respondents had never bought something that is not necessary. Besides, about 56% of male respondents reported that they have working experiences.
4.6. Financial Practices by Ethnicity
Table 6 displayed the results of respondents’ practices/behavior on money, money management and entrepreneurship cross-tabulation according o ethnicity. Results indicated that none of Chinese respondents reported that they had never planned the usage the money that they had obtained. About 95% of Malays and Indians reported sometimes to always plan for their money usage. More than 90% of Malays and Chinese kept and stuck to the plans that are related to money. About 10.8% of Indians reported did not keep track and stick to the plan that they had. Indians can be categorized as better savers among the three ethnics. As stated, about 28% of Indian had never spent more than their saving and 20% of them had never used their saving to buy something. More than 80% of respondents (Malays, Chinese and Indians) had keep track on how much money they had spent. About 65% of respondents responded sometimes they had some money left after they had paid for food and other necessary item in school and sometimes experienced some situation where they did not have enough money for food and other necessary items. Approximately 30% of Indian respondents reported that they had never discussed money matters with their parents, followed by Chinese (17%) and Malays (14.3%). Besides, Indian respondents also reported to have higher percentage (42.5%) of not purchasing unnecessary things, followed by 28.8% of Chinese and 25% of Malays.
Table-6. Respondents’ Practices by Ethnicity
| No. | Statement | % | ||||||||
| Always | Sometimes | Never | ||||||||
| M | C | I | M | C | I | M | C | I | ||
| When you receive money, do you plan how it will be used? * | 65.2 | 45.3 | 54.7 | 29.3 | 54.7 | 40.0 | 5.4 | - | 5.3 | |
| Do you keep and stick to the plan you have? * | 26.4 | 32.1 | 51.4 | 65.9 | 58.5 | 37.8 | 7.7 | 9.4 | 10.8 | |
| Do you spend more than you save? | 13.2 | 18.9 | 5.3 | 69.2 | 58.5 | 66.7 | 17.6 | 22.6 | 28.0 | |
| Do you use your savings to buy something? | 22.8 | 17.3 | 24.0 | 60.9 | 75.0 | 56.0 | 15.2 | 7.7 | 20.0 | |
| Do you keep track of how much you spend? | 33.0 | 17.3 | 33.3 | 53.8 | 67.3 | 50.7 | 13.2 | 15.4 | 16.0 | |
| Do you have money left after you have paid for food and other necessary items at school? | 32.6 | 25.0 | 24.0 | 59.8 | 67.3 | 62.7 | 7.6 | 7.7 | 13.3 | |
| Have you been in any situation whereby you do not have enough money for food or other necessary items? | 17.4 | 11.5 | 13.3 | 69.6 | 73.1 | 65.3 | 13.0 | 15.4 | 21.3 | |
| Do you help any of your family members/relatives in running a business? * | 34.1 | 23.1 | 20.0 | 41.8 | 25.0 | 53.3 | 24.2 | 51.9 | 26.7 | |
| Do you discuss money with your parents? * | 29.7 | 17.0 | 25.4 | 56.0 | 66.0 | 45.1 | 14.3 | 17.0 | 29.6 | |
| 1 10. |
How often do you personally buy things that you know are not necessary even though you know you cannot afford them? | 9.1 | 11.5 | 4.1 | 65.9 | 59.6 | 53.4 | 25.0 | 28.8 | 42.5 |
Note: M= Malay; C= Chinese; I= Indian
Table 6 also denoted that about 59.6% of Chinese respondents have working experience, which was among the highest compared to Malay (47.8%) and Indian (44%). Results also indicated that Chinese as compared to other ethnic groups have more tendencies to borrow money from family or friends (73.6%), use saving (84.9%), sell something that they have (24.5%), find extra work/part-time (52.8%), reduce their daily expenditure (71.7%) and spend less on the things that they want (75.5%). Moreover, Indian respondents had received highest (45.3%) cash gifts from family or friends, followed by Malays (37%) and Chinese (30.2%).
5. CONCLUSION AND RECOMMENDATIONS
Current study was conducted to analyze the youths’ financial knowledge, attitude and practices towards money, money management and entrepreneurship. These findings are the evident in several different measures. In the concern of ethnicity, Indian population tends to have lower level of financial related knowledge. Knowledge regarding money, business, insurance and investment were significantly low among Indian respondents compared to Malay and Chinese. Whereas, in relation to gender differences on financial knowledge, male youths had higher financial literacy compared to female youths. This study revealed that males tend to have better knowledge on financial management and money matters than females. In addition, Malays tend to have more positive attitude regarding money and financial matters compared to Chinese and Indians. Both male and female youths reported to have positive attitude toward money, money management and entrepreneurship but male youths to have slightly low attitude as compared to females.
Furthermore, the results outlined in the previous section verified that gender bias were highlighted in the general financial literature. Males tend to have negative financial practices compared to females. More male youths reported to have no money left after paying for food and other necessary items at school compared to female youths. On the other hand, the study found that Malay tend to spend more than save, often found themselves in situation that they did not have enough money for food or other necessary items and bought things which were unnecessary. These situations reflected cultural differences and individual differences between ethnic groups and genders may perceive and act differently.
The findings contained in this research could highly contribute to the development of financial empowerment program for the youths in Malaysia. The program is to provide an insight to program developer, organization of program planning committee as well as practitioners, general public and single individual on financial literacy with specific group. All the information could also provide a solid starting point for discussion and debate among leading researchers.
Herewith, different methods or approaches need to be further examined and experimented in order to apply the program in different setting by considering the preference of gender and ethnic specifically to enhance more positive attitude towards financial management. Moreover, it is recommended to develop some program targets to raise awareness about the importance of money, money management, future planning and lifestyle as well as other financial related issues. The objective of such programs is viewed as crucial in order to expose the public to the significance of financial planning presently and future prospect as well.
| Funding: This study received no specific financial support. |
| Competing Interests: The authors declare that they have no competing interests. |
| Contributors/Acknowledgement: Both authors contributed equally to the conception and design of the study. |
REFERENCES
Ajzen, I., 1991. The theory of planned behavior. Organizational Behavior and Human Decision Processes, 50(2): 179-211. View at Google Scholar
Belk, R.W. and M. Wallendorf, 1990. The sacred meanings of money. Journal of Economic Psychology, 11(1): 35–67.View at Google Scholar | View at Publisher
Bernthal, M.J., D. Crockett and R.L. Rose, 2005. Credit cards as lifestyle facilitators. Journal of Consumer Research, 32(1): 130-145.View at Google Scholar | View at Publisher
Department of Statistic Malaysia, 2014. Life expectancy at birth 2014. Unit Development Unit.
Falahati, L. and L.H. Paim, 2011. Gender differences in financial well-being among college students. Australian Journal of Basic and Applied Sciences, 5(9): 1765-1776. View at Google Scholar
Furnham, A. and R. Okamura, 1999. Your money or your life: Behavioral and emotional predictors of money pathology. Human Relations, 52(9): 1157–1177.View at Google Scholar | View at Publisher
Jariah, M., A.R. Husniyah, P. Laily and S. Britt, 2004. Financial behavior and problems among university students: Need for financial education. Journal of Personal Finance, 3(1): 82-96. View at Google Scholar
Kapoor, J.R., L. Dlabay and R. Hughes, 2004. Personal finance. 7th Edn.: McGraw-Hill.
Kojo, O.E., 2010. Financial literacy and youth entrepreneurship in South Africa. African Journal of Economic and Management Studies, 1(2): 164-182. View at Google Scholar | View at Publisher
Kwong, C., D. Jones-Evans and P. Thompson, 2012. Differences in perceptions of access to finance between potential male and female entrepreneurs: Evidence from the UK. International Journal of Entrepreneurial Behavior & Research, 18(1): 75-97.View at Google Scholar | View at Publisher
Leung, A., 2011. Financial management practices and social reproduction. Qualitative Market Research: An International Journal, 14(2): 218-239. View at Google Scholar | View at Publisher
Linan, F. and F.J. Santos, 2007. Does social capital affect entrepreneurial intentions? International Advances in Economic Research, 13(4): 443-453.View at Google Scholar | View at Publisher
Lusardi, A. and O.S. Mitchell, 2011. Financial literacy around the world: An overview. Journal of Pension Economics and Finance, 10(4): 497-508. View at Google Scholar | View at Publisher
Lusardi, A. and P. Tufano, 2015. Debt literacy, financial experiences, and overindebtedness. Journal of Pension Economics and Finance, 14(04): 332-368. View at Google Scholar | View at Publisher
Mccormick, M.H., 2009. The effectiveness of youth financial education: A review of the literature. Association for Financial Counseling and Planning Education, 20(1): 70–83. View at Google Scholar
Media Research Consultants Pte Ltd, 2005. Quantitative research on financial literacy levels in Singapore. Report Prepared for The MoneySENSE Financial Steering Committee (FESC), Singapore.
Ministry of Human Resource, 2013. Youth employment Malaysia. ASEAN Forum on Youth Employment. Retrieved from http://www.ilo.org/wcmsp5/.
Nga, J.K., L.H. Yong and R. Sellappan, 2011. The influence of image consciousness, materialism and compulsive spending on credit card usage intentions among youth. Young Consumers, 12(3): 243-253. View at Google Scholar | View at Publisher
Parment, A., 2013. Generation y vs. Baby boomers: Shopping behavior, buyer involvement and implications for retailing. Journal of Retailing and Consumer Services, 20(2): 189-199.View at Google Scholar | View at Publisher
Prince, M., 1989. Gender and money attitudes of young adults. Gender Conference. pp: 284–291.
Qian, H. and Z.J. Acs, 2013. An absorptive capacity theory of knowledge spillover entrepreneurship. Small Business Economics, 40(2): 185-197.View at Google Scholar
Sabri, M.F. and M. MacDonald, 2010. Savings behavior and financial problems among college students: The role of financial literacy in Malaysia. Cross-Cultural Communication, 6(3): 103-110.View at Google Scholar
Sabri, M.F., M. MacDonald, T.K. Hira and J. Masud, 2010. Childhood consumer experience and the financial literacy of college students in Malaysia. Family and Consumer Sciences Research Journal, 38(4): 455–467. View at Google Scholar | View at Publisher
Sánchez Cañizares, S.M. and F.J. Fuentes García, 2010. Gender differences in entrepreneurial attitudes. Equality, diversity and inclusion. An International Journal, 29(8): 766-786. View at Google Scholar | View at Publisher
Sherraden, M.S., L. Johnson, B. Guo and W. Elliott III, 2011. Financial capability in children: Effects of participation in a school-based financial education and savings program. Journal of Family and Economic Issues, 32(3): 385-399. View at Google Scholar
Shim, S., B.L. Barber, N.A. Card, J.J. Xiao and J. Serido, 2010. Financial socialization of first-year college students : The roles of parents, work , and education. Journal of Youth Adolescence, 39(12): 1457–1470. View at Google Scholar
Tang, T.L.P., 1994. The development of a short money ethic scale: Attitudes toward money and pay satisfaction revisited. In Symposium on the Meaning of Money (Matthias Fank, Convener and Chairperson) at the 23rd International Congress of Applied Psychology.
Templer, D.I. and K. Yamauchi, 1982. Money attitude scale. Journal of Personality Assessment, 46(5): 522-528.
Wu, S. and L. Wu, 2008. The impact of higher education on entrepreneurial intentions of university students in China. Journal of Small Business and Enterprise Development, 15(4): 752-774. View at Google Scholar | View at Publisher
Youth Save, 2010. Youth savings in develpoing countries trends in practices, gaps in knowledge, Master Card Foundation. Washington, DC: New America Foundation, 7.