


NIGERIA’S FISCAL HEALTH: AN ANALYSIS OF BUDGET PROCESS, SYSTEMS AND TRENDS [2014 – 2016]

1Graduate Research Assistant, Department of Economics, University of Ibadan, Nigeria
2Assistant Professor, KDI School of Public Policy and Management, South Korea
3Finance Department , Civil Service Commission of Maldives
4African Development Bank, Pretoria, South Africa
5Directorate of Economic Monitoring and Research, Uganda
6Higher Institute of Commerce and Business Administration, Morocco
7Ministry of Finance, Tanzania
ABSTRACT
Nigeria is an oil dependent economy which faced a lot of economic and political challenges between the periods under review, such as increased broad money supply, fall in the value of money market assets, decline in the unpaid FGN Bonds, unfavorable exchange rates, fall in oil prices, and the May 2015 general elections, amongst others. Nigeria’s fiscal stance was thus threatened, and it is in light of these that the paper, uses interactions between expenditure, revenue, debts, and deficits trends, to compute indices that capture its fiscal health. The study found that using compounded annual growth rates (CAGR), certain sectors with high CAGRs (Interior, Transport, Finance, Science & Technology, and Health) seemed to be prone to high fiscal mismanagement. Also, conservativeness in applying debt instruments are unavailable, and such measures are not tied to growth; revenue from increased taxation are not matched with requisite infrastructure; and debts are not adequately tied to capital projects, as established in Fiscal Responsibility Act. Amidst several, few recommendations are undoubtedly notable mainly; that overhead costs revealed in several line-items and are marked up should be eradicated; and huge recurrent expenditure, mainly personnel cost (about 75% of the total budget) mostly visible as remuneration “in kind” should be strictly removed from the line items and programmes at MDA level. Thus, Nigeria’s government should maintain expenditure ceilings; create solidified link between policy and budget; establish realistic fiscal targets and indicators; and allow more public participation in budget process.
Keywords:Fiscal sustainability Fiscal health Crude oil revenue CAGR Budget process Nigeria Etc.
ARTICLE HISTORY: Received: 15 May 2017,Revised:20 June 2017, Accepted:10 June 2017, Published:25 July 2017.
Contribution/ Originality:This study contributes to existing literature on fundamentals of budgeting, as well as Nigeria’s budget practices. The paper's primary contribution is finding that comparison of fiscal performance per ministry through the use of CAGR estimation methodology before and after general elections gives insights into the financial behaviour of transition governments.
1. INTRODUCTION
Recent fluctuations in the crude oil market, which started in December 2014, and was particularly severe in the year 2015, greatly affected oil dependent developing countries, Nigeria inclusive. For the most part, the price of crude oil fell from $110.19 per barrel in December, 2014 to $48.81 per barrel in January, 2015 (Central Bank of Nigeria, 2016)1 . Also, the political atmosphere was characterized by a change in government following the May 2015 general elections. The change in government emanated from fierce campaign and cut-throat competition at the federal level. The competition was due to a coalition and merger of three major opposition parties, to win power from a 16-year major ruling party, alongside many other issues surrounding Nigeria’s fiscal health.
In 2015, there was an increase in broad money supply and this continued and even accelerated in the fourth quarter. This key monetary aggregate recorded a growth of 7.0percent in the last quarter of 2015 (which marked the period when the salary intervention fund was dispatched to the state government). There was a reduction in the deposit and lending rates of banks, erupting from 2014 through the fourth quarter of 2015. The value of money market assets owing at the last quarter of 2015 was N8, 615.72 billion, representing a fall of 4.6 per cent below the previous level. This development erupted as a result of the decline in the unpaid FGN Bonds.
The paper proceeds as follows: the first major part is a description of the general fiscal health of Nigeria’s budget; while part 2 is a discussion on Nigeria’s budget processes. The next major part of this research looks at Nigeria’s budget format and information management, and this is followed by an analysis of Nigeria’s expenditure and revenue trends. The paper ends with some recommendations.
2. BUDGET AND PUBLIC POLICY
2.1. Description of the General Fiscal Health
This section benchmarks the revenues, outlays, and economic parameters, thus gauging the size of government and calculation of compounded annual growth rates. Furthermore, we use the compound annual growth rate (CAGR) as a fiscal analysis tool to gauge the size of government, on a year-to-year growth in expenditure outlays or revenue;

Table-1. Fiscal Health of FGN Budget (Expenditure & Revenue), 2014, 2015 & 2016
| HIGHLIGHTS OF THE FISCAL HEALTH OF THE REPUBLIC OF NIGERIA BUDGET FOR THE YEARS 2014, 2015 AND 2016: BUDGET PARAMETRES, TOTAL REVENUE AND EXPENDITURES | ||||
| Parameters Underpinning the Budget | 2014 | 2015 | 2016 | CAGR |
| Daily Oil Production (mbpd) | 2.39 | 2.28 | 2.20 | -4.1% |
| Crude Oil Index: Price per Barrel (US$) | 75.5 | 53.00 | 38.00 | -29.1% |
| Projected GDP Growth Rate | 6.2 | 5.50 | 4.37 | -16.0% |
| Average Exchange Rates (US$) | 160 | 190 | 197 | 11.0% |
| Total Revenue available to FGN (N/Bn) | 3,730 | 3,413 | 3,856 | 1.7% |
| Oil Revenue, Non-Oil Revenue & Other Revenues | 3,730 | 3,413 | 3,856 | 1.7% |
| Total Aggregate Expenditure (N/Bn) | 4,643 | 4,479 | 6,064 | 14.3% |
| Re-Current (Non-Debt) Expenditure | 2,431 | 2,593 | 2,649 | 4.4% |
| Statutory Transfers | 400 | 376 | 352 | -6.2% |
| Debt Servicing | 712 | 954 | 1,475 | 43.9% |
| Capital Expenditure (Including SURE-Programs) | 1,100 | 556 | 1,588 | 20.2% |
| Fiscal Surplus (Deficit) | -913 | -1,066 | -2,208 | 55.5% |
| Fiscal Deficit (% of GDP) | 1.90% | 1.09% | 2.16% | 6.6% |
Source: Author’s Compilation
Above analysis of revenues and expenditures through calculations of compounded annual growth rates and percentages as depicted in Table 1 and Figures 1, 2, 3 & 4; Nigeria fiscal health may be described as a country reliant on debt finance for both capital and re-current expenditures (PWC, 2015; 2015 Nigeria's Recurrent Expenditure Financing). For instance, CAGR of total aggregate expenditures was 14.3%, compared to that of revenues at 1.7% resulting in a CAGR of budget deficit at 55.5% for the period in review. Re-current expenditure and debt servicing has continued to increase for the 3 years, thereby showing a CAGR of 4.4% and 43.9% respectively. This is an indication of challenges related to the fiscal sustainability of the budget expenditures vis-à-vis revenue collections and thus high budget deficit (Figure 5).
In addition, an analysis in respect to a sample of 10 Bureaus was conducted for evaluating CAGRs as a measure of the fiscal health of Nigeria’s Budget. The analysis as depicted in Table 2 show that a number of bureaus had slightly high increase in fund allocations than others, as represented by the respective CAGRs. Notably, bureaus with high CAGRs included; interior – 93.2%, Transport – 30%, Finance -10.5%, Science & Technology – 3.7%, and Health – 1.2% respectively as depicted in Table 2 below.
Table-2. Fiscal Health of FGN Budget (Expenditure Allocations), 2014, 2015 & 2016
| HIGHLIGHTS OF THE FISCAL HEALTH OF THE REPUBLIC OF NIGERIA BUDGET FOR THE YEARS 2014, 2015 AND 2016: BUDGET ALLOCATIONS | ||||
| Expenditure Outlays - Line Items | 2014 | 2015 | 2016 | CAGR |
| Recurrent (Non-Debt) Expenditures (N Billion) | ||||
| Federal Ministry of Finance | 1,216.31 | 12.89 | 1,485.69 | 10.5% |
| Federal Ministry of Police Formations & Commands | 285.56 | 303.82 | 0.70 | -95.0% |
| Federal Ministry of Defense | 306.04 | 338.80 | 294.53 | -1.9% |
| Federal Ministry of Health | 216.40 | 237.08 | 221.71 | 1.2% |
| Federal Ministry of Education | 443.92 | 392.36 | 446.67 | 0.3% |
| Federal Ministry of Youth Development | 75.96 | 69.42 | 70.82 | -3.4% |
| Federal Ministry of Power/Housing/Works | 375.23 | 35.30 | 34.25 | -69.8% |
| Federal Ministry of Interior | 144.72 | 153.33 | 428.37 | 72.0% |
| Federal Ministry of Science and Technology | 24.06 | 26.59 | 25.85 | 3.7% |
| Federal Ministry of Transport | 8.17 | 9.26 | 13.80 | 30.0% |
| Federal Ministry of Agriculture | 31.49 | 31.87 | 29.75 | -2.8% |
| Federal Ministry of Petroleum Resources | 55.71 | 58.28 | 54.47 | -1.1% |
Source: Author’s Compilation
In conclusion, the above analysis of the fiscal health of the Nigeria Budget for the period 2014-2016 has indicated levels of fluctuations in total aggregate expenditures, especially recurrent expenditures and debt servicing. This was to facilitate the expenditure incurred in the transition government, as well as to attain the goals of the “budget of change” (Table 7). This situation may be associated with the country’s macro-economic outlook of low economic growth, high inflation rate, and global oil price instability.
3. BUDGET PROCESSES
3.1. Budget Process for the Federal Republic of Nigeria
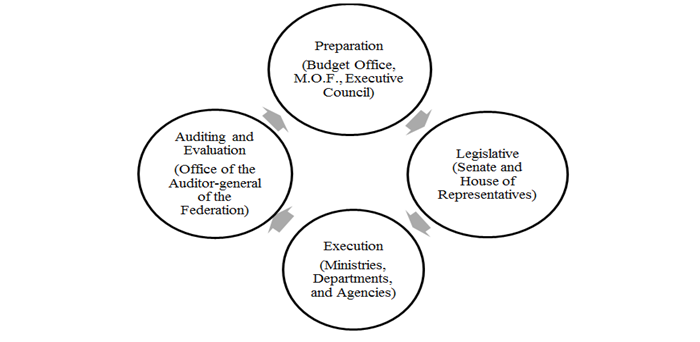
The budget is officially referred to as the Appropriation act in the Constitution of the Federal Republic of Nigeria 1999 where Section 318(1) dictates that the financial year be every twelve months (annual) commencing 1st January to 31st December. Nigeria’s budget process in Nigeria is made up of 4 processes which are recurring and over lapping i.e. Planning/ Formulation, Legislature, Spending, Auditing The budget is introduced by the Executive, approved by the Legislature then signed into law by the President.
Stage-1. Planning
The budget is developed in accordance with the Federal Governments Fiscal Policy by the Budget Office of Ministry of Finance. Key revenue generating and economic agencies meet with the Budget office to review and project revenue trends, macro-economic indicators and implications of these trends. From this, a Medium Term Revenue Framework (MTRF) is made from which revenues can be projected. With respect to the MTRF, the Medium Term Expenditure Framework (MTEF) is developed describing crucial areas of expenditure for example, debt servicing, Ministries Departments and Agencies (MDAs) expenditure amongst others (Chukwuemeka, 2012).
This process begins as early as February and should be finalized by August.
Stage-2. Legislature
The approved draft budget together with supporting documents is then officially presented for consideration and appropriation by the President to the National assembly in a joint session by the Senate and House of Representatives for example, the 2016 draft budget was presented to the National Assembly by President Muhammadu Buhari on 22nd December 2015 in a break to tradition as the role is often left to the Finance Minister. This delay is a common practice in Nigeria and shows a bureaucratic process that hampers quick implementation of the budget.
The two budget drafts and recommendations made by different committees are then harmonized to make one budget. The budget is then approved by the Senate and House of Representatives independently after which it is then presented to the President as an Appropriation bill for approval. If approved and signed, it becomes an Act of Parliament passed into law (Shamsuddeen, 2010). The 2016 budget was passed on 14th March 2016.
Stage-3. Execution
Through the Ministry of Finance, funds are released to the various MDAs in line with budgetary allocations after the budget has been passed. In the case of capital projects, funds are released on a quarterly basis. The Cash Management Committee ensures availability of funds for smooth running of the budget.
Stage-4. Auditing
The Office of the Auditor General(OAG) of the Federation in collaboration with various other departments such as the Presidential Monitoring Committee(PBMC), Ministry of Finance, the National Intelligence Agency are responsible for monitoring and evaluation of how effective budget implementation has been. The auditing process is a continuous one and is always recurring, and over laps into each year.
3.2. Public Participation
Public participation is largely composed of the study, analysis and over view of the Budget and is only by the elite part of society. The government facilitates public participation by uploading copies of the Budget Implementation Reports on search engines, the website of MOF and the National Institute of Legislative Studies (NILS) the country’s think tank. On Budget reading day, the budget is also published in all national newspapers and made available to everyone.
A private institution budgIT www.yourbudgit.com is the most widely used channel through which public participation occurs. It is funded by the United Nations Democracry Fund (UNDF) which recieves voluntary contributions from governments across the world. As of November 2016, it was evident that only 8 states had their budget documents online for the public to appraise and monitor performance (yourbudgit.com, 2016). As a result of this the Ministry of Finance mandated subnational governments caught up in the 2015-2016 Fiscal crisis to publish their budget documents and the project implementation reports online in order to assess bailout funds (Adedoyin, 2016)(yourbudgit.com 2016).
Conclusively, very rarely has budget implementation commenced official on 1st January for the past 10 years expect for 2001 and 2007. Delays in budget submission to the National assembly have led to delayed commencement and consequently, poor budget implementation which has poor implications for the functioning of the economy and hinders actualization of the country’s goals.
4. BUDGET FORMAT AND INFORMATION MANAGEMENT
4.1. Budget Formats
Typically, there are four common types of approaches used to present budget format: line-item, performance based, program based, and zero-based budget.
4.2. The Budget Reforms in Nigeria
The FGN has undertaken various reforms in public services since 1999 including budget management reforms among others (Ben-Caleb et al., 2014). The major aim of these reforms was to increase budget control and disciplines within the public sectors. The FGN initiated the Medium Term Expenditure Framework (MTEF) 2005 and the Fiscal Responsibility Act (FRA) 2007 as the alternative for budget reforms, whereas budget discipline (BDISC) and fiscal discipline (FDISC) were also applied as other alternatives for the quality of budgeting. These reforms focused on five main aspects that are; administrative procedures, budget preparation, management of government spending, budget implementation, as well as budget monitoring and evaluation (Ben-Caleb et al., 2014). Among four budget formats, the FGN have adopted two types of budget formats since 1999 namely; line-item and Zero Based Budgets as described here under;
4.2.1. Line-Items Budget in Nigeria
Since 1999 to 2015, Federal Government of Nigeria implemented line-item budgeting which classifies all expenditures according to organization chart or departments. Under the line-item budget, all items are listed, the resources and each types or class of items the government will purchase during the particular fiscal year are arranged vertically.
4.2.2. Zero-Based Budget in Nigeria
From Fiscal year 2016 to date, FGN budget was prepared using new budget format known as Zero-Based Budgeting (ZBB) program. ZBB necessitates the line Ministries, Departments and Agencies (MDAs) to conduct evaluation of all ministry programs in order to determine the funding required for each program. However, the budget format and its preparation process in Nigeria are based on Medium Term Expenditure Framework (MTEF) (Adedipe, 2015).
The main reason for the government to move from line –item to ZBB is among others; to encourage the accomplishment of a more cautious public fund management, helping to reduce inefficiency and wastage particularly in recurrent expenditure and complimentary more funding for infrastructural development (Pricewaterhouse Coopers Limited, 2016).
4.3. Funds on Nigeria’s Budget
Having highlighted the budget format in place (ZBB), the Federal Government of Nigeria (FGN) has created very important funds for the countries well-being and for the benefit of its citizens; many of them are funded by the government. Generally, FGN budget constitutes the following types of funds namely; General fund, Capital Development Fund, Social Insurance Fund, Nigeria Trust Fund, Nigeria Infrastructure Fund (NIF), Social Development Fund, Operational Surplus and General Reserve Fund and Consolidated Revenue Fund among others.
4.4. Revenue Forecasting in Nigeria
This is done by the executive director of Budget Office. Normally, The Budget Office of the Ministry of Finance meets early in each fiscal year with other revenue agencies (the Federal Inland Revenue Service (IRS), Nigerian Customs Service (NCS) and economic agencies (including National Planning Commission, National Bureau of Statistics and Central Bank of Nigeria) to review and decide the movement in revenue performance and key macroeconomic indicators and the implication of such inclination for the next fiscal years (Note).
5. EXPENDITURE AND REVENUE TRENDS: LEVELS AND COMPOSITION
In order to understand more Nigeria’s fiscal health, a deep analysis of Nigeria’s budget revenue and expenditure is required. This analysis will examine the 2016 budget year with retrospection to the years 2015 and 2014. Table 3 shows Nigeria’s aggregate revenue and expenditure for the years under consideration.
Table-3. Nigeria’s Budget Deficit through the years 2014, 2015, 2016
| 2014 | 2015 | 2016 | % Change (2014/2015) | % Change (2015/2016) | |
| Aggregate Revenue ( N’tn) | 3.73 | 3.413 | 3.87 | -8.5 | 13.1 |
| Aggregate Expenditure ( N’tn) | 4.64 | 4.49 | 6.06 | -3.23 | 34.96 |
| Deficit ( N’tn) | 0.91 | 1.077 | 2.22 | 18.35 | 106.12 |
Source: Author’s Compilation
5.1. Expenditure Trends
Government expenditure is the fiscal policy tool by which the government spends funds on public goods and services. It is divided into capital and recurrent expenditures, which is the expenditure on fixed assets that create future benefits, and recurrent expenditure, is spending on purchase of goods and services, salaries, wages and others routine expenditures. In 2016, 74% of Nigeria’s budget was on recurrent expenditure and 26% was on capital expenditure (Figure 6).
Expenditure in 2015 fell by -3.23% given that it was a transitory budget, government cut expenditure because of oil price dropped. However, in 2016, there was a sharp rise of almost 35% with the increase being mainly in capital expenditure (Table 6). The government has increased capital expenditure as an avenue to facilitate investment and therefore diversify revenue given the falling oil prices. This shows that Nigeria has employed an expansionary fiscal policy which is geared towards expanding the economy. By expanding expenditure, Nigeria hopes to increase aggregate demand and real GDP (Ugbede et al., 2016). To fund this increase in expenditures, borrowing is now 24.3% of the budget.
It is also insightful to show expenditure of the government in per capita terms. Expenditure per capita is how much the government spends on each individual. It is nominal expenditure divided by population. Changes in expenditure per capita have followed the general trend of expenditure as explained above.
.Table-4. Expenditure per capita for years 2014, 2015, 2016
| 2014 | 2015 | 2016 | |
| Expenditures ( N’tn) | 4.64 | 4.49 | 6.06 |
| Population | 177, 475,986 | 182, 201,962 | 186, 987,563 |
| Expenditures/Capita (N) | 26, 144 | 24, 643 | 32, 409 |
Source: Author’s Compilation
When adjusted for inflation, nominal expenditure per capita becomes real expenditure per capita. The table below shows nominal expenditure adjusted for inflation. It is important to note that the rate of inflation has been increasing annually; rapid expenditure led to the growth of the money supply, which rapidly increased the rate of inflation.
Table-5. Real expenditures for years 2014, 2015, 2016
| 2014 | 2015 | 2016 | |
| Nominal Expenditures (N’tn) | 4.64 | 4.49 | 6.06 |
| Inflation rate (%) | 8.4 | 9.6 | 17.1 |
| Real Expenditures (N’tn) | 55 | 47 | 35 |
Source: Author’s Compilation
5.1.1. Recurrent Expenditure (Non-Debt)
As mentioned before, recurrent expenditure is spending on purchase of goods and services, salaries, wages and others routine expenditures. Non-debt recurrent expenditure is that specifically allocated for expenditures not related to debt servicing/repayment. Throughout the years 2014; 2015; 2016, the non-debt recurrent expenditure increased respectively by 6.67% and 2.14% (Table 6). This was due to revelations of ghost workers1 in Nigeria’s civil service system2 . Nigeria’s non-debt recurrent expenditure consists of; personnel costs, pensions, service wide votes 3, overhead costs and others (Figure 7). For the 2016 budget year, those outlays are estimated N2.649 trillion which is about 43.7% of the aggregate expenditure of N6.06trillion. In 2016, the top recurrent expenditures heads are N1485.69bn for Finance; N446.67bn for Education; N428.37bn for Interior, N294.53bn for Defense and N221.53bn for Ministry of Health (Table 7).
5.1.2. Debt Servicing
According to Investopedia, debt servicing is the amount of money that is required for repayments of interest and principal on outstanding loans. Outstanding loans refer to the proportion of loans that remains to be paid. The cost of servicing the Federal Government’s debt was N712bn in 2014, N953.62bn in 2015 and was expected to be N1.475tn in 2016 (Table 6), a record level as it represents the highest one since 2003 accounting for about 24.3% of total projected expenditure. However, in spite of this large proportion of outstanding loans, Nigeria continued to borrow and in 2016, 38.2% of its revenue was obtained from loans to implement the expansionary fiscal policy. Consequently, due to the country’s increased borrowing; total debt profile became 14% of GDP which may lead to a debt trap4 . The portions of foreign and domestic debt are respectively N1.3tn and N54.5bn. Most of Nigeria’s loans come from World Bank, China Exim Bank and Japan International Corporation.Furthermore, a sinking fund of N113.4bn is for the purpose of retiring matured loans.
5.1.3. Capital Expenditure
As mentioned previously, capital expenditure is the expenditure on fixed assets that create future benefits. The 2016 spending plan envisages the rise of the capital expenditure by about 180%, from N557bn in the 2015 to N1.58tr which represents about 26% of total expenditure. It’s also worth noting that the total capital expenditure is approximately N1.8tr including N157bn as share of capital expenditure in Statutory Transfers and N86bn in Debt Service. In return, the unprecedented increase in the capital expenditure comes from the significant resource allocations to critical sectors. For instance, the capital expenditure allocation related to the ministry of works, power and housing was estimated as N433.4 billion or about 27% of the capital expenditure being the top recipient of capital spending. Other critical sectors allocations should be mentioned such as: Transport N202.0bn; Defense N134.57bn; and Interior N70.08bn (Table 7). Thus, the investment in critical infrastructures and security shows the will of the government to boost the Nigerian economy.
Table-6. Breakdown of expenditures with the changes for years 2014, 2015, 2016
| Expenditures | 2014 | 2015 | 2016 | % change (2014/2015) | % change (2015/2016) |
| Recurrent Non-debt (N' bn) | 2431 | 2593 | 2649 | 6.67 | 2.14 |
| Debt Service (N' bn) | 712 | 954 | 1475 | 33.93 | 54.71 |
| Capital Expenditure (N' bn) | 1100 | 557 | 1588 | -49.36 | 185.03 |
| Statutory Transfers 1 (N' bn) | 400 | 376 | 351 | -6.00 | -6.55 |
| Total Expenditure (N' tn) | 4.64 | 4.49 | 6.06 | -3.23 | 34.96 |
Source: Author’s Compilation
.Table-7. Crude oil price from 2014 to 2016
| Highlights | 2014 | 2015 | 2016 | % change (2014/2015) | % change (2015/2016) |
| Price per barrel ($) | 77.5 | 53.00 | 38.00 | -31.61 | -28.3 |
| Daily production (mbpd) | 2.39 | 2.28 | 2.2 | -4.6 | 3.51 |
Source: PWC (2016)
5.2. Revenue Trends
Revenue refers to aggregate amount of income collected from all governments’ avenues. Because Nigeria is an oil dependent country, its revenue can be broadly broken down into oil revenue and non-oil revenue. In 2016, oil revenue and non-oil revenue accounted for 21% and 79% of total revenue respectively (Figure 8). In 2015, total revenue declined by -8.5% because of plummeting decline in global oil prices. However, in 2016, revenue increased by 13.1% as the federal government began to focus more on the non-oil revenues (Table 8 below).
Table-8. Breakdown of revenue with the changes for years 2014, 2015, 2016
| Revenues | 2014 | 2015 | 2016 | % change (2014/2015) | % change (2015/2016) |
| Oil Revenue (N' bn) | 2,110 | 1,644 | 820 | -22.09 | -50.12 |
| Corporate Income tax (N' bn) | 455 | 651 | 867 | 43.26 | 33.21 |
| Revenue from VAT Pool (N' bn) | 114 | 173 | 198 | 51.83 | 14.90 |
| Customs Duties (N' bn) | 353 | 324 | 326 | -8.20 | 0.76 |
| FG Independent Revenue (N' bn) | 452 | 450 | 1,504 | -0.45 | 234.17 |
| Other Revenue (N' bn) | 243 | 171 | 154 | -29.78 | -9.74 |
| Total Revenue (N' tn) | 3.73 | 3.413 | 3.87 | -8.5 | 13.1 |
Source: Author’s Compilation
5.2.1. Oil Revenue
Oil has been the main source of revenue for Nigeria’s Federal Government in the past. In 2016, it accounted for N820bn of the country’s total revenue. However, the proportion of oil revenue has been reducing because of declining of oil prices (Figure 9); the FG’s projected revenue from the oil sector as contained in the 2015 and 2014 budgets was respectively N1.64tn and N2.11tn. Therefore, the government plans to reduce over-reliance on oil revenue and reduce the country’s exposure to oil price volatility (Figure 10). In table 7 above, the proposed oil price benchmark for 2016 was $38 per barrel with a daily production of 2.2 million barrels per day. Both indices are lower than budgets of two last years. With the crude price declining, budget deficit is raising; 2014 deficit N0.91bn, 2015 deficit N1.04tn and 2016 deficit N2.22tn.
5.2.2. Non-Oil Revenue
By non-oil revenue, we refer mainly to tax revenue1 , Customs & Excise Duties, Federation levies and FGN independent revenue. Those revenues are estimated at N2.9tn which is about 75% of budgeted revenue of N3.87tn for 2016 (Figure 11). Compared to 2015 and 2014 budgeted years, this percentage was respectively about 47% and 37%. Thus, while oil revenue is expected to decrease by 50%, non-oil revenue was projected to increase by more than 70% from 2015 (Figure 8).
5.2.2.1. Tax Revenue
The Federal Government focuses on enhancing tax collection for increased revenue. The raise will come mainly from company income tax and VAT expected to increase respectively by 33.21% and 14.9% from 2015 to 2016 (Table 8 above). Therefore, corporate tax collection is expected to grow to N2.23tn in 2018 thanks to intensified efforts undertaken by the FIRS2 (PWC, 2016). These efforts include collaborating with some financial institutions and the corporate affairs commission on tax collection and identifying non-compliant taxpayers. According to the 2016 year budget, VAT was expected to remain 5%, one of the lowest in the world. However, VAT collection is expected to increase due to more enforcement of compliance.
5.2.2.2. Federal Government Independent Revenue
Federal Government Independent Revenue is the “operating surplus” that comes from ministries, departments and agencies (“MDAs”) and that is remitted to the Treasury. Focusing on Nigeria Customs Service, Nigerian National Petroleum Corporation and Nigeria Port Authority, the amount of 2016 FG Independent Revenue increased by more than a trillion. This performance happened with the full implementation of the Treasury Single Account (TSA) system that is considered as the best opportunity to streamline fiscal remittances (PWC, 2016).
5.3. Fiscal Balance (Deficit)
Budget deficit is when expenditure is greater than revenue while surplus is when revenue is greater than expenditure. According to the Central Bank of Nigeria (CBN), in the last 34 years Nigeria has managed to post only two years of fiscal surpluses (1995 and 1996). In 1997, Nigeria began its longest uninterrupted stretch of deficit spending. In 2016 a high record of deficits (N2.22tr) was reached (Budgit, 2016). This represented 2.16% of Nigeria’s GDP or 36.6% of the government spending in 2016. The huge increase surpassed 106% (Table 3) from 2015 was essentially due to the rise of the country’s overall debt profile estimated at approximately N1.4tr. The annually adopted fiscal expansionary policy partly explains the increased deficit.
6. CONCLUSIONS AND RECOMMENDATIONS
Nigeria’s budget system is consists mainly of single year budget perspective which does not display the out years. The multiyear budget perspective is important for government funds management and it provides the best mechanism tool for controlling the expenditure of the government. On the other hand, for the budget process to rely on the single year budget would simply lead to frequent changes in ceilings and appropriations. In addition to that, the new budget format does not include performance information of the previous budget and it does not appear to be primarily related to workload or activities of the whole government.
7. RECOMMENDATIONS
- Engage with relevant budget offices and apply the principles of budgeting, especially “forecasting” in the budget preparation process for delivery of appropriate baseline forecast.
- Borrowing should not be used for recurrent expenditure as compared with capital expenditure, and with respect to fiscal sustainability. Therefore, the government should reduce the size of recurrent expenditure, by reducing the size of government. Hence, debt funds should be used for capital and other investment expenditures, which will help boost economic growth, create jobs and generate revenues from taxation.
- Diversify sources of revenue by placing more emphasis on non-oil revenues in attempting to reduce budget deficit to reduce disparity existing between revenues and expenditure for minimal borrowing and debt serving expenditures.
- Strike a balance between economic policy and political courage that will minimize debt financing and deficits, and stabilize the economy.
- Preparing expenditure ceilings, to ensure the sound budget implementation process, the FGN should take into consideration the issue of expenditure ceilings.
- Link between policy and budget; The Nigeria’s budget process should consider the existing national policies and taking them into account as the main instrument for making these policies explicit.
- Establishment of fiscal targets and indicators; the formation of clear fiscal targets provides a framework for budget formulation and this will help to retain the trustful of the public to their government.
| Funding: This study received no specific financial support. |
| Competing Interests: The authors declare that they have no competing interests. |
| Contributors/Acknowledgement: All authors contributed equally to the conception and design of the study. |
REFERENCES
Adedipe, B., 2015. Overview of the 2015 Budget: Explanation and Analysis of Fiscal Policy, Components and Numbers. Retrieved from http://icanig.org/ican/documents/paper1.pdf .
Adedoyin, F.F., 2016. Government bailout of distressed states in Nigeria: An analysis of the 2015 fiscal crisis. Unpublished M.Sc. Dissertation University of Ibadan, Nigeria.
Ben-Caleb, E., K.S. Adeyemi and F. Iyoha, 2014. The impact of budget reforms on the quality of budget management in Nigeria. Journal of Accounting and Auditing, 2014: 1. View at Google Scholar | View at Publisher
Budgit, 2016. Unboxing federal government of Nigeria 2016 budget. Retrieved from www.yourbudgit.com .
Chukwuemeka, E.P., 2012. An analysis of the federal budgeting process in Nigeria: Implications for institutional reforms for achieving timeliness.
Pricewaterhouse Coopers Limited, 2016. Nigeria’s 2015 budget. Fiscal and Macroeconomic Analyses. Retrieved from www.pwc.com./ng .
Shamsuddeen, U., 2010. Validation Workshop on the First Four Year Implementation Plan for NV20:2020. Eko Hotel and Suites 5th August, 2010. Minister of National Planning.
Ugbede, O., L. Mohd and K. Ahmad, 2016. Government expenditure and the economy: The Nigeria perspective. Archives of Current Research International, 4(1): 1-12.View at Google Scholar | View at Publisher
Footnote:
4. According to Nana Fatima Mede (Mrs.), the Permanent Secretary, Ministry Of Budget And National Planning, Federal Republic of Nigeria As at December 2015, 391 MDAs with a total employee enrolment of 288,858 were captured on the IPPIS Platform. This achievement generated an aggregate savings of N220.8 billion (USD1.12 Billion) from inception of the scheme.