


NUMERICAL INVESTIGATION ON THE NON-LINEAR RESPONSE OF REINFORCED CONCRETE (RC) COLUMNS SUBJECTED TO EXTREME DYNAMIC LOADS

1,2,5,6Department of Civil & Structural Engineering, Universiti Kebangsaan Malaysia
3Department of Architecture, Universiti Kebangsaan Malaysia, UKM Bangi, Selangor, Malaysia.
4Department of Architecture, Azad University of Mahshahr, Iran
ABSTRACT
Reinforced concrete (RC) is the most widely used construction system in construction. The non-linear response of concrete when subjected to extreme dynamic loads such as blast is an important consideration for analysis and design of structures members. In this paper numerical modeling of RC column under blast load is presented using LS DYNA explicit dynamics software package. The accuracy of the model to simulate RC column responses to blast loads is verified by comparing the numerical simulation results with the test results available in the literature. A parametric study was chosen to investigate the effects of charge weight and stand-off distance on the dynamic behavior of RC column. The results of the numerical study show that the charge weight and standoff distance has a significant effect on the behavior of RC columns under explosion loading.
© 2017 AESS Publications. All Rights Reserved.
Keywords: Non-linear response, Reinforced concrete (RC) column, Explosion load, LS-DYNA, Charge weight, Stand-off distance.
Article History: Received: 25April 2017, Revised: 23May 2017, Accepted: 25May 2017, Published: 30May 2017
Contribution/ Originality: The main contribution of this research is a better understanding of the dynamic response of RC columns under various blast magnitudes.Blast loading and its effects on a structure are influenced by a number of factors including charge weight, location of the blast, geometrical configuration and orientation of the structure.
1. INTRODUCTION
RC structures are often subjected to severe impulsive loading conditions due to shock wave, blast wave and direct impact. Recent terrorist attacks and accidental explosions involving hazardous materials around the world have increased the need to study the behaviour of structures subjected to blast loading. Many impact and explosion incidents caused significant structural damages, which in turn generates huge amount of economic loss, and sometimes claimed many lives.
In response to threats from explosion and impact loads for human and infrastructure protection, the development of various impact and blast resistant design guidelines has recently become a priority of many governments worldwide[1-3]. Structures that suffer the effects of an explosion will react differently depending on the way the explosive is set up. When standoff distance from the detonation point is small and/or the charge weight is high, buildings suffer greater damage. Ngo explained that the bomb’s charge weight and the standoff distance are the two parameters that most directly influence the blast surroundings[4].
Many researchers [5-8] have done various works on the RC components subjected to blast and reported improved performances over conventionally designed RC components. Computer related study on behaviour of reinforced concrete members has evolved in recent years from analytical studies to numerical analysis.The development of hydrocodes to augment experimental testing has witnessed increased interest in recent years. In this study, intensive numerical simulations are carried out to calculate the dynamic response of RC column subjected to blast loads of different standoff distance and charge weight. The numerical models are verified by comparing the field test data obtained by Baylot and Bevins [9]. Parametric studies were performed to study the effects of charge weight and standoff distance on the dynamic behaviour of the RC columns, and the findings signify the contribution of charge weight and standoff distance on the behaviour and damage modes of columns under blast loading.
2. FINITE ELEMENT MODELING OF RC COLUMNS
The RC column used herein is the same as the one used in the verification section. The details of the column are shown in Figure 1. The concrete part of the column was modelled using solid elements. Both the longitudinal and transverse reinforcing steel bars were modelled using beam elements. The model builds with a uniform mesh of hexahedral elements with 8 nodes per element. The element formulation of the solid elements are constant stress solid element (ELFORM=1) and element formulation of the beam elements are Hughes-Liu with cross section integration. The mesh size of cells in the X, Y, and Z directions were 8.5 mm.
The 72Rel3 (MAT _CONCRETE_DAMAGE_REL3) concrete material model was used in modeling the behavior of the concrete columns[10, 11]. The 72Rel3 material model predicts the behavior of the concrete under blast loadings. The most significant user improvement by Release III is a model parameter generation capability, based solely on the unconfined compression strength of the concrete[12].
The Material_Piecewise_Linear_Plasticity (MAT 24) is used for the longitudinal reinforcing steel bars as well as the transverse bars used in the numerical models. MAT 24 is an elasto-plastic material for which an arbitrary stress-strain curve can be defined [13]. Up to eight plastic strains and corresponding yield stress points can be set to define realistic non-linear stress strain behavior. The material model can also define an arbitrary strain-rate. MAT 24 can be set to fail based on the plastic strain value or a minimum time-step size.
Figure-1.Details of RC column
Source: Baylot and Bevins [9]
In reinforced concrete, the concrete’s weakness in tension is compensated by using reinforcing bars. Effective bonding of the plain concrete and the reinforcing bars ensures transmission of the tensile forces from the concrete to the reinforcing bar. In this analysis, bond slip is accounted for using the contact function Contact 1D in LS-DYNA.
The footing and head are included in the numerical model to provide higher fidelity for the column constraints. Horizontal constrains (x- and y- direction) are implemented at the outer vertical face footing and head, and the bottom face of the footing is further constrained against vertical displacement (z-direction). Static axial load is applied on the head of the column to simulate static loadings of the column before the blast pressure is applied on the column surface facing the explosion center.
3. BLAST LOADING
The idealized triangular ramp pressure time history is utilized to simulate blast loading in the analysis as shown in Figure 2. The negative pulse is neglected. In this study, the blast loads are estimated according to formulae given inShi, et al. [14]. A group of blast loads with different peak pressure and impulse combinations are uniformly applied to the column front face. It should be noted that if the explosion center is very close to the column, the uniform blast loading distribution assumption is not valid [15, 16].
Figure-2.Simplified blast wave overpressure profile
Source: Shi, et al. [14]
4. STRAIN RATE
Strength, ductility and mass are important properties of materials used to create structural elements for resisting blast loads. However, additional material properties are required to describe the behaviour of structural components subjected to blast loading, rather than static loading.Material behaviour is significantly different under a rapid loading environment compared to static loading conditions. This is due to the materials inability to rapidly deform beyond the normal rate in static loading. This results in the stress level increasing at the yielding of the material. Consequently, a structural component, such as a beam or column, gains additional strength enhancement in excess of its static loading carrying capacity [17].This strength enhancement is represented by the “dynamic increased factor” (DIF) in the blast analysis and is discussed in terms of changing strain rate. When a structural element is subjected to blast loading, strain rates typically vary in the range of 102-104s-1. Figure 3 demonstrates strain rates variation for several loading conditions. The variation of the stress-strain relationship with strain rate is presented in Figure 4 for grade 40 concrete [4].
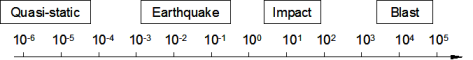
Figure-3. Strain rates for different loading conditions
Source:Malvar and Ross [18]
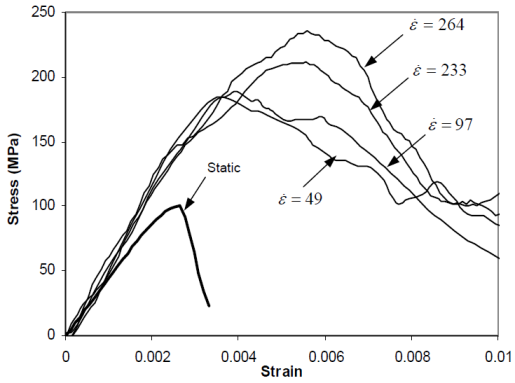
Figure-4. Stress-strain curves of grade 40 concrete at different strain rates
Source:Ngo, et al. [4]
4.1. Concrete Strain Rate
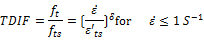
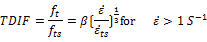
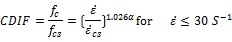
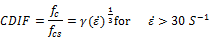
Dynamic increase factors for concrete were applied on the materials stress-strain curve to properly capture the dynamic effect onto the material behavior. The ability of concrete to increase in strength as the strain rate increases is sometimes referred to as the dynamic increase factor (DIF). The DIF is a function of the compressive or tensile strength at high strain rates versus the compressive or tensile strength of the concrete at static testing strain rates. In the current research, The dynamic increase factor for the tensile strength of concrete is presented by Malvar and Ross [18] that is presented as follows.
 (1)
(1)
 (2)
(2)
Where
ft = Dynamic tensile strength
fts = Static tensile strength
 (3)
(3)
 (4)
(4)
 Static uniaxial strength of concrete (in MPa)
 10 MPa
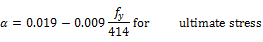
The dynamic increase factor(DIF) for compression is typically determined by CEBMalvar [19] as follows:
 (5)
(5)
 (6)
(6)
Where
 Dynamic compressive strength
 Static compressive strength
 Static cube strength
 (7)
(7)
 (8)
(8)
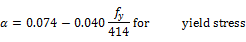
4.2 Steel Strain Rate
Similar to concrete, reinforcing steel experiences an increase in material properties due to dynamic loading. The enhancement factor for steel material is demonstrated by Malvar [19]that represented by below equation.
 (9)
(9)
Where
 Steel yield strength
 (10)
(10)
 (11)
(11)
5. VERIFICATION OF NUMERICAL MODELS
The numerical analyses presented in this study, was validated with results from an experimental work conducted by Baylot and Bevins [9]. Baylot and Bevins conducted an investigation on a quarter scale RC two storey framed building structure subjected to near field blast loads [9]. The tested RC column dimensions are 85×85 mm cross section and 935 mm height. The longitudinal reinforcements and the cross-tie reinforcements are 7.1 mm and 3.85 mm respectively. The peak pressure and impulse of the blast load are 7000 kPa and 1100 kPa.ms as measured in the test. Table 1 gives the material properties of the concrete and steel reinforcement of the scaled column. Figure 5 shows the comparison of the calculated and measured deflection time histories at the middle height of the column. As shown, the results obtained in the present analysis are very close to the measured deflection time history. The predicted residual deflection in the present analysis also agrees well with the measured residual deflection in the test.
Table-1.Material properties of concrete and steel reinforcement
| Material | Material Properties | Value |
| Concrete | Unconfined compressive strength (MPa) | 42 MPa |
| Main reinforcement | Yield stress | 450 MPa |
| Ultimate stress | 510 MPa | |
| Fracture strain | 18% | |
| Tie bars | Yield stress | 400 MPa |
| Ultimate stress | 610 MPa | |
| Fracture strain | 18% |
Source:Baylot and Bevins [9]
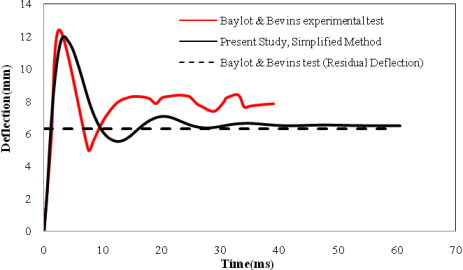
Figure-5. Mid-height deflection time history
Source: Baylot and Bevins [9]
6. RESULT AND DISCUSSION
The numerical analysis was conducted to investigate the influence of stand-off distance and charge weight to dynamic response of RC column under blast load. The amplitudes and distributions of blast loads on a structure’s surface are governed by factors including explosive charge characteristics (e.g. weight and type) and standoff distance between explosive and structure. The parameters influencing in blast are dependent on the value of energy released by the detonation in the form of a blast wave and the distance from the explosion. All these factors need to be accounted as they have contributed significantly to the structural response. The relationship between the scaled distance, z, stand-off distance, R, and the charge mass, W, is given by equation 12[20, 21].
 (12)
(12)
Where R is the actual effective distance from the explosion and W is the charge weight as an equivalent mass of TNT. Using equation (12), the ranges for scaled distance values for the same charge mass and different standoff distance are presented in Tables 2 and the ranges for scaled distance values for the same standoff distance and different charge weight are presented in Table 3.
Table-2.Scaled distance values at 20000 g charge weight and different standoff distance
| Charge weight(g) | Standoff distance(mm) | Scaled distance(mm/g1/3) |
| 3500 | 128.9 | |
| 20000 | 6000 | 221 |
| 9000 | 331.5 |
Table-3.Scaled distance values at 2000mm standoff distance and different charge weight
| Standoff distance(mm) | Charge weight(g) | Scaled distance(mm/g1/3) |
| 1500 | 174.7 | |
| 2000 | 3500 | 131.7 |
| 5500 | 113.3 |
Figure 6 show the maximum displacement plots at the center node of the RC column under different standoff distance and same charge weight and Figure 7 show the maximum displacement plots at the center node of the RC column under different charge weight and same standoff distance. According to Figure 6, as the standoff distance increased to 6000mm and then to 9000mm, significant decrease in lateral displacement is observed for all column types. It’s observed that when the RC columns are under lower standoff distance, the columns undergo the most severe damage and the RC columns fails due to high impulsive loading. However, when the columns are subjected to bigger standoff distance, the response of the RC columnsis different. The results show that for an equivalent standoff distance of 2000mm, a decrease in the scaled distance of the explosion results in an increase in the mid-point displacement.
As the charge weight increased to 3500g and then to 5500g, significant increase in lateral displacement was observed for all column types as shown in the figure 5. The results show that when the RC columns are under lower charge weight, the columns undergo the most severe damage and the RC columns fails due to high impulsive loading. It was observed that for an equivalent charge weight of 20000g, an increase in the scaled distance of the explosion results in a decrease in the mid-point displacement.
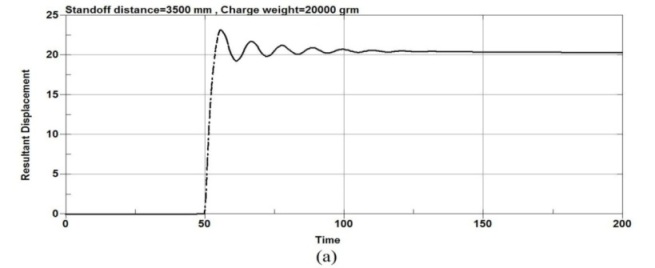
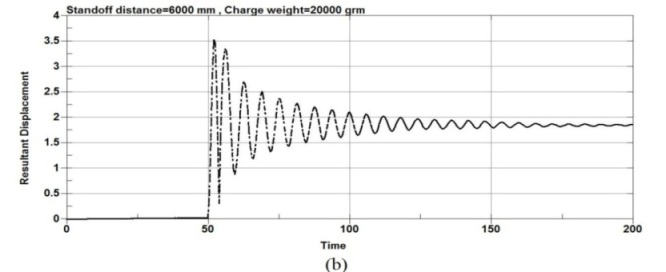
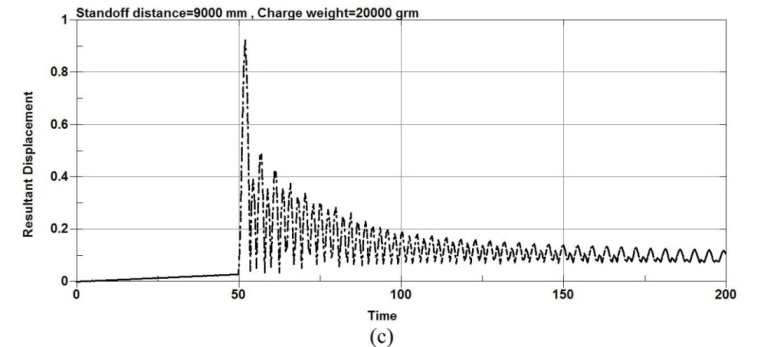
Figure-6.Maximum displacement plots at the center node of the RC column under different standoff distance and same charge weight
Figure-7. Maximum displacement plots at the center node of the RC columns under different charge weight and same standoff distance
Figure 8 shows the effective plastic strain variation of the concrete in the numerical model at different stages of time following the blast. The colours in Figure 8 denote the fringe level which represents the level of damage in the concrete. In Figure 8 the blue colour represents a fringe level 0 (zero) which indicates linear elastic state of the concrete while the other colours and the associated fringe levels represent different damage levels of the concrete. Fringe levels vary from 0 to 2 where level 2 indicates maximum plastic yielding of concrete.
Figure-8. Strain variation of the column with time after the explosion
Figures 9, 10 show the energy plots values when the RC columns are subjected to explosion load. The Figure 9 shows the energy plots values at the center node of the RC columns under different charge weight and same stand-off distance and figure 10 shows the energy plots values at the center node of the RC column under different stand-off distance and same charge weight. According to figure 9,as the charge weight is increased to 3500g and then to 5500g, significant increase in total energy is observed for all columns types. Also the results show that when the standoff distance increased, the total energy is decreased with the same charge weight as shown in the figure 10.The results show that for an equivalent standoff distance of 2000mm, a decrease in the scaled distance of the explosion results an increase in the total energy however for an equivalent charge weight of 20000g, an increase in the scaled distance of the explosion results a decrease in the total energy.
Figure-9.Energy plots values of the RC column under different charge weight and same standoff distance
Figure-10.Energy plots values of the RC column under different standoff distance and same charge weight
7. CONCLUSION
This paper presented the numerical analysis of the response of a RC column that was subjected to different charge weight and standoff distances. The analysis was performed using LS-DYNA non-linear explicit FE code. The accuracy of the numerical models was verified using the findings of experimental data obtained by other researchers. The verified models were then used to simulate behaviour of RC column to blast loads. The results of this study show that the charge weight and standoff distance are a critical parameter that should be taken into account when analysing the behaviour of RC columns under blast effects.
| Funding: The authors would like to thank Universiti Kebangsaan Malaysia for financial support under grant ERGS-1-2013-PK04-UKM-02-1and FRGS-1-2015-TK01-UKM-02-4. |
| Competing Interests: The authors declare that they have no competing interests. |
| Contributors/Acknowledgement: All authors contributed equally to the conception and design of the study. |
REFERENCES
[1] UFC-3-340-02, Design of structures to resist the effects of accidental explosions," Ed. US army corps of engineers, naval facilities engineering command. Washington DC: Air Force Civil Engineer Support Agency, Dept of the Army and Defense Special Weapons Agency, 2008.
[2] E. E. Hinman, C. Rojahn, R. Smilowitz, D. Campi, R. J. Myers, N. Sauer, and P. A. Mork, "Primer for design of commercial buildings to mitigate terrorist attacks: providing protection to people and buildings," 2003.
[3] M. Chipley, W. Lyon, R. Smilowitz, P. Williams, C. Arnold, W. Blewett, L. Hazen, and F. Krimgold, "Primer to Design Safe School Projects in Case of Terrorist Attacks and School Shootings. Buildings and Infrastructure Protection Series. FEMA-428," US Department of Homeland Security, vol. 2, p. 317, 2012.View at Google Scholar
[4] T. Ngo, P. Mendis, A. Gupta, and J. Ramsay, "Blast loading and blast effects on structures - an overview," Electronic Journal of Structural Engineering, vol. 7, pp. 76-91, 2007.View at Google Scholar
[5] A. A. Mutalib and H. Hao, "The effect of anchorages on FRP strengthening of RC walls to resist blast loads," Applied Mechanics and Materials, pp. 497-502, 2011.
[6] G. Aráoz and B. Luccioni, "Modeling concrete like materials under sever dynamic pressures," International Journal of Impact Engineering, vol. 76, pp. 139-154, 2015.View at Google Scholar |View at Publisher
[7] A. A. Mutalib and H. Hao, "Numerical analysis of FRP-composite-strengthened RC panels with anchorages against blast loads," Journal of Performance of Constructed Facilities, vol. 25, pp. 360-372, 2010.View at Google Scholar | View at Publisher
[8] S. Astarlioglu and T. Krauthammer, "Response of normal-strength and ultra-high-performance fiber-reinforced concrete columns to idealized blast loads," Engineering Structures, vol. 61, pp. 1-12, 2014.View at Google Scholar | View at Publisher
[9] J. T. Baylot and T. L. Bevins, "Effect of responding and failing structural components on the airblast pressures and loads on and inside of the structure," Computers & Structures, vol. 85, pp. 891-910, 2007.View at Google Scholar | View at Publisher
[10] H. M. I. Thilakarathna, D. Thambiratnam, M. Dhanasekar, and N. Perera, "Numerical simulation of axially loaded concrete columns under transverse impact and vulnerability assessment," International Journal of Impact Engineering, vol. 37, pp. 1100-1112, 2010.View at Google Scholar | View at Publisher
[11] X. Bao and B. Li, "Residual strength of blast damaged reinforced concrete columns," International Journal of Impact Engineering, vol. 37, pp. 295-308, 2010.View at Google Scholar | View at Publisher
[12] LS-DYNA, "Keyword User's Manual V971,CA: Livermore Software Technology Corporation(LSTC),Livermore, California," ed, 2015, p. 1953.
[13] LS-DYNA, Keyword user's manual V971, CA. Livermore, California: Livermore Software Technology Corporation(LSTC), 2015.
[14] Y. Shi, H. Hao, and Z. X. Li, "Numerical simulation of blast wave interaction with structure columns," Shock Waves, vol. 17, pp. 113-133, 2007.View at Google Scholar | View at Publisher
[15] A. A. Mutalib and H. Hao, "Development of P-I diagrams for FRP strengthened RC columns," International Journal of Impact Engineering, vol. 38, pp. 290-304, 2011.View at Google Scholar | View at Publisher
[16] Y. Shi, H. Hao, and Z. X. Li, "Numerical derivation of pressure–impulse diagrams for prediction of RC column damage to blast loads," International Journal of Impact Engineering, vol. 35, pp. 1213-1227, 2008.View at Google Scholar | View at Publisher
[17] D. Grote, S. Park, and M. Zhou, "Dynamic behavior of concrete at high strain rates and pressures: I. Experimental characterization," International Journal of Impact Engineering, vol. 25, pp. 869-886, 2001.View at Google Scholar | View at Publisher
[18] L. Malvar and C. Ross, "Review of strain rate effects for concrete in tension," American Concrete Institute Materials Journal, vol. 95, pp. 735-739, 1998.View at Google Scholar | View at Publisher
[19] L. Malvar, "Review of static and dynamic properties of steel reinforcing bars," American Concrete Institute Materials Journal, vol. 95, pp. 609-616, 1998.View at Google Scholar | View at Publisher
[20] M. A. Sadovskyi, Mechanical effects of air shock waves from explosions according to experiments. Moskau: Izd Akad Nauk SSSR, 1952.
[21] T. Krauthammer, Blast Effects and Related Threats. Penn State University, 1999.
| Views and opinions expressed in this article are the views and opinions of the author(s), Journal of Asian Scientific Research shall not be responsible or answerable for any loss, damage or liability etc. caused in relation to/arising out of the use of the content. |