


FACTORS AFFECTING ACADEMIC PERFORMANCE OF UNDERGRADUATE STUDENTS AT NAJRAN PREPARATORY YEAR FOR GIRLS- NAJRAN UNIVERSITY 2015-2016

1,2Najran University, Saudi Arabia
ABSTRACT
The objectives of the study are to investigate factors that affect academic performance of undergraduate students at Najran Preparatory Year for Girls. It will also examine the effect of students’ admission points, previous school background, residence outside Najran city, transportation problems, educational factors, change of instructional language from Arabic to English, academic qualifications, and Faculty members' skills on academic performance. The participants of the study consist of currently enrolled students at Najran University Preparatory Year for Girls in two semesters; To analyze the data, a number of statistical methods have been used, namely, descriptive statistics, Chi square and linear regression analysis. The study found that the majority of students entering Preparatory Year have an excellent academic level. 72.6% of students scored 90+ percent in the Saudi Arabia Secondary school certificate examination. Their performance however, tends to drop when they take their first exam at PYP where 43% of them obtain GPA (4-5) and 17.3 % of them fail. The educational level of their parents is still low. Student's educational background is very good from their secondary schools results. However, they suffer from the change of instructional language from Arabic to English. They also complain that it has affected their academic level. The qualifications and skills of staff members in the Preparatory Year for Girls are excellent. There was a highly significant relationship between the GPA and the percentage of students entering the College, and a lengthy the length of experience of lecturers in teaching. However, there was an insignificant relationship between GPA and education of single or both the parents. And qualifications of staff (Master- PhD). The study recommends a radical revision and improvement of the English language curriculum by incorporating the inclusion of modern strategies and teaching methods for foreign language learning in secondary schools and Najran Preparatory Year for Girls and intensive use of instructional software and computers in girls’ schools.
© 2017 AESS Publications. All Rights Reserved.
Keywords: Academic performance, Admission points, School background, Instruction language and qualification of the faculty members. Cumulative grade point average (CGPA), Grade point average (GPA).Master's degree (Master), (A Doctor of Philosophy) Ph.D.
Received: 6 February 2016/ Revised: 5 April 2016/ Accepted: 6 June 2016/ Published: 3 August 2016
Contribution/Originality
This study contributes to the existing literature by adding a new amount of data on the subject, it will be accounted as one of very few studies which have investigated about these factors together, and also the study concluded the longest experience of lecturers is more important than the academic qualifications
1. INTRODUCTION
The Preparatory Year for girls is considered to be the first step for students to prepare for studies in medical, scientific and administrative disciplines. As the preparatory-year program bridges the secondary school certificate and university majors, due to students’ language constraints, not much is known about how students feel about the effect of such a program on their performance in higher mathematics and English courses, which are absolute necessity for science and engineering oriented Majors (Najran University, 2014).
AL-Mutairi (2010) mentioned that Cumulative Grade Point Average (CGPA), Grade Point Average (GPA) and their test result.) Most of the researchers around the world consider GPA to be an indicator of student performance, over the period of a particular semester or an academic program (Galiher, 2006) Some other researchers do the same through the result of particular subject or the previous year’s performance (Tho, 1994; Hake, 1998; Hijazi and Naqvi, 2006). English as a medium of instruction is accepted in all the educational institutions in the Middle East. This is much more so in the areas of sciences, medical, and engineering courses. However, the Arabic language remains the main language of instruction at the primary and secondary levels (Yushau et al., 2006). But, medical students face difficulties due to adoption of English language as a medium of instruction, wherein their schooling was mostly in Arabic. The use of English has a negative impact on their grades in all courses, and students’ grades suffer a downfall as a result. (p< 0.05) (Al-Mously et al., 2013). According to the current discussions of Lubinski and Camilla (2006) the school background of students has a bearing on their academic performance in the Preparatory Year Girls courses. Though there is research that demonstrate contradicting results or findings. Some research shows that private school students score lower than public school students. However, other research has an opposing view with regard to the diversity of student’s backgrounds. Numerous important studies have been carried out on the factors that affects students’ academic performance or achievements in different stages of their academic life. Some of the factors identified and reported to have affected the academic performance of students in these different settings are: students’ efforts, previous or prior educational performances, self-motivation, socio-economic status of the students’ parents, the students’ age, number of hours of study per day, admission points, different entry qualifications, tuition trends and the students’ area of residence (rural or urban) (Farooq et al., 2011).
2. RESEARCH QUESTIONS
- What is the relationship between students’ admission points and academic performance?
- Is there any relationship between students’ former school background and academic performance?
- What is the effect of students' residence outside Najran city, transportation problems and educational factors on academic performance?
- Is there any significant effect of change of instruction language from Arabic to English on the academic performance?
- How can the academic qualifications and the Faculty members' skills affect the academic performance?
3. RESEARCH OBJECTIVES
3.1. Main Objective
To investigate on factors that affect academic performance of Undergraduate Students at Najran Preparatory Year of Girls.
3.2. Sub Objectives
1. To establish the relationship between students’ admission points and academic performance.
2. To determine the relationship between students’ former school background and academic performance
3. To examine the effect of students' residence outside Najran city, transportation problems and educational factors on academic performance.
4. To test the significance of the effect of change of instruction language from Arabic to English on the academic performance.
5. To evaluate whether the academic qualification and the Faculty members' skills affect the academic performance or not.
4. LITERATURE REVIEWS
4.1. Background of Najran University and Preparatory Year Girls
Najran University: The directions of the High patronage of the Custodian of the Two Holy Mosques King Abdullah bin Abdul Aziz - may Allah (swt) have mercy on him - established Najran University in 10/10/1427 AH. The University is located on the eastern extension of Najran with an area of $ 18 million square meters, and thus, is the largest university city in Saudi Arabia in terms of space, and will include a compound for students containing 14 (fourteen) Colleges which will accommodate 45 thousand students (Najran University, 2014).
The preparatory year program at University of Najran is a two-semester program. However, students are given a maximum of three semesters to complete the program. The final grades earned by the students in this program are not considered in the overall calculation of the students’ cumulative grade point average (CGPA) for the undergraduate program. Nevertheless, the grades are recorded in the students’ transcript together with the semester grade point average (GPA) and CGPA. More importantly, a student’s performance on the preparatory year program is largely considered as an indicator of her success in the undergraduate program (Najran University, 2014).
Although Najran University is a scientific and technologically oriented university, students do not qualify to study medicine, engineering or computer science automatically even after ‘successfully’ completing the preparatory-year program. For a student to go for any academic program of her choice, she has to meet some minimum entry requirements based on her achievements in the preparatory-year mathematics and English courses (Najran University, 2014). Schools, colleges and universities have no utility without students. They are the most essential assets for any educational institution. The social and economic development of the country is directly linked with students’ academic performance. The performance of students indicates the strength of future workforce of the country (Ali et al., 2009). A lot of researchers focused their studies on students’ academic performance and its impact on society. It is a challenging aspect of academic literature, and science (Irfan and Shabana, 2012).
4.2. The Performance Evaluation
Muhammad et al. (2011) mentioned that in recent years, most of the universities in Pakistan use the CGPA system to evaluate the performance of students. The CGPA shows the average of overall grades students achieve in all the semesters in the university. Many universities in the world are using the same criteria for evaluating the academic performance of students. Also in Malaysia and USA, teachers evaluate the academic performance of students in the same way (Agus and Makhbul, 2002).
King Saud University (KSU) considers a grade point average (GPA) of ≥3.5 /5 for admission into the College of Medicine by the end of the premedical year. This study was undertaken to ascertain whether pre-selected medical students who achieve a relatively low GPA (≤3.75/5) in the premedical year are at risk of having academic difficulties in subsequent years. During the study period, 739 students were admitted to the college. Of these, 619 (84%) were in High GPA group, and 120 (16%) in the Low GPA group. Of the students with High GPA, 545 (88%) out of 619 graduated compared with 79 (66%) of 120 in the Low GPA group (OR 3.822 [95% CI: 2.44, 5.99]: P<0.0001). Overall, 28 students (3.8%) dropped out, but there was a significantly greater frequency of dropping out in the Low GPA group (10/120; 8.3%) compared with the High GPA group (18/619; 2.9%: OR 3.035 [95% CI: 1.37, 6.75], P < 0.01 (Yushau et al., 2006). The findings support the prerequisite of a minimum GPA in the premedical year before proceeding to the higher levels. The GPA of premedical year is a useful indicator of students who need close monitoring and academic support. Students’ achievement in the premedical year helps them to do better in subsequent studies in medical discipline at a later stage (Abdulrahman and Al-Mazrou, 2008).
4.3. Student's Admission Factors
In a study, done by Kyoshaba (2009) Admission factors and the different entry qualifications, which are the results of previous academic performance, are likely to affect the students’ future academic success. The schooling students receive plays a vital role in their future academic success. A solid foundation helps them acquire useful learning skills which come in good use when they enter university. The findings of Considine and Zappala (2002) directly support the above mentioned statement. Miller and Birch (2007) came up with similar results in this regard. Ali et al. (2013) and Kwesiga (2002) also concluded that the learning outcomes and educational performance of students are strongly affected by the type of educational institution where they received their education. The kinds of facilities schools provide for their students directly influence the quality of studies and overall grooming of students.
4.4. The Entry Qualification
The quality and success of graduates often define the worth and adequacy of the university curricula. A well-defined program for undergraduate students can bring about dramatic change for the participants and launch them successfully to a brighter career.
In order for students to approach and successfully complete a graduate study, they require to have completed adequate academic groundwork and the right attitude towards continuing their studies (Lydiah and Adenike, 2013).
A number of studies have been carried out to identify and analyze the numerous factors that affect academic performance. Ali (1983) identified student factors (attitude, individual differences, physical health and readiness and expectations); home environment, cultural and parental factors; and institutional factors which include school type , population, discipline, personnel interactions, admission and examination or evaluation policies. Flowers (1966) identified teacher/instructional/curriculum factors (teacher attitude to students, ways of classroom control, curriculum content, teacher adequacy in professional qualification and preparation, instructional contents and presentation, use of relevant teaching aids (Lydiah and Adenike, 2013).
4.5. Educational Factors
Different studies and research have also shown that there is a significant relationship between the parent’s education and student’s performance (Ermisch and Francesconi, 2001). Parents’ education is directly related to the students’ academic success (Durden and Ellis, 1995). Agus and Makhbul (2002) observed in their study that mothers exert more influence on the academic success of their children. Thus, students' performance in intermediate examination is positively associated with mothers’ education (Hijazi and Naqvi, 2006).
It has been found from the study conducted by Washburne (1959) that students who live in urban settings do better in schools than those who live outside the city. The reasons for so could lie in the fact that in urban settings, students perform more in curricular and cocurricular activities than those in the rural areas. Karemera (2003) found that students' performance is significantly correlated with the institution’s quality of library, computer lab etc. With regard to background variables, he found a positive effect of high school performance on future achievements (Harb and El-Shaarwi, 2006). Roberts and Sampson (2011) found that the members of educational board be educated as their impact on school activities is important and game changing. It is also essential for professional development and learning environment. The students who are actively engaged in the learning process are observed to have a positive correlation with the CGP. A studious effort and the proper use of the facilities provided by the institution, effective learning styles, all positively affect the student's performance (Ali et al., 2009)
Young and Patty (1999) held the view that students performance is also dependent on the quality of libraries and the educational level of their parents. They have access to better learning contents in libraries, and their parents could take direct interest in the affairs of their studies (Barkley, 2006)
4.6. Staff Qualifications
The teacher plays a pivotal role in improving students’ performance in the classroom. Doyle (1985) observed from his study that creative and innovative methods of instruction in class yield much better results for teachers and students than use of traditional lecture based instructions. The size of family also contributes towards overall success and achievement of students, as witnessed in the quantity quality model (Becker, 1960; Becker and Lewis, 1973; Becker and Tomes, 1979). This model has shown that students from a large family tend to achieve less than others, especially so in academic arena (Rosenzweig and Wolpin, 1980; Hanushek, 1992).
5. RESEARCH METHODOLOGY
5.1. Material and Methods
1. Study population: The study consists of currently enrolled Students at Najran Preparatory Year for Girls - Najran University.
2. Study sample: Students at the Preparatory Year for Girls - Najran University.
The population of the study contains students in two semester, 44 (26% of the population) students in the first Semester and 124 (74% of the population) students in the second Semester.
Table-1. The population of the study
| Semester | Number of student | Percent % |
| First Semester | 44 | 26 |
| Second Semester | 124 | 74 |
| Total | 168 | 100 |
Source: Preparatory Year Girls - Najran University. 1435-1436H
5.2. Method of Data Collection
A questionnaire is designed as a tool of data collection to gather the information regarding the objectives listed above in Six sections:
Section One: Basic data about Students.
Section Two: The effects of student’s former school background on their academic performance.
Section Three: The effects of residence outside Najran city, transportation problems and educational factors on academic performances of students.
Section Four: Academic problems of students.
Section Five: The effects of change of instruction language from Arabic to English on Students’ academic performance.
Section Six: The effects of academic qualification and skills of Faculty members on students’ academic performance.
5.3. Methods of Data Analysis
1. Descriptive statistics will be used to summarize the findings.
2. Chi square Test for testing and analyzing relationship suggested above.
Pearson's chi-square test, also known as the chi-square goodness-of-fit test or chi-square test for independence. Chi-square is a statistical test commonly used to compare observed data with data we would expect to obtain according to a specific hypothesis. The chi-square test is always testing what scientist's call, the null hypothesis, which states that there is no significant difference between the expected and observed result.
Where:
x2= Pearson's cumulative test statistic, which asymptotically approaches a x 2distribution.
Oi= The number of observations of type i.
El= NPlNPI = the expected (theoretical) frequency of type i, asserted by the null hypothesis that the fraction of type i in the population is 
n= the number of cells in the table
3. Linear regression analysis for testing and analyzing relationship suggested above. In statistical modeling, regression analysis is a statistical process for estimating the relationships among variables. It includes many techniques for modeling and analyzing several variables, when the focus is on the relationship between a dependent variable and one or more independent variables (or 'predictors').
For example, in simple linear regression for modeling n data points, there is one independent variable: XI, and two parameters, B0 and B1:
Y = B0 + B1 XI
In the more general multiple regression model, there are p independent variables:
Y = B0 + BI XiI ++ BI Xi2+....++ Bp Xip
4. Statistical package for social sciences (SPSS) will be used to analyze the statistical work.
6. ANALYSIS OF DATA
6.1. Results
6.1.1. The Performance Evaluation
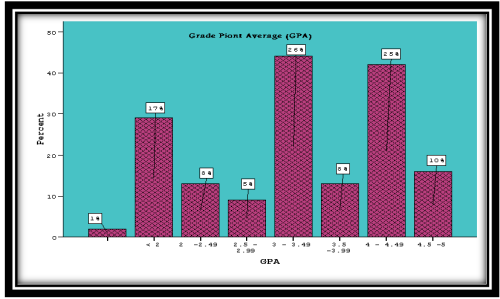
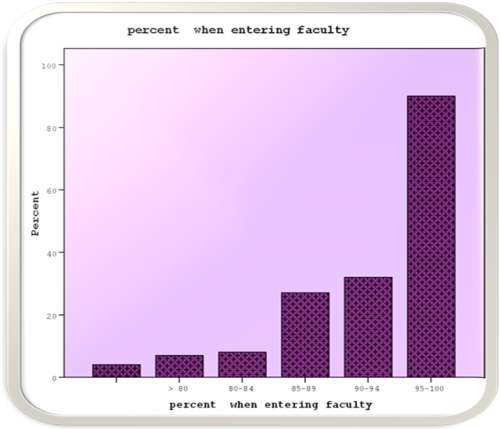
As shown in table(2) the majority of students entering Preparatory Year have a high percentage score in the Saudi Arabia Secondary school certificate examination., Approximately half of them ( 53.6 %) get 95-100 percent grades and 19 percent of them get 90-94 percent, while only 4.2 percent of them get less than 80 percent. Given this high percentage, the observations on student performance were found to be fluctuating. Students who had a GPA of (4 - 4.49) and (3 - 3.49) represented 25-26.2 %, whereas students obtaining 4.5 -5 grades were only 9.5%. The students who had less than GPA 2 represent (17.3 %). 79.2 percent of the students did not receive an academic warning during the semester while studying in the college, also 79.2 percent of them did not fail in one or more courses during their study, 92.9% did not receive an academic warning during the semester while studying in the college which indicates a good performance.
A high significant relationship is detected between percentiles when entering Faculty which is denoted by (x) and GPA which is denoted by (y) in the regression model, with (p=0.000). As shown in table (4)
I.e. the change in the (percent when entering Faculty) by 7.1 percent let the students (GPA) change by one unit
Y= -3.341+0.071 x
Table-2. Percent when Entering Faculty Grade Point Average GPA of Preparatory Year of Girls.
| Percent when Entering Faculty | Frequency | Percent | GPA | Frequency | Percent |
| > 80 | 7 | 4.2 | < 2 | 29 | 17.3 |
| 80-84 | 8 | 4.8 | 2 -2.49 | 13 | 7.7 |
| 85-89 | 27 | 16.1 | 2.5 - 2.99 | 9 | 5.4 |
| 90-94 | 32 | 19.0 | 3 - 3.49 | 44 | 26.2 |
| 95-100 | 90 | 53.6 | 3.5 -3.99 | 13 | 7.7 |
| Missing value | 4 | 2.4 | 4 - 4.49 | 42 | 25.0 |
| Total | 168 | 100.0 | 4.5 -5 | 16 | 9.5 |
| Missing value | 2 | 1.2 | |||
| Total | 168 | 100.0 |
Source: Preparatory Year Girls - Najran University. 1435-1436H
6.1.2. The Entry Qualification
As shown in table (3) the level of education of the father is better than that of the mother., The percentage of literate fathers is (7.1%) whereas the literate mothers represent (26.8%), also the differences appear clearly at university level education of fathers (28.6%) compared to the university level education of mothers (17%).The majority of these students studied in government schools before entering university (95%). An insignificant relationship was found between GPA (y) and education of father(x1) and of mother (x2) with (P = 0.319).As appear in table (5).
Y= 3.154+0.085 x1 - 0.42 x2
6.1.3. Student’s Admission Criteria
Students’ were asked about their educational background. A highest percentage of students responded "yes", and some responded "to some extent" respectively. The nature of the courses in the secondary schools was intensified (39.9%, 41.1% respectively), teachers in secondary school focused on teaching the courses (58.3%, 25% respectively), and teachers in secondary schools were strict in matters of exercises and homework (62.5%, 23.2% respectively as appear in table (3).
Due to different approach of instructions in class, students coming from secondary schools tend to face difficulty coping with lectures delivered in university classrooms (Yes: 56.5%, to some extent: 14.3% respectively). This instructional gap is evident in their subsequent academic performance (Yes: 56.5%, to some extent: 27.4% respectively). As shown in table (3).
Due to such differences of approach to teaching, the following issues arise: a relationship between nature of courses, different treatment of students in schools and universities, the issue of self-independence, requirement for students to attempt more tests and homework, differing social environment, and the fact that their performances will be judged by exams only (p=0.001, p=0.003, p=0.006, p=0.034, p=0.000, p=0.031 respectively). However, the instructional language difference between schools and universities plays an insignificant part on the overall academic achievement of students (p=0.178) as shown in table (6).
6.1.4. Residence and Transportation
Of the total student population, the majority comes from Najran (79.8%) and only (20.2%) comes from outside. Approximately half (51.2%, 55.4%, 53.6% respectively) of the students do not have issues regarding transportation, frequent absences from lectures and unavailability of drivers (11.9 %, 19%, 12.5% respectively). With regard to punctuality, students admit to having been affected a little by it. However, 44.0% complain that the long commuting affects their academic performance as appears in table (3). There was an insignificant relationship between GPA (y) and the area that students live in (x) with (p=0.199), this is obvious because the majority of students live in Najran and do not have residency and transportation problems. As appears in table (7).
Y= 3.539 - 0.239 x
A highly significant relationship between the effect of commuting long distances, and educational achievements was found. Other factors include: difficulty in getting ready for exams, always feeling tired, inability to do homework and exercises, inability to concentrate in classes, repeated absences from lectures (p=0.000, p=0.000, p=0.000, p=0.000, p=0.000, p=0.000 respectively). As appear in table (8).
6.1.5. Transformation of Instruction Language from Arabic to English
48.2 percent of the students reported their academic level was affected by using English as instructional language of teaching. About 23.2 % of them said it did not. As appears in table (3).
There is a highly significant relationship between: the use of English as an instructional language and the inability of the student to understand the lecturer during classes, difficulty in concentrating during classes where lecturers use only English in teaching, not following the lecturer is due to their deficiency in listening and speaking English. This also makes them unable to answer questions during the lecture (p=0.000, p=0.000, p=0.000, p=0.000, respectively). As shown in table (9).
6.1.6. Educational Factors
The educational problems that students face include: First: half of them (51.2%) do not like certain types of courses at all, with 25% not liking them to some extent. Secondly, they fail to study the courses employing proper and required study skills (40.5%). Thirdly, they are unable to retain and retrieve the skills associated with the subject learned, (40.5%) with (26.2%) responding so to be true to some extent. Also, more than half of the students were not absent from lectures (55.4%) with (19%) so, to some extent. Furthermore, they feel bored while studying the subject (52.4%) with (22%) reporting the same to some extent. In addition, they did not complete their homework and assignments (53%) with (19%) ending up so to some extent. Moreover, students failed to attend remedial classes (38.1%) that were offered for them. Finally, they dislike classes without breaks (48.8%) with (18.5%) opining so to some extent. As appear in table (3).
6.1.7. Staff Qualifications and Skills
The majority of students agree that the staff members’ qualifications and skills in the Preparatory Year Girls were excellent in many important ways: the lecturers supply students the syllabus plan at the beginning of the semester, explain the contents of the course in a clear way, behave firmly with the students during the classes, are always available in office during office hours, behave and deal in a fair way with all students, are very good in their area of specialization, carry out the course in a planned way, are always punctual and are not absent unless unforeseen circumstances force them to be so, use modern teaching methods in teaching, take into consideration the differing learning styles among students, are careful about students’ understanding of lectures & topics and respond to student's questions during the lectures.
(54.2%,53%,51.2%,61.9%,59.5%,55.4%,61.9%,61.3%,48.8%,44%,44.6%,60.1% respectively). As shown in table (10).
(37.5%) said that the lecturer of the course does not punish students. Also, (36.9%) said the lecturer of the course doesn’t task students with much homework and weekly duties. However, (35.1%) students said the lecturer was insensitive about the academic problems of students, and approximately equal percentage of students (32.7%) said it wasn’t so. As appear in table (3).
There is an insignificant (p=0.741) relationship between GPA (y) and qualifications of staff (Masters- PhD) and its effect on quality of teaching (x). As appear in table (11).
Y= 3.2+0.031 x
I.e. a change in the qualifications of staff by 3.1 percent let the students’ GPA change by one unit.
There is a significant (p=0.034) relationship between GPA (y) and long experience of lecturers in teaching and it has a positive effect on the performance of the lectures (x). As shown in table (12).
Y= 3.591 - 0.2 x
6.2. Discussion
1. Majority of the students admitted to the Preparatory Year have an excellent academic level (72.6%) about 90+ percent .But their performance tend to drop when they do their first evaluation in faculty where 43% of them get GPA (between 4-5) and 17.3 % of them fail.
2. The educational levels of their parents are still low, where, (64.3%) of their mothers and (44.6%) of their fathers are educated under secondary level and one of them is still literate or illiterate.
3. Students’ educational background is very good from their secondary schools. Majority of the students live in Najran and do not suffer from problems of residence and transportation.
4. Students suffer from shift of instructional language from Arabic to English and complain that this fact has affected their overall academic level.
5. The academic problems that the students face include dislike of certain types of courses, inability to study the courses applying proper learning mechanisms, memorization and rote feedback of the learned skills, boredom while studying the subject, and continuous classes without break time.
6. The qualifications and skills of staff members in the Preparatory Year Girls are excellent in many important ways. For example, the staff supply their students a clear syllables plan, explain the contents in simple terms, take care of students’ understanding of lectures and topics and respond to students’ questions during lectures.
7. There was a highly significant relationship between GPA and the student percentage when they admit in the Faculty. In addition, there was a significant relationship between GPA and long experience of lecturers in teaching, the fact which has a positive effect on the quality of lectures. However, there was an insignificant relationship between GPA and education of either father or of both the parents. Also, there was an insignificant relationship between GPA and qualifications of staff (Master- PhD).
8. A highly significant relationship between the different teaching methods in the secondary school and in preparatory year affected the academic level of students, the difference in behavioral methods, self- independence, and ability to perform well in tests and homework.
9. There was a highly significant relationship between long distance between home and the campus which affects their educational standards. Arriving home late, difficulty in getting ready for exams, tiredness, inability to do homework and exercises, inability to concentrate in classes, repeated absences during lectures etc are also important factors.
10. There was a highly significant relationship between the use of English as an instructional language in teaching and inability to follow the lecturer during classes, difficulty in following lectures during classes as the lecturers tend to use English all the time of lectures, and not being able to follow the lecturer as students are unable to communicate with the lecturer.
7. RECOMMENDATIONS
Based on the study findings and the conclusions, the researchers have the following recommendations:
Therefore, we suggest that the entire English language curriculum be revised to include cutting edge approaches to teaching and learning English at secondary level.
Solving students residential and transportation problems which affect their performance, and providing housing for students near the university.
Raising awareness through the Ministry of Culture on importance and beneficial aspects of education in society through mosques, local media, newspapers, radio, the Internet, TV, videos, and publications. Eradication of illiteracy and increasing uneducated parents' education is also important.
Increasing the use of computers and instructional software materials in girls’ schools, offering access to the Internet, and introducing more technology in the classroom.
Replacing traditional methods of teaching, such as rote learning and memorization, with retentive learning techniques and skills. These include development of cognitive skills; innovativeness, creativity, and critical thinking; information analysis, ability to take the initiative; teamwork; ability to meet deadlines; ability to bear responsibilities; ability to communicate and present ideas; development of self-confidence, and development of computer skills and communication technology All the above listed, will help to solve the educational problems of the student.
Areas of further research: This study has identified the need to investigate and analyze the effects of marriage and pregnancy on the academic performance, in addition to the effects of social economic factors on the academic performance of those students.
| Funding: This research is supported by the Deanship of Scientific Research NU/SHED/14/238 |
| Competing Interests: The authors declare that they have no competing interests. |
| Contributors/Acknowledgement: All authors contributed equally to the conception and design of the study. |
REFERENCES
Abdulrahman, M. and M.D. Al-Mazrou, 2008. Does academic performance in the premedical year predict the performance of the medical student in subsequent years? J Family Community Med, 15(2): 85–89.
Agus, A. and Z.K. Makhbul, 2002. An empirical study on academic achievement of business students in pursuing higher education: An emphasis on the influence of family backgrounds. Paper Presented at International Conference on the Challenges of Learning and Teaching in a Brave New World: Issues and Opportunities in Borderless Education. Hatyai Thailand.
Al-Mously, N., R. Salem and N. Al-Hamdan, 2013. The impact of gender and english language on the academic performance of students: An experience from new Saudi medical school. Journal of Contemporary Medical Education Periodical of GESDAV. Principles and Practice of Clinical Research - Study Design., Journal of Contemporary Medical Education, 1(3): 170-176.
AL-Mutairi, A., 2010. Factors affecting business students performance in Arab open university: Case of Kuwait. International Journal of Business and Management, 6(5): 146-155. DOI 10.5539/ijbm.v6n5p146.
Ali, A., 1983. Attitudes of Nigerian secondary school students towards school and their academic achievement in science. Journal of Nigerian Educational. Research Association, 3(2): 11-17.
Ali, A.A., M. Iftikhar, S.M. Nadeem, A. Subhani and C. Pohlke, 2013. Phylogenetic analysis of peste des petits ruminants virus isolated from district Gujranwala, Pakistan. Article in Advances in Animal and Veterinary Sciences. Vet. Sci, 1(1): 32–34.
Ali, N., K. Jusoff, S. Ali, N. Mokhtar, A. Salamt and A. Syafena, 2009. The factors influencing students performance at universiti teknologi MARA Kedah, Malaysia. Canadian Research & Development Center of Sciences and Cultures. Management Science and Engineering 2009 Canadian Research & Development Center of Sciences and Cultures, 3(4): 81-90.
Barkley, A., 2006. The determinants of college student performance: The role of assessment method. WAEA Annual, Department of Agricultural Economics Kansas State University Manhattan, KS 66506-4011, For Presentation at the WAEA Annual Meetings, Anchorage, Alaska.
Becker, G. and N. Tomes, 1979. An equilibrium theory of distribution of income and intergenerational mobility. Journal of Political Economy, 87(6): 1153-1189.
Becker, G.A., 1960. Theory of social interaction. Journal of Political Economy, 82(6): 1063-1093.
Becker, G.S. and H.G. Lewis, 1973. On the interaction between the quantity and quality of children. J.P.E, 2(2): S279-S288.
Considine, G. and G. Zappala, 2002. Influence of social land economic disadvantage in the academic performance of school students in Australia. Journal of Sociology 38(2): 129- 148.
Doyle, W., 1985. Recent research on classroom management: Implications for teacher preparation. Journal of Teacher Education, 36(3): 31-35.
Durden, G.C. and L.V. Ellis, 1995. The effects of attendance on student learning in principles of economics. American Economic Review, 85(2): 343–346.
Ermisch, J. and M. Francesconi, 2001. Family matter: Impacts of family background on educational attainment. Economical, 68(270): 137-156.
Farooq, M.S., A.H. Chaudhry, M. Shafiq and G. Berhanu, 2011. Factors affecting students quality of academic performance: A case of secondary school level. J. Q. Technol. Manage, 7(2): 1-14.
Flowers, C.E., 1966. Effects of an arbitrary accelerated group placement on the tested academicachievement of educationally disadvantaged students. Unpublished Doctoral Dissertation. Teachers College, Columbia University.
Galiher, S., 2006. Understanding the effect of extracurricular involvement. A Research Project Report Presented to the School of Education Indiana University South Bend. In Partial Fulfillment of the Requirements for the Degree Master of Education.
Hake, R., 1998. Interactive-engagement vs. traditional engagement A six-thousand-student survey of mechanics test data for introductory physics courses. American Journal of Physics, 66(1): 53–56.
Hanushek, E.A., 1992. The trade –off between child quantity and quality. Journal of Political Economy, 100(1): 84-117.
Harb, N. and A. El-Shaarwi, 2006. Factors affecting students performance. MPRA Hijazi, Syed Tahir and Naqvi, S.M.M. Raza. (January 2006). Factors Affecting Students Performance: A Case of Private Colleges. Bangladesh e-Journal of Sociology, 3(1): 1-10.
Hijazi, S.T. and R.S.M.M. Naqvi, 2006. Factors affecting students performance: A case of private colleges. Bangladesh e-Journal of Sociology, 3(1): 1-10.
Irfan, M. and N. Shabana, 2012. Factors affecting students academic performance. Global Journal of Management and Business Research, 12(9): 17-22.
Karemera, D., 2003. The effects of academic environment and background characteristics on students satisfaction and performance, the case of South Carolina state university's school of business. College Student Journal, 37(2): 298- 211.
Kwesiga, C.J., 2002. Women’s access to higher education in Africa: Uganda’s experience. Kampala: Fountain publishers Ltd. American Journal of Educational Research, 1(8): 283-289. DOI 10.12691/education-1-8-3.
Kyoshaba, M., 2009. Factors affecting academic performance of undergraduate students at Uganda Christian university. Bba (Ucu) 2005/Hd04/4262u, December 2009. Dissertation Submitted to Graduate School in Partial Fufilment of the Requirements for the Award of the Degree of Master of Arts in Educational Management of Makerere University. Dec. 2009.
Lubinski, D. and P.B. Camilla, 2006. Study of Mathematically Precocious Youth After 35 Years Uncovering Antecedents for the Development of Math-Science Expertise, Vanderbilt University, Special Section: Doing Psychological Science. Copyright r 2006 Association for Psychological Science, 1(4).
Lydiah, W. and E. Adenike, 2013. Relationship between entry qualification and academic performance in undergraduate, science courses at the university of Nairobi, Kenya. Research of Journal Finance and Accounting, International Knowledge sharing Platform. University of Nairobi. (2008). Information Booklet. Nairobi: UON.
Miller, W.P. and R.E. Birch, 2007. The influence of type of high school attended on university performance. Australian Economic Papers, 46(1): 1-17.
Muhammad, D., N. Tahir, A. Muhammad and H. Ali, 2011. The factors affecting the students performance: A case study Ofislamia university of Bahawalpur, Pakistanmuhammad Daniyal. Department of Statistics, The Islamia University of Bahawalpur, Pakistan, Department of Media Studies, The Islamia University of Bahawalpur, Pakistan. African Journal of Education and Technology, 1(2): 45- 51.
Najran University, 2014. University Establishment, Deanship of Preparatory Year: 1-5. Available from http://portal.nu.edu.sa/en/933 [Accessed August 11, 2014].
Roberts, K.L. and P.M. Sampson, 2011. School board member professional development and effect on student achievement. International Journal of Educational Management, 25(7): 701-713.
Rosenzweig, M.R. and K.I. Wolpin, 1980. Testing the quantity-quality fertility model: The use of twins as a natural experiment. Econometrica, 48(1): 227-240.
Tho, 1994. Some evidence on the determinants of student performance in the University of Malaya introductory accounting course. Accounting Education, 3(4): 331-340.
Washburne, N.F., 1959. Socioeconomic status, urbanism and academic performance in colleges. Journal of Educational Research, 53(4): 130-137.
Young, A.J. and B. Patty, 1999. Variation in learning styles in a large class as influenced by gender and academic discipline. NACTA Journal, 42(September): 28-33.
Yushau, B., M.H. Omar and H. Al-Attas, 2006. The effects of preparatory year courses on students performance in first calculus courses at university: The case of KFUPM, department of mathematical sciences, King Fahd university of petroleum and minerals, Dhahran,Saudi Arabia. METSMaC 2006, Proceedings of 2nd Annual Conference for Middle East Teachers of Science, Mathematics, and Computing. pp: 43-51.
Apendix-A.
| Variables | Frequency | Percent |
| First factor: Basic information of student | ||
| Education Of Mother | ||
| Literate | 45 | 26.8 |
| Primary | 26 | 15.5 |
| Intermediate | 37 | 22 |
| Higher School | 24 | 14.3 |
| Universal | 29 | 17.3 |
| Post Graduation | 5 | 3 |
| Missing Value | 2 | 1.2 |
| Total | 168 | 100 |
| Education Of Father | ||
| Literate | 12 | 7.1 |
| Primary | 19 | 11.3 |
| Intermediate | 44 | 26.2 |
| Higher School | 33 | 19.6 |
| Universal | 48 | 28.6 |
| Post Graduation | 11 | 6.5 |
| Missing Value | 1 | 0.6 |
| Total | 168 | 100 |
| High School Type | ||
| Goverment | 159 | 95.2 |
| Private | 8 | 4.8 |
| Total | 168 | 100 |
| Second Factor: Student's educational background | ||
| The nature of the courses in the secondary was intensified | ||
| Yes | 67 | 39.9 |
| No | 29 | 17.3 |
| To some extent | 69 | 41.1 |
| Missing Value | 3 | 1.8 |
| Total | 168 | 100 |
| Teacher in the secondary school focused on teaching the courses | ||
| Yes | 98 | 58.3 |
| No | 26 | 15.5 |
| To some extent | 42 | 25 |
| Missing Value | 2 | 1.2 |
| Total | 168 | 100 |
| Teacher in your secondary school concentrated in answering exercises and homework | ||
| Yes | 105 | 62.5 |
| No | 21 | 12.5 |
| To some extent | 39 | 23.2 |
| Missing Value | 3 | 1.8 |
| Total | 168 | 100 |
| Teaching method are different in the secondary school from teaching methods in the Preparatory Year | ||
| Yes | 95 | 56.5 |
| No | 24 | 14.3 |
| I suffer from studying the courses in a suitable way | ||
| Yes | 68 | 40.5 |
| No | 52 | 31.0 |
| To some extent | 44 | 26.2 |
| Missing Value | 4 | 2.4 |
| Total | 168 | 100 |
| suffering from keep and retrieve the skill (subject) | ||
| Yes | 68 | 40.5 |
| No | 52 | 31 |
| To some extent | 44 | 26.2 |
| Missing Value | 4 | 2.4 |
| Total | 168 | 100 |
| I suffer from feeling boring while studying the subject | ||
| Yes | 88 | 52.4 |
| No | 42 | 25.0 |
| To some extent | 37 | 22.0 |
| Missing Value | 4 | 2.4 |
| Total | 168 | 100 |
| I suffer from frequent absences from lectures | ||
| Yes | 40 | 23.8 |
| No | 93 | 55.4 |
| To some extent | 32 | 19 |
| Missing Value | 3 | 1.8 |
| Total | 168 | 100 |
| lecturer of the course behaves firmly with the student during the classes | ||
| Yes | 86 | 51.2 |
| No | 28 | 16.7 |
| To some extent | 50 | 29.8 |
| Missing Value | 4 | 2.4 |
| Total | 168 | 100 |
| Lecturer of the course always a available in her office during the office hours | ||
| Yes | 104 | 61.9 |
| No | 23 | 13.7 |
| To some extent | 36 | 21.4 |
| Missing Value | 5 | 3 |
| Total | 168 | 100 |
| Lecturer of the course behaves in a fair way with all students | ||
| Yes | 100 | 59.5 |
| No | 22 | 13.1 |
| To some extent | 37 | 22 |
| Missing Value | 9 | 5.4 |
| Total | 168 | 100 |
| Lecturer of the course is very good in his arear of specialization | ||
| Yes | 93 | 55.4 |
| No | 17 | 10.1 |
| To some extent | 51 | 30.4 |
| Missing Value | 7 | 4.2 |
| Total | 168 | 100 |
| Variables | Frequency | Percent |
| Where do you live | ||
| In Najran | 134 | 79.8 |
| Outside Najran | 34 | 20.2 |
| Total | 168 | 100 |
| If outside Najran Identify name | ||
| Abha | 8 | 4.8 |
| Thar | 2 | 1.2 |
| Thahran | 14 | 8.3 |
| Dammam | 1 | 0.6 |
| Hadada | 1 | 0.6 |
| Alryadh | 1 | 0.6 |
| Sharoah | 1 | 0.6 |
| Badar | 1 | 0.6 |
| Missing Value | 5 | 2.9 |
| Total | 34 | 20.2 |
| Have you got an academic warning during the semester while studying in the college | ||
| Yes | 7 | 4.2 |
| No | 156 | 92.9 |
| Missing Value | 5 | 3 |
| Total | 168 | 100 |
| To some extent | 46 | 27.4 |
| Missing Value | 3 | 1.8 |
| Total | 168 | 100 |
| Third factor: Housing and transportation | ||
| I suffer from transportation | ||
| Yes | 56 | 33.3 |
| No | 86 | 51.2 |
| To some extent | 20 | 11.9 |
| Missing Value | 6 | 3.6 |
| Total | 168 | 100 |
| I suffer from drivers who are uncommitted deadline | ||
| Yes | 52 | 31.0 |
| No | 90 | 53.6 |
| To some extent | 21 | 12.5 |
| Missing Value | 5 | |
| I suffer from doing homework and answering exercise | ||
| Yes | 46 | 27.4 |
| No | 89 | 53.0 |
| To some extent | 32 | 19.0 |
| Missing Value | 1 | 0.6 |
| Total | 168 | 100 |
| I suffer from being unable to attend remedial classes | ||
| Yes | 64 | 38.1 |
| No | 64 | 38.1 |
| To some extent | 38 | 22.6 |
| Missing Value | 2 | 1.2 |
| Total | 168 | 100 |
| I suffer from continuously of classes without break time | ||
| Yes | 82 | 48.8 |
| No | 52 | 31 |
| To some extent | 31 | 18.5 |
| Missing Value | 3 | 1.8 |
| Total | 168 | 100 |
| Sixth factor: Qualification of Staff and skills | ||
| Qualifications of staff (Master- PhD) have a great effect on quality of teaching | ||
| Yes | 84 | 50 |
| No | 48 | 28.6 |
| To some extent | 34 | 20.2 |
| Missing Value | 2 | 1.2 |
| Total | 168 | 100 |
| Lecturer of the course carries out the plan of the course | ||
| Yes | 104 | 61.9 |
| No | 22 | 13.1 |
| To some extent | 35 | 20.8 |
| Missing Value | 7 | 2.4 |
| Total | 168 | 100 |
| Lecturer of the course is always punctual and isn't absent unless necessary circumstances | ||
| Yes | 103 | 61.3 |
| No | 23 | 13.7 |
| To some extent | 37 | 22 |
| Missing Value | 5 | 3 |
| Total | 168 | 100 |
| Lecturer of the course uses modern teaching methods in teaching | ||
| Yes | 82 | 48.8 |
| No | 36 | 21.4 |
| To some extent | 44 | 26.2 |
| Missing Value | 6 | 3.6 |
| Total | 168 | 100 |
| Lecturer of the course take of the differences among students | ||
| Yes | 74 | 44 |
| No | 47 | 28 |
| To some extent | 42 | 25 |
| Missing Value | 5 | 3 |
| Total | 168 | 100 |
| Lecturer of the course punishes students from the first dereliction | ||
| Yes | 49 | 29.2 |
| No | 63 | 37.5 |
| To some extent | 48 | 28.6 |
| Missing Value | 8 | 4.8 |
| Total | 168 | 100 |
| Lecturer of the course asks for many homework and weekly duties | ||
| Yes | 48 | 28.6 |
| No | 62 | 36.9 |
| To some extent | 51 | 30.4 |
| Missing Value | 7 | 4.2 |
| Total | 168 | 100 |
| Variables | Frequency | Percent |
| If your answer yes, Then how many | ||
| 0 | 156 | 92.9 |
| 1 | 2 | 1.2 |
| 2 | 4 | 2.4 |
| 3 | 1 | 0.6 |
| 4 | 1 | 0.6 |
| Missing Value | 4 | 2.4 |
| Total | 168 | 100 |
| Have you failed in one or more courses during studying | ||
| Yes | 27 | 16.1 |
| No | 133 | 79.2 |
| Missing Value | 8 | 4.8 |
| Total | 168 | 100 |
| If your answer yes how many times have you failed | ||
| 0 | 135 | 80.4 |
| 1 | 21 | 12.5 |
| 2 | 3 | 1.8 |
| 3 | 2 | 1.2 |
| Missing Value | 7 | 4.2 |
| Total | 168 | 100 |
| Total | 168 | 100 |
| The long distance affects my educational standard | ||
| Yes | 74 | 44.0 |
| No | 57 | 33.9 |
| To some extent | 29 | 17.3 |
| Missing Value | 8 | 4.8 |
| Total | 168 | 100 |
| Fourth factor :Transformation of instruction language from Arabic to English | ||
| Using English as the language of teaching affected my academic level | ||
| Yes | 81 | 48.2 |
| No | 39 | 23.2 |
| To some extent | 45 | 26.8 |
| Missing Value | 3 | 1.8 |
| Total | 168 | 100 |
| Fifth factor: Academic Problems | ||
| The student doesn't like certain types of courses | ||
| Yes | 86 | 51.2 |
| No | 36 | 21.4 |
| To some extent | 42 | 25.0 |
| Missing Value | 4 | 2.4 |
| Total | 168 | 100 |
| Long experience of lecturer in teaching has a positive effect on her performance in lectures | ||
| Yes | 90 | 53.6 |
| No | 40 | 23.8 |
| To some extent | 33 | 19.6 |
| Missing Value | 5 | 3 |
| Total | 168 | 100 |
| The lecturer of the course supplies her students syllables plan clearly from the beginning of the semester | ||
| Yes | 91 | 54.2 |
| No | 28 | 16.7 |
| To some extent | 45 | 26.8 |
| To some extent | 37 | 22 |
| Missing Value | 5 | 3 |
| Total | 168 | 100 |
| The lecturer of the course explains the content in a clear way | ||
| Yes | 89 | 53 |
| No | 21 | 12.5 |
| To some extent | 55 | 32.7 |
| Missing Value | 3 | 1.8 |
| Total | 168 | 100 |
| Carelessness of lecturer about the academic problems for students | ||
| Yes | 59 | 35.1 |
| No | 55 | 32.7 |
| To some extent | 50 | 29.8 |
| Missing Value | 4 | 2.4 |
| Total | 168 | 100 |
| lecturer of the course is careful about student's understanding of lectures topics | ||
| Yes | 75 | 44.6 |
| No | 35 | 20.8 |
| To some extent | 52 | 31 |
| Missing Value | 6 | 3.6 |
| Total | 168 | 100 |
| Lecturers of the course responses to student's questions during the lectures | ||
| Yes | 101 | 60.1 |
| No | 22 | 13.1 |
| To some extent | 450 | 23.8 |
| Missing Value | 5 | 3 |
| Total | 168 | 100 |
Appendix-B.
Table-4. Use the Chi squares test to test the difference in teaching method in the secondary school and preparatory year affected on my academic level and seventh factors mentioned in table below
| The difference in teaching method in the secondary school and preparatory year affected on my academic level | |
| The difference nature of courses | X=29.329 ,P=0.001 |
| The Difference in the way of treatment | X=25.251 ,P=0.003 |
| self- independence | X=23.285 ,P=0.006 |
| Having a lot of tests and homework | X=18.079 ,P=0.034 |
| Difference in social environment | X=50.941 ,P=0.000 |
| Having several examinations in the same semester | X=12.675 ,P=0.178 |
| Using exams as the only criteria in evaluating students | X=18.344 ,P=0.031 |
Source: Preparatory Year Girls - Najran University. 1435-1436H
Table-5. Use the Chi squares test to test the long distance affects my educational standard and sixth factors mentioned in table below:
| The long distance affects my educational standard | |
| Arriving home late | X=60.463 ,P=0.000 |
| Feeling tired always | X=93.282 ,P=0.000 |
| Inability to do homework and exercise | X=93.8 ,P=0.000 |
| Inability to concentrate in classes | X=70.684 ,P=0.000 |
| Difficulty in getting ready for exams | X=70.684 ,P=0.000 |
| Repeating of being absent during lectures | X=64.254 ,P=0.000 |
Source: Preparatory Year Girls - Najran University. 1435-1436H
Table-6. Use the Chi squares test to test the relationship between using English as the language of teaching affected my academic level and four factors mentioned in table below.
| Using English as the language of teaching affected my academic level | |
| Inability to follow the lecturer during classes | X= 55.542 ,P=0.000 |
| Difficulty in concentration during classes where lecturers uses only English in teaching | X=35.046 ,P =0.00 |
| I can't follow the lecturer as I have a problem in listening | X=45.506 ,P=0.000 |
| I face a problem in speaking English and this make me unable to answer the question | X=40.982 ,P=0.000 |
Source: Preparatory Year Girls - Najran University. 1435-1436H
Table-7. Use the F test to test the relationship between Grade Point Average (GPA) and the percent when entering faculty.
Grade Point Average(GPA) (Dependent Variable) |
Coefficients | F | Sig |
| Constant | -3.431 | 54.973 | 0.000 |
| The percent when entering faculty | 0.072 |
Source: Preparatory Year Girls - Najran University. 1435-1436H
Table-8. Use the F test to test the relationship between Grade Point Average (GPA) and Education of mother and Education of father
Grade Point Average(GPA) (Dependent Variable) |
Coefficients | F | Sig |
| Constant | 3.154 | 1.149 | 0.319 |
| Education of mother | 0.085 | ||
| Education of father | -0.042 |
Source: Preparatory Year Girls - Najran University. 1435-1436H
Table-9. Use the F test to test the relationship between Grade Point Average (GPA) and Qualifications of staff (Master- PhD) have a great effect on quality of teaching:
Grade Point Average(GPA) (Dependent Variable) |
Coefficients | F | Sig |
| Constant | 3.2 | 0.11 | 0.741 |
| Qualifications of staff (Master- PhD) have a great effect on quality of teaching | 0.031 |
Source: Preparatory Year Girls - Najran University. 1435-1436H
Table-10. Use the F test to test the relationship between Grade Point Average (GPA) and long experience of lecturer in teaching has a positive effect on her performance:
Grade Point Average (GPA) (Dependent Variable) |
Coefficients | F | Sig |
| Constant | 3.591 | 4.577 | 0.034 |
| long experience of lecturer in teaching has a positive effect on her performance | -0.2 |
Source: Preparatory Year Girls - Najran University. 1435-1436H
| Views and opinions expressed in this article are the views and opinions of the author(s), International Journal of Asian Social Science shall not be responsible or answerable for any loss, damage or liability etc. caused in relation to/arising out of the use of the content. |