


OLD AGE MORTALITY IN INDIA –AN EXPLORATION FROM LIFE EXPECTANCY AT AGE 60

1Research Scholar, Department of Demography, University of Kerala, India
2Professor (Rtd), Department of Demography, University of Kerala, India
ABSTRACT
Background: Due to the result of improving longevity the number of survivors at old ages increased in India. The annual growth rate of the population aged 60 and above is higher than the rate of growth of the total population. So the process population ageing and associate problems become serious issue in the country. This study examines the changes in old age mortality in India from 1971-2011 and also examined the age group contribution to the gain in e60. Data and Methods: Measure used here to describing the mortality change was life expectancy at age 60 (e60). Using Age Specific Death Rates from Sample Registration System, new life tables were constructed for the analysis. Pollardâ’s Decomposition analysis were applied for determining age group contribution. Results: Old age mortality in India shows a considerable decline during the period but the pace of mortality decline was slowdown after 1990. Most of the increase in life expectancy at age 60 came from the result of decreasing mortality at young old and oldest age for females. While among males decreasing mortality at young old and old-old ages was important for increase in life expectancy at age 60. Conclusion: Understanding old-age mortality trend and possible determinants are important for health care professionals for constructing health care strategies on possible mortality development in the future.
© 2016 AESS Publications. All Rights Reserved.
Keywords:Life expectancy, Old-age mortality, Decomposition by age, Sample registration system, Ageing, India.
Contribution/ Originality:This study is one of very few studies which have investigated the changes in old age mortality in India in respect of e60. Here analyzed different age group contributions to the gain in e60 using Pollard's decomposition techniques. No such attempt done for analyzing the changes of old age mortality in this way.
1. INTRODUCTION
Expectation of life at birth is a summary measure of mortality; it is the average age at death in a stationary population. Experience has shown that better it is, the better is the mortality situation of that population. Recent trends in life expectancy at birth show rapid increase in both developed and developing countries. When life expectancy improves, it is nearly always the result of progress in survival among both children and adults, but the relative contribution of the different age groups changes according to the stage of the demographic transition. In populations with low life expectancy at birth in the early stages of their demographic transitions, the proportion of progress in longevity that is due to improvements in survival among children tends to outweigh that is attributable to improvements among adults. As life expectancy at birth increases, the marginal improvement contributed by progress in survival in each age group shifts towards older ages (United Nations, 2011)
Mortality pattern in India shows a steady and significant improvement in all ages. The overall mortality transition is said to be fast in progress and one may say convergence has almost taken place in mortality of India by 2010 (Ponnapalli et al., 2013). Age pattern of mortality heading towards plateau shape from the early U-shaped curve. Crude Death Rate and Infant Mortality Rate have been halved down during the last three decades. Expectation of life at birth in India reached 65 in 2010 (Sample Registration System (SRS), 2010). Such emerging trends show India transitioned from high mortality to low mortality condition in the last three decades .Due to the result of improving longevity the number of survivors at old ages increased. The annual growth rate of the population aged 60 and above is higher than the rate of growth of the total population. At the current pace of demographic transition, population ageing is predictable. The proportion of the population aged 60 and above is projected to touch 19.1 per cent in 2051, from the current figure of 8.1 per cent. In terms of absolute number, the increase is from 86.5 to 298.2 million during 2011-2051(Population Reference Bureau, 2012).Therefore the process of population ageing and associated problems has become one of the serious issues in India.
In India mortality related studies are limited. However, the fact that there have been some attempts to analyse the age pattern of mortality in the country (Roy and Lahiri, 1987; Bhat and Navneetham, 1991; Navaneetham, 1993) but the emphasis of these studies had not been on the changes in old age mortality. Along with the decline in general mortality, there appears to be change in the mortality of elderly population in India. Hence, there is an imminent need to know the changes and development of mortality among elderly population. With these backdrops this study made an attempt to analyze the changes in old age mortality in India through the life expectancy at age 60 (e60).The main objectives of the present study are the following.
1. To examine the changes in life expectancy at age 60 from 1971-2011.
2. To analyze the contribution of different age group to the gain in e60 for the said period
2. DATA AND METHODOLOGY
2.1. Data
The only source that provides age specific death rates (ASDR) by sex and place of residence for India annually is the Sample Registration System (SRS) . As such, in the present study, death rates by sex and place of residence, during 1971-2011 taken from the SRS of India SRS, RGI (n.d)) which are used for constructing life tables. MortPakLite software package used for the construction of life tables (United Nations, 1988a;1988b).
2.2. Method
The measure used here to describe old age mortality is life expectancy at age 60 (e60).It is not only more people surviving to age 60,they are living longer too .
Decomposition analysis was used for measuring the age group contribution to the gain in life expectancy at age 60. Pollard (1988) proposed a method to decompose the difference in expectation of life at birth to determine the contribution of difference in age –specific mortality rates. Using this method here to decompose the difference in e60 to determine the contribution of difference in age-specific mortality rates.
For specific age interval (x ,x+n) the contribution is calculated as
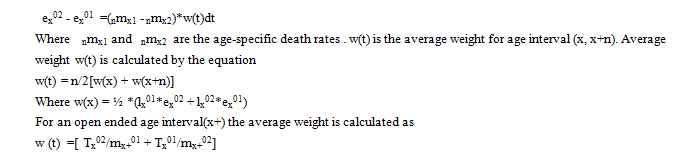
The decomposition method is applied for the whole period under consideration 1971-75 to 2007-11
3. FINDINGS
3.1. Gender Difference in Life Expectancy at Birth and at Age 60 in India
For finding the gender difference in life expectancy the whole period is broken down to two parts 1971-75 to 1991-95 and 1991-95 to 2007-11.From 1971-2011 period expectation of life at birth and at the age of 60 years for males and females of India showed an increase of 14.1 years and 19.3 years in life expectancy at birth for males and females respectively with a difference of 5.1 years favourable to females. During the same period a female at the age of 60 years was expected to live another 4.5 more years while males only by 2.9 years more.
During 1971-75 periods, when the life expectancy at birth is more for males by 1.7 years, life expectancy at age 60 is favourable to females by 0.6 years. But after 1970’s expectation of life among females was improved rapidly. From 1990s onwards the life expectancy at birth is becomes favourable to females and increases mainly due to the mortality improvement among females. Thus notable gender differences are seen in life expectancy at birth and at age 60 in India during the period.
The rural-urban bifurcation shows that the life expectancy at birth and at age 60 are more in urban areas for both sexes but the differences are favourable to females from 1990s,but comparatively less in urban areas.. Same time the gender gap of e0 is widening over time. But in recent period the gap is slightly shrinking in both rural and urban areas.
Table-1. Sex difference in life expectancy
| Year | Life Expectancy at birth | Sex Difference in LE | Life expectancy at age 60 | Sex Difference in LE | ||
| Male | Female | Male | Female | |||
| 1971-75 | 50.5 | 48.8 | 1.7 | 13.6 | 14.2 | 0.6 |
| 1991-95 | 59.6 | 60.8 | 1.2 | 15.3 | 17.1 | 1.8 |
| 2007-11 | 64.6 | 68.1 | 3.5 | 16.5 | 18.7 | 2.2 |
| Rural | ||||||
| 1971-75 | 48.9 | 46.6 | 2.3 | 13.3 | 13.8 | 0.6 |
| 1991-95 | 53.7 | 58.4 | 4.7 | 14.2 | 15.0 | 0.8 |
| 2007-11 | 63.7 | 66.9 | 3.2 | 16.1 | 18.4 | 2.3 |
| Urban | ||||||
| 1971-75 | 58.9 | 58.8 | 0.1 | 15.0 | 16.0 | 1.0 |
| 1991-95 | 64.4 | 67.2 | 2.8 | 16.7 | 18.6 | 1.9 |
| 2007-11 | 68.3 | 71.0 | 2.7 | 17.8 | 19.5 | 1.7 |
Source: Computed by author
3.2. Changes in e60 in India
Looking at the changes in e60, in 1971-75 life expectancy at age 60 for males in India was 13.6 years and by 2007-11 it increased to 16.5 years .The gain in e60 between the period 1971-75 and 2007-11 was 2.9 years (Table.2).
Considering the regional variation in e60 among males, it can be seen that urban elderly enjoyed high life expectancy than their rural counterpart. Men aged 60 in urban India could expect to live another 15 years whereas rural men could expect to live another 13.3 years only. There is 1.7 year difference is seen between urban and rural areas during the period 1971-75. By 2007-11 life expectancy at age 60 increased by 17.8 years for urban males and 16.1 years for rural males. While the urban-rural difference in e60 is remaining the same. The gain in e60 for the whole period is 2.8 years for both urban and rural areas.
Women aged 60 years could expect to live another 14.2 years in 1971-75.By 2007-11 it increased 18.7 years, a 4.5 years gain between 1971-75 and 2007-11. Women enjoyed longer life than men in India.
Like males urban females enjoy high life expectancy than rural females. In 1971-75 e60 for urban females was 16 years whereas among rural females it was 13.8 years, .2.2 years urban-rural difference is seen in e60 during the period 1971-75.By 2007-11 women aged 60 years in urban India could expect to live another 19.5 years whereas in rural areas women could expect to live another 18.4 years. By 2007-11 urban –rural difference in e60 was shrinking from 2.2 years to 1.1 years. Considering the gain in e60 for the whole period it can be seen from the table that there is 4.6 years gain for rural females and 3.5 years gain for urban females. The gain in e60 was more in rural areas .The gain in e60 among rural elderly for both sexes , during 1991-95 to 2007-11 is more than that of the gain for urban elderly. This indicates that the gain in e60 is better for rural folks recently. Comparing the old age mortality improvement between urban and rural folks, life expectancy at age 60 is high in urban areas for the whole period under consideration. When the old age mortality among urban areas of India is improved from 1970 onwards but the pace of old age mortality improvement is slowed down in recently, whereas in rural areas old age mortality is improved only from 1990s
Table-2.Changes in Life expectancy at age 60, (e60) in India
| Age | Life Expectancy | Gain in e60 | Total gain | |||
| 1971-75 | 1991-95 | 2007-11 | 1971-75 to 1991-95 | 1991-95 to 2007-11 | ||
| Total-Males | ||||||
| e60 | 13.6 | 15.3 | 16.5 | 1.7 | 1.2 | 2.9 |
| Rural-Males | ||||||
| e60 | 13.3 | 14.2 | 16.1 | 0.9 | 1.9 | 2.8 |
| Urban-Males | ||||||
| e60 | 15.0 | 16.7 | 17.8 | 1.7 | 1.1 | 2.8 |
| Total -Females | ||||||
| e60 | 14.2 | 17.1 | 18.7 | 2.9 | 1.6 | 4.5 |
| Rural-Females | ||||||
| e60 | 13.8 | 15.0 | 18.4 | 1.2 | 3.4 | 4.6 |
| Urban-Females | ||||||
| e60 | 16.0 | 18.6 | 19.5 | 2.6 | 0.9 | 3.5 |
Source: Computed by author
3.3. Contributions of Different Age Group to the Gains in e60Among Males
In order to understand the contributions of different age groups to the gain in life expectancy at age 60, decomposition analysis was done. The result of the analysis is presented in Table.3 and 4.
Gain in e60 among males in India during the past three decades was 2.9 years. Major contribution to this gain is from 60-69 age groups. That is about 50 percent (1.44 years) of this increase came from age 60-69 and 26 percent (0.75 years) from 70-79 age group. Age 80 and above contribute 24 percent ( 0.71 years ) to this increase in e60 .The age group 75-79 and 85+ are less prominent in mortality improvement compared to other age group. That is they made 0.31 and 0.32 years contribution to the gain in e60.Thus the contribution from the young old age group to the increase in male life expectancy at age 60 was quite substantial (Table.3)
Looking to the urban and rural areas, here also the major contribution to the gain in e60 was from age group 60-69 years. Gain in e60 among males in both urban and rural areas are same (2.8 years) .The contributions of different age group to the gain in e60 was slightly high in urban areas except in the oldest age group (age 80 and above),where the contribution is less in urban males compared to rural males. That is for rural males the gain is 0.39 and 0.34 years, while for urban males it was 0.32 and -0.21 years. Regarding the age group 60-69, urban males has shown 1.71 years(61 percent) contribution to the gain in e60 whereas in rural males it was 1.33 years(47.5 percent).Age group 70-79 shows 0.97(35 percent) and 0.73 (26 percent) years contribution to the gain in e60 for urban and rural males respectively. Among rural males of ages over 80 contributed 26 percent to the gain e60 while among urban males it was only 4 percent.
Table-3. Age group contributions to gains in e60 -male
| Age group | Contributions to the gain in e60 | ||
| Total | Rural | Urban | |
| 1971-75 to 2007-11 | 1971-75 to 2007-11 | 1971-75 to 2007-11 | |
| Male | |||
| 60-64 | 0.78 | 0.73 | 0.98 |
| 65-69 | 0.66 | 0.60 | 0.73 |
| 60-69 | 1.44 (50 )* | 1.33(48)* | 1.71 (61)* |
| 70-74 | 0.44 | 0.43 | 0.55 |
| 75-79 | 0.31 | 0.30 | 0.42 |
| 70-79 | 0.75 (26)* | 0.73 (26)* | 0.97 (35)* |
| 80-84 | 0.39 | 0.39 | 0.32 |
| 85+ | 0.32 | 0.34 | -0.21 |
| 80 and above | 0.71(24)* | 0.73 (26)* | 0.11(4)* |
| Total gain in e60 | 2.90 | 2.80 | 2.80 |
*In Percentage
Source: Computed by author
3.4. Contributions of Different Age Group to the Gains in e60Among Females
The pattern for females was somewhat different from that of males. The contribution of oldest age (age 80 and above) was more prominent for females than males. Gain in e60 among females in India was 4.5 years during the past three decades. Like males most of the contribution to this gain comes from age group 60-69 years. That is they made about 1.9 years (42 percent) contribution to this increase .Age group 70-79 and 80 and above contribute 1.2 (27 percent)and 1.4 years (31 percent)respectively (Table.4).
Rural females show 4.6 years gain in e60 during the whole period under consideration. Regarding the age group contributions to the gain in e60 age group 60-69 contribute 1.82 years (40 percent ) .Age group 70-79 made 1.24 years (27 percent) contribution to the 4.6 years gain in e60. .Age 80 and above has shown 33 percent (1.54 years) contribution to this gain. There is 3.5 years gain in e60were seen in urban females. About 47 percent (1.64 years) contribution to this increase was from 60-69 age group .Oldest age group (age 80 and above ) shows comparatively less contribution to the increase of life expectancy at age 60,that is 33 and 24 percent for rural and urban respectively. Thus in India oldest age mortality improvement is fairly less among urban females.
Table-4. Age group contributions to gains in e60 -female
| Age group | Contributions to the gain in e60 | ||
| Total | Rural | Urban | |
| 1971-75 to 2007-11 | 1971-75 to 2007-11 | 1971-75 to 2007-11 | |
| Female | |||
| 60-64 | 0.98 | 0.96 | 0.90 |
| 65-69 | 0.88 | 0.86 | 0.74 |
| 60-69 | 1.86 (42)* | 1.82 (40)* | 1.64 (47)* |
| 70-74 | 0.67 | 0.69 | 0.61 |
| 75-79 | 0.53 | 0.55 | 0.39 |
| 70-79 | 1.2 (27)* | 1.24 (27)* | 1.0 (29)* |
| 80-84 | 0.76 | 0.84 | 0.58 |
| 85+ | 0.64 | 0.70 | 0.27 |
| 80 and above | 1.4 (31)* | 1.54 (33)* | 0.85 (24)* |
| Total gain in e60 | 4.46 | 4.6 | 3.5 |
* In percentage
Source: Computed by author
4. DISCUSSION
Different phase of epidemiological transition decline in mortality at younger ages gradually led to a shift in mortality towards older ages. As a result, the development in life expectancy became more and more determined by trends in mortality at older ages (Olshansky and Ault, 1986). Due to the increasing effect of old-age mortality trend on the current and future course of life expectancy ,and due to its role in ageing populations , old-age mortality receive greater attention for research (Caselli and Vallin, 1990; Grundy, 1997).
During the past three decades India witnessed a significant reduction in mortality at all ages. Along with mortality reduction expectation of life at birth in India have significant improvement over the period .Initially this improvement is due to the mortality reduction among infant and child mortality, but the relative contributions of different age group change according to the stages of demographic transition. Along with general mortality decline in India their appears some changes in old age mortality too. Therefore this study analyzes the changes in old age mortality in India during the periods 1971-2011. For this purpose life table technique and decomposition analysis were applied .This study is based on the Age Specific Death Rates, provided by Sample Registration System ,Government of India. Here the change in old age mortality is described through the changes of expectation of life at age 60.
Results of the study indicate that old age mortality have considerable decline over time. Old age mortality decline was more pronounced among females .After 1990 the pace of mortality decline was slowed down among both males and females in India. This findings is in agreement with the results obtained from the study mortality transition in India 1970-2005 by Ranjan (2010). This slowdown is quite substantial among females. The young old (age 60-69 ) mortality decline was more prominent among males, while old-old (age 70-79) and oldest old (age 80 and above) mortality decline was significant among females.
Along with sex difference in mortality, there observed a regional variation in old age mortality. Old age mortality development was more pronounced after 1990 in rural India for both males and females. Whereas in urban India the pace of mortality decline was less after 1990 .Among males young old and old-old mortality development was more prominent in urban areas , while in oldest old mortality development was more observed in rural areas .For instance, among urban males aged 85 and over made a negative contribution to the gain in e60 during the period under consideration was found in the study. Oldest age mortality decline was very low among urban males. Overall mortality decline among elderly are same for both urban and rural males but there observed some disparity between the age groups.
Among females the old age mortality decline was more pronounced in rural areas .Urban females also show considerable decline in old-age mortality. But the slowdown of the pace of mortality decline was more observed among urban females .Here also appears heterogeneity in the changes of mortality between age group. Young old and old-old mortality decline was more pronounced among urban females, while oldest old mortality was relatively high among rural females. Among rural females old-old mortality was less important to the gain in life expectancy at age 60.
To summarize , results of the analysis indicate that most of the increase in life expectancy at age 60 came from the result of decreasing mortality at young old and oldest old for females. This pattern was more obvious in total and rural females. While among males decreasing mortality at young old and old-old ages was important for the increase in life expectancy at age 60.
5. CONCLUSION AND RECOMMENDATION
During the past three decades there has been a significant reduction in mortality in India. Decreasing mortality at old ages (ages 60 and above) was observed for males and for females in India in general, as well as in urban and rural areas. This pattern was more pronounced for females than males and it was more obvious in rural India. Recently the pace of old age mortality decline is low in India particularly among urban females.
The decline in old age mortality in India was decelerated after 1990, and this pattern is true for urban India .Although the decline in old age mortality among rural India for both sex accelerated after 1990, this acceleration was more obvious in females. This disparity of mortality decline among sex and regions with in India may be due to several reasons . Life style changes and emerging burden of chronic diseases along with socio-economic changes may influence the mortality differentials in India .The present study could not explore the reasons behind the mortality differentials .Therefore there is an urgent need to understand the physical, social and economic factors behind the mortality differentials of the regions with favorable and less favorable mortality experience .Understanding old-age mortality trend and possible determinants are important for health care professionals for constructing health care strategies for possible mortality development in the future .Thus there is the necessity of exploring more specifically the factors that discriminate a region with favorable mortality experiences from those with less favorable mortality. So this study recommended an in- depth comparative research for the same. Studying regional variations within India could provide additional clues on the determinants of old –age mortality decline.
REFERENCES
Bhat, P.N.M. and K. Navneetham, 1991. Recent trends in age-specific mortality in India. J Institute of Economic Research, 26(1&2): 49–69.
Caselli, G. and J. Vallin, 1990. Mortality and population ageing. European Journal of Population, 6(1): 1-25.
Grundy, E., 1997. Demography and gerontology: Mortality trends among the oldest old. Ageing and Society, 17(6): 713-725.
Navaneetham, K., 1993. Mortality decline in India: An analysis of regional and temporal variations. Demography India, 22(1): 53-63.
Olshansky, S.J. and A.B. Ault, 1986. The fourth stage of the epidemiologic transition: The age of delayed degenerative diseases. Milbank Q, 64(3): 355-391.
Pollard, J.H., 1988. On the decomposition of changes in expectation of life and differentials in life expectancy. Demography, 25(2): 265-276.
Ponnapalli, R., P. Krishnamurthy and Subbiah, 2013. Ageing and the demographic transition in India and states: A comparative perspective. International Journal of Asian Social Science, 3(1): 171-193.
Population Reference Bureau, 2012. India’s aging population: Todays research on ageing program and policy implications issue No. 25: 1-6.
Ranjan, C.A., 2010. Mortality transition in India 1970_2005. Asian Population Studies, 6(1): 47-68.
RGI, n.d. Sample registration system: Statistical reports. New Delhi: Office of the Registrar General of India; 1971-2011.
Roy, T.K. and S. Lahiri, 1987. Recent levels and trends in mortality in India and its major states: An analysis of SRS data. In: Srinivasan K, Mukerji S, editors. Dynamics of population and family welfare. International institute for population sciences. Bombay: Himalaya Publishing House. pp: 279–349.
Sample Registration System (SRS), 2010. Office of the registrar.
United Nations, 1988a. The United Nations software package for mortality measurement Batch oriented software for the mainframe computer. New York: United Nations;. MORTPAK. United Nations, 1988b. The United Nations software package for mortality measurement (Interactive Software for the IBM-PC and Compatibles). New York: United Nations. MORTPAK-LITE. pp: 111-14.
United Nations, 2011. Department of Economic and Social Affairs, Population Division, World Population Prospects: The 2010 Revision: Comprehensive TablesST/ESA/SER.A/313, I.