


SOCIO-ECONOMIC AND CULTURAL FACTORS EFFECTING MIGRATION BEHAVIOR IN DISTRICT SARGODHA, PAKISTAN

1,2,3,4,5 Department of Statistics, University of Sargodha, Pakistan
ABSTRACT
Migration is the most common reason of the rapid urbanization. A rapid migration occurs due to many causes like Socio-Economic, Cultural, Demographic and Psychological factors. This study is designed in context of these factors to determine the reasons behind the migration. The aim of this study is to light up the migration behavior of people in changing patterns of Demographic and Socio-Economic structure. We conduct the present study about the district Sargodha. Our study evaluates the urbanization behavior of this district i.e. Sargodha. Our study area is Sargodha. For the selection of respondents, purposive area was selected. Our sample size is about 380 and technique used in analysis was simple random sampling and the respondent are both male and female of Sargodha. With the help of designed questionnaire, we collected data. Our questionnaires having questions related to all Socio-Economic variables like Education, Literacy, Health Facilities and Unemployment etc. Furthermore, questions describe the purpose of migration and inspiration factors (pull & push factors) and asked to confined their opinion and its consequence. Then we analyse the data through suitable statistical techniques. This study reveals that, 30% people move towards cities for higher education, 29.2% people for business opportunities and 26.8% for employment. We conclude on the basis of our results that work, education, employment and business opportunities are the main factors to influence urbanization in Sargodha. The push factors are major cause of urbanization as compare to pull factors. Results also shows that majority of the respondents are adult and educated but not trained professional.
© 2016 AESS Publications. All Rights Reserved.
Keywords:Migration, Urbanization, Culture, Demography, Unemployment, Socio-Economic factor.
Contribution/ Originality:This study is one of very few studies which have investigated the effect of social and economic factors that affect the migration rate in district Sargodha. This study contributes towards better socio-economic policy and development of the district Sargodha that government should provide proper facilities in the rural areas.
1. INTRODUCTION
It’s a natural thing that everybody wants luxury in his life. Therefore, people move one place to another place to fulfill their wishes. Cities play an important role in the political, cultural and economic development of the Pakistan. The term “Urbanization” is mostly used in geography as well as demography. In the 19th and 20th century, the urbanization was rapid. In 1800, 27 million citizens were in the world which is 3% of the total population now. Urban population is increasing day by day. This process of increase of population in the cities is known as Urbanization. Urbanization means the movement of people from rural to urban areas. It means people move from village areas to urban locations. A society’s population increases its concentration in urban areas i.e. in cities and town. This process is known as urbanization.
We explain migration in this way that any permanent change in home place. It involves the “Ant Group that belongs to any institution. That Group move from one place to another place with his activities and work” (Goldscheider, 1971).
We mostly listen about “Push – Pull Theory” over the time migration rose hardly occur. Some people move cause of push factor towards cities. And some people migrate due to pull factor (attractive factor) toward cities. People migrate due to pull factor as compare to push factor (Ravenstein., 1889).
Migration is defined as “Lack of social facilities i-e less production, drought, earthquake, flood (Push factor) and (pull Factors) i-e for better education, business opportunity, overcome unemployment force of the people that migrate from one place to other (Jakson, 1969).
“We examined in Asian cities people are not attracted to hustle or bustle of cities. But actually people want facilities in their lives that’s why they move from villages to cities or town”(UNESCO, 1956).
In Pakistan, according to census 1998, rural population has declined from 71.7% in 1981 to 67.5% in 1998 or by 4.2%. The urban population has increased from 28.3% in 1981 to 32.5% in 1998 or by 4.2%. This suggests that every 3rd person now lives in the city or town. The main Objective behind this work is to check, why people move from villages to city.
- Why people moves from rural areas to urban areas?
- And check the association between “ PUSH” and “PULL” factors.
- Identify the different features of the urbanization.
- Identify the reasons behind the desire of migration rural location to urbanization.
2. MATERIALS AND METHODS
2.1. Study Area
The study area is theSARGODHA. It is the 11th largest city of Pakistan and one of the fastest growing cities in Pakistan. Sargodha District is administratively divided into Seven Tehsils, which contain a total of 161 Union Councils. The population of Sargodha according to 1998 census is 458,440 which are 2.666 million.
2.2. Study Population
The sample size is 380 (female and male) that belong to the Sargodha. We select a sample size with the reference of “Krejcie Morgan” Research paper. In this way we get a sample size at least 380.Simple random sampling use for collection of respondents
2.2. Data Collection & Analysis
Questionnaires method is utilized to find the study objective. The questions in the questionnaire paper are mostly pre decide. Data is collected on unemployment, Personal issues, education, better living standard, health facilities, and business opportunity etc. This question is helpful for explaining the purpose of moving from village to city areas and describing the inspiration factor (push& pull factor). In this way we aware about the perception of people towards urbanization. And we asked it about the impact of urbanization. The collected data can be analyzed through different statistical parameters in SPSS. In this way we get reasonable conclusion.
3. RESULT
3.1. Characteristic of Study Population
We observed, mostly respondents i.e. 95 percent are (20 to 30-year age). All respondents i.e. (Male, Female) are young adults. Our results indicate that 30% people move towards cities for higher education, 29% people migrate for business opportunities and 26.8% for unemployment. About 30.0% People move for better education in urban area from rural area. For business opportunities 29.2 percent, good society 24.7 per cent, good salary/ income 22.9 percent or health facilities 21.3 percent people migrate rural to urban areas. So, results show that education, unemployment and business opportunities are main factors that influence urbanization. The push factors play major role in urbanization as compare to pull factors
3.2. Stimulation for Migration
Present study demonstrates that more people move rural to urban areas because they were deprived for better education, health, better jobs, and daily life luxuries. Everybody wants luxury in real life. Therefore, people move towards the cities. We see 30.0 percent people migrate from rural to urban areas for better education and 29.2 percent respondents migrate to city for business opportunities, 22.1 percent respondent move toward city areas for good climate. Present study depicts the “PULL FACTORS” play more role as compare to push factors.
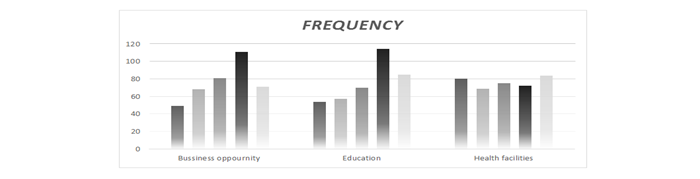
Fig-1. Respondent’s purpose of migration
Table-1. Factors responsible for stimulation for migration to the city
| Extent of stimulation | Push factors Pull factors | |||
| F | % | F | % | |
| Strongly Disagree | 63 | 16.6 | 183 | 45.3 |
| Disagree | 75 | 19.7 | 194 | 49.7 |
| Neutral | 78 | 20.5 | 226 | 59.4 |
| Agree | 78 | 20.5 | 297 | 83.9 |
| Strongly Agree | 68 | 22.6 | 249 | 61.6 |
3.3. Factors Responsible for Stimulation for Migration to City
3.3.1. Impacts of Urbanization
We observed that most respondent know the impact of migration for moving from rural to urban areas. Our present study examines that the better education facilities is the 1st major problem. Now days for proper education lead to the rapid migration. 29.2 % respondents agree that business opportunity is 2nd major problem. Furthermore, unemployment is the 3rd major problem. 26.8 % of the respondents strongly favored and 24.7% respondent prefer to move towards for overcoming migration for good society. Most of the respondents are fully adjusted for the city environment.
Table-2. Perception of the respondents regarding the problems of city life due to rapid migration
| Strongly | Disagree | Neutral | Agree | Strongly | ||||||
| Disagree | Agree | |||||||||
| Problems | F | % | F | % | F | % | F | % | F | % |
| Unemployment | 61 | 16.1 | 75 | 19.7 | 70 | 18.4 | 102 | 26.8 | 72 | 18.9 |
| Good Society | 69 | 18.2 | 64 | 16.8 | 75 | 19.7 | 94 | 24.7 | 78 | 20.5 |
| Better Climate | 80 | 21.1 | 69 | 18.4 | 75 | 19.7 | 72 | 18.9 | 84 | 22.1 |
| Business Opportunity | 49 | 12.9 | 68 | 17.9 | 81 | 21.3 | 111 | 29.2 | 71 | 18.7 |
| For better | 54 | 14.2 | 57 | 15.0 | 70 | 18.4 | 114 | 30.0 | 85 | 22.4 |
4. DISCUSSION
After analysis of present study, we conclude that socio-economic factors play an important role for shaping migration behavior i-e education, income and business opportunity etc. All respondents are young’s adults (student). Present study supports the “push-pull Theory” that present by Ravenstein. (1889)
Present study reveals that pull factor play a major role in urbanization as compare to pull factors. Respondent mostly motivated by pull factor i-e. Better education facilities, health facilities, better living standard, good climate, good society and business opportunity etc.
83.9 percent respondent strongly favored it, people migrate due to pull factors, and however few people migrate due to push factor (Table 2).Present study reveal that 30 per cent people attract towards city for getting better education facilities.29.2 per cent respondent move rural to urban areas for achieve better business opportunity.26.8 per cent people move cities areas for overcome unemployment.
This result show that range of migration rose increase due to absence of necessary education facilities, increasing unemployment, absence of good business opportunity.
5. CONCLUSION AND RECOMMENDATIONS
After analysis of univariate we present the result: The results are shown in the form of tables and graphs.
Table-3. People migrate in order to seek business opportunities.
| Frequency | Percent | |
| Strongly Disagree | 49 | 12.9 |
| Disagree | 68 | 17.9 |
| Neutral | 81 | 21.3 |
| Agree | 111 | 29.2 |
| Strongly Agree | 71 | 18.7 |
| Total | 380 | 100.0 |
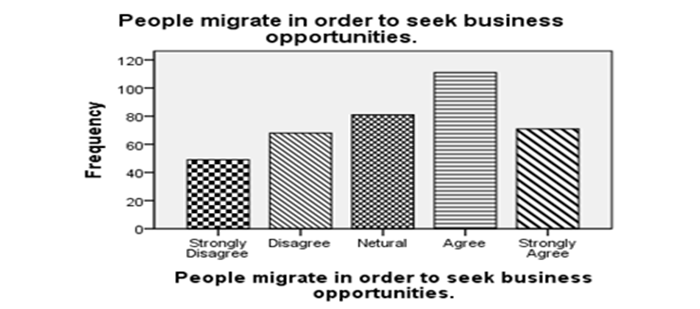
Fig-2.People migrate in order to seek business opportunities.
Interpretation
This table and chart shows that 29.2% people respond that people migrate in order to seek business opportunities but 21.3% people netural respond on this question.
Table-4. People migrate to overcome unemployment.
| Frequency | Percent | |
| Strongly Disagree | 61 | 16.1 |
| Disagree | 75 | 19.7 |
| Neutral | 70 | 18.4 |
| Agree | 102 | 26.8 |
| Strongly Agree | 72 | 18.9 |
| Total | 380 | 100.0 |
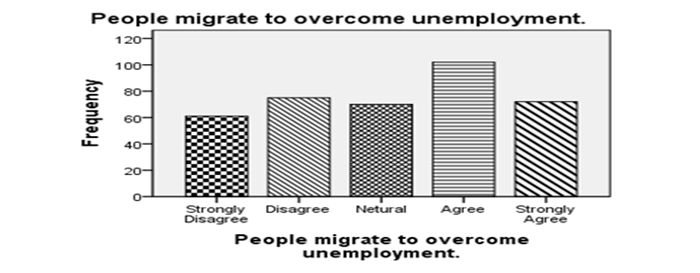
Fig-3. People migrate to overcome unemployment
Interpretation
This table and chart shows that 26.8% people respond that people migrate due to overcome unemployment.
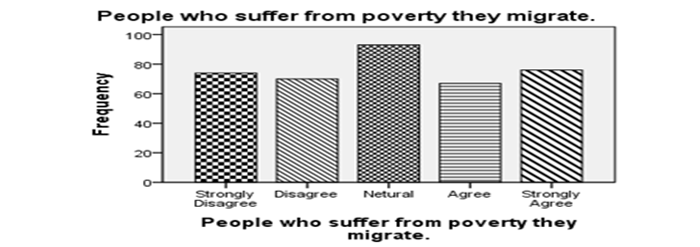
Table-5. People who suffer from poverty they migrate.
| Frequency | Percent | |
| Strongly Disagree | 74 | 19.5 |
| Disagree | 70 | 18.4 |
| Neutral | 93 | 24.5 |
| Agree | 67 | 17.6 |
| Strongly Agree | 76 | 20.0 |
| Total | 380 | 100.0 |
Interpretation
This frequency table and bar chart shows that 20.0% people respond that poverty is the basis reason of urbanization. But 24.5% people are neutral this question.
Table-6. People migrate to get some good income or salary
| Frequency | Percent | |
| Strongly Disagree | 66 | 17.4 |
| Disagree | 74 | 19.5 |
| Neutral | 73 | 19.2 |
| Agree | 87 | 22.9 |
| Strongly Agree | 80 | 21.1 |
| Total | 380 | 100.0 |
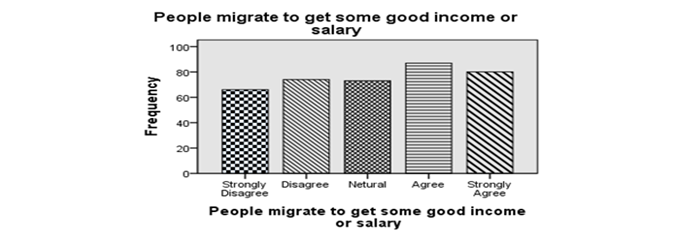
Fig-5. People who suffer from poverty they migrate.
Interpretation
This table and chart shows that the people respond that due to good income or salary the urbanization happen.
Table-7. People migrate due to some personal issue
| Frequency | Percent | |
| Strongly Disagree | 72 | 18.9 |
| Disagree | 82 | 21.6 |
| Neutral | 71 | 18.7 |
| Agree | 79 | 20.8 |
| Strongly Agree | 76 | 20.0 |
| Total | 380 | 100.0 |
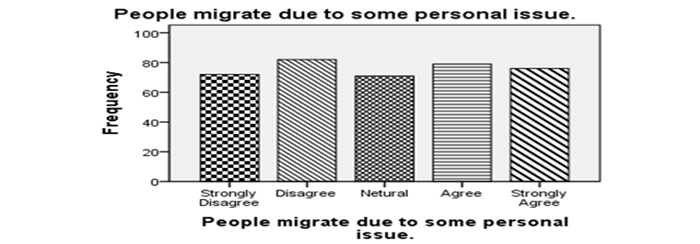
Fig-6. People migrate due to some personal issue
Interpretation
This frequency table and bar chart shows that 20.8% people respond that people migrate due to some personal issue but 21.6% people are disagree on this question.
Table-8. People migrate to get higher education.
| Frequency | Percent | |||
| Strongly Disagree | 54 | 14.2 | ||
| Disagree | 57 | 15.0 | ||
| Neutral | 70 | 18.4 | ||
| Agree | 114 | 30.0 | ||
| Strongly Agree | 85 | 22.4 | ||
| Total | 380 | 100.0 | ||
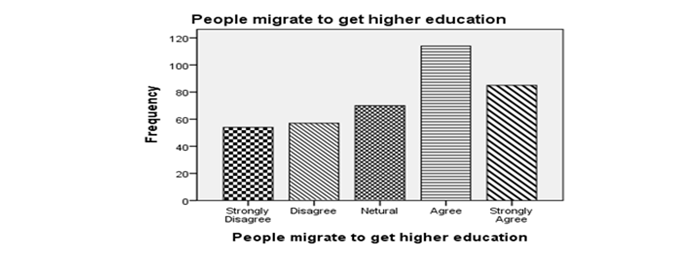
Fig-7. People migrate to get higher education
Interpretation
The most powerful push factor was the lack of educational opportunities. This table and chart shows that 30.0% people respond that they migrate for the sack of higher education.
Table-9. People migrate to achieve desired goal.
| Frequency | Percent | |
| Strongly Disagree | 75 | 19.7 |
| Disagree | 84 | 22.1 |
| Neutral | 82 | 21.6 |
| Agree | 79 | 20.8 |
| Strongly Agree | 60 | 15.8 |
| Total | 380 | 100.0 |
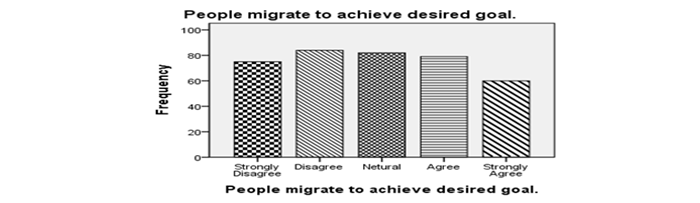
Fig-8. People migrate to achieve desired goal.
Interpretation
This frequency table and bar chart shows that 20.8% people think people migrate to achieve desired goal but 22.1% people disagree on this question.
Table-10. People migrate to seek better health facilities
| Frequency | Percent | |
| Strongly Disagree | 79 | 20.8 |
| Disagree | 76 | 20.0 |
| Neutral | 79 | 20.8 |
| Agree | 81 | 21.3 |
| Strongly Agree | 65 | 17.1 |
| Total | 380 | 100.0 |
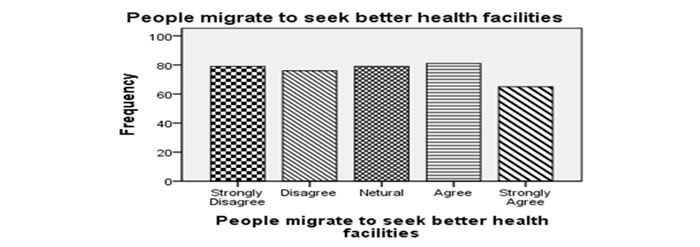
Fig- 9. People migrate to seek better health facilities
Interpretation
This table and chart shows that 21.3% respond that people migrate for seek better health facilities.
Table-11. People migrate due to crop failure in rural area.
| Frequency | Percent | |
| Strongly Disagree | 63 | 16.6 |
| Disagree | 75 | 19.7 |
| Neutral | 78 | 20.5 |
| Agree | 78 | 20.5 |
| Strongly Agree | 86 | 22.6 |
| Total | 380 | 100.0 |
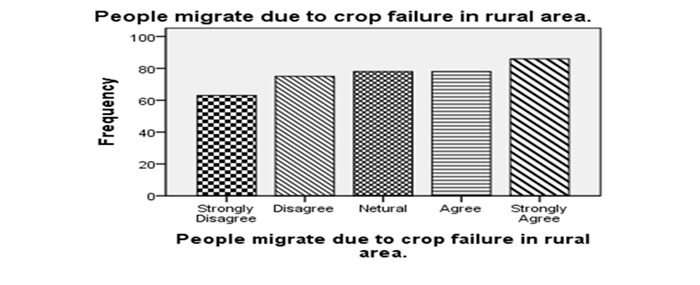
Fig-10. People migrate due to crop failure in rural area.
Interpretation
This frequency table and bar chart shows that 22.6% people strongly respond to crop failure in rural area.
Table-12. People migrate due to different disputes at that place
| Frequency | Percent | ||
| Strongly Disagree | 68 | 17.9 | |
| Disagree | 83 | 21.8 | |
| Neutral | 70 | 18.4 | |
| Agree | 70 | 18.4 | |
| Strongly Agree | 89 | 23.4 | |
| Total | 380 | 100.0 | |
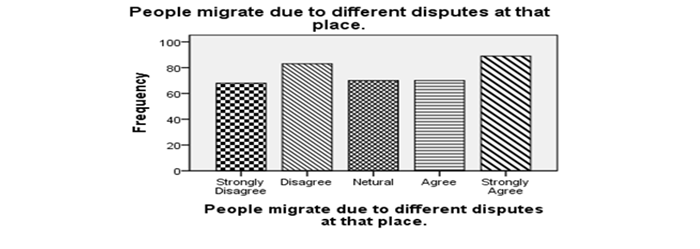
Fig-11. People migrate due to different disputes at that place
Interpretation
This table and chart shows that 23.4% people strongly respond that urbanization for different disputes at that place.
Table-13. People migrate to overcome drought.
| Frequency | Percent | |
| Strongly Disagree | 71 | 18.7 |
| Disagree | 84 | 22.1 |
| Neutral | 66 | 17.4 |
| Agree | 80 | 21.1 |
| Strongly Agree | 79 | 20.8 |
| Total | 380 | 100.0 |
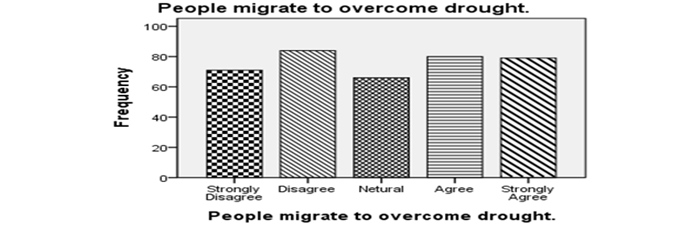
Fig-12. People migrate to overcome drought.
Interpretation
This frequency table and bar chart shows that 21.1% people respond for to overcome drought that urbanization happen.
Table-14. People migrate for better safety.
| Frequency | Percent | |
| Strongly Disagree | 57 | 15.0 |
| Disagree | 71 | 18.7 |
| Neutral | 91 | 23.9 |
| Agree | 90 | 23.7 |
| Strongly Agree | 71 | 18.7 |
| Total | 380 | 100.0 |
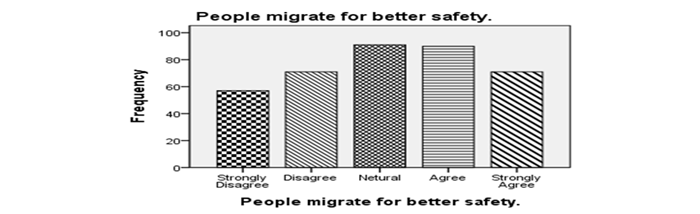
Fig-13.People migrate for better safety.
Interpretation
This table and chart shows that 23.7% people respond that people migrate for better safety and 23.9% people gave neutral respond.
Table-15. People migrate to change their climate
| Frequency | Percent | |
| Strongly Disagree | 80 | 21.1 |
| Disagree | 69 | 18.2 |
| Neutral | 75 | 19.7 |
| Agree | 72 | 18.9 |
| Strongly Agree | 84 | 22.1 |
| Total | 380 | 100.0 |
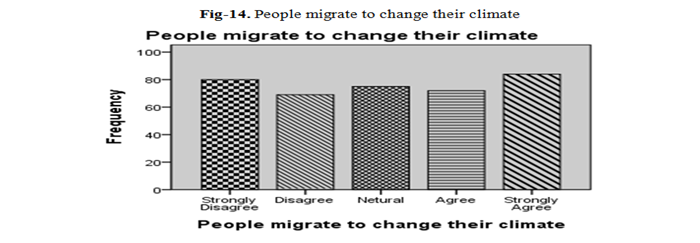
Fig-14. People migrate to change their climate
Interpretation
This table and chart shows that 22.1% people strongly respond that people migrate to change their climate.
Table-16. People migrate for better service provision.
| Frequency | Percent | |
| Strongly Disagree | 82 | 21.6 |
| Disagree | 77 | 20.3 |
| Neutral | 63 | 16.6 |
| Agree | 83 | 21.8 |
| Strongly Agree | 75 | 19.7 |
| Total | 380 | 100.0 |
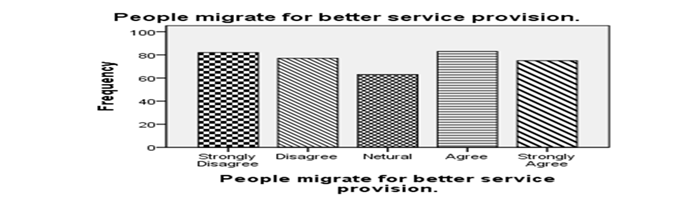
Fig-15. People migrate for better service provision.
Interpretation
This frequency table and bar chart shows that 21.8% people respond that people migrate for better service provision
6. RECOMMENDATION
We recommend to Government, make new hospital, school, college and factories in rural areas and provide job facilities in villages. In this way people not migrate from rural to urban areas and spend a life in best way. After this process our rural areas are well developed. And our country progress day by day. If our villages have all better living facilities then the rate of urbanization decreases that is better for cities. Because now a day’s cities become over crowded that cause of many problems, one of them is pollution. So highly recommended that government must take good steps for education in village and also some steps to overcome unemployment in village and provide them small business opportunities in their respective villages so as to minimize the increasing rate of urbanization.
REFERENCES
Goldscheider, 1971. Population, modernizations, and social structure. New York: Little, Brown and Company.
Jakson, G., 1969. Some sociological aspects of migration. Jakson (Eds). Migration. London: Cambridge University Press. pp: 60-73.
Ravenstein., 1889. “The laws of migration”. Journal of the Royal Statistical Society, 52(2): 241-305. DOI 10.2307/2979333.
UNESCO, 1956. The social implications of industrialization and urbanization: Five studies in Asia. Calcutta, India: UNESCO.